Abstract
Purpose:
This study aimed to identify the underlying mechanisms in pancreatic cancer (PC) carcinogenesis and those as potential prognostic biomarkers, which can also be served as new therapeutic targets of PC.
Methods:
Differentially expressed genes (DEGs) were identified between PC tumor tissues and adjacent normal tissue samples from a public GSE62452 dataset, followed by functional and pathway enrichment analysis. Then, protein–protein interaction (PPI) network was constructed and prognosis-related genes were screened based on genes in the PPI network, before which prognostic gene-related miRNA regulatory network was constructed. Functions of the prognostic gene in the network were enriched before which Kaplan–Meier plots were calculated for significant genes. Moreover, we predicted related drug molecules based on target genes in the miRNA regulatory network. Furthermore, another independent GSE60979 dataset was downloaded to validate the potentially significant genes.
Results:
In the GSE62452 dataset, 1017 significant DEGs were identified. Twenty-six important prognostic-related genes were found using multivariate Cox regression analysis. Through pathway enrichment analysis and miRNA regulatory analysis, we found that the 5 genes, such as Interleukin 22 Receptor Subunit Alpha 1 (IL22RA1), BCL2 Like 1 (BCL2L1), STAT1, MYC Proto-Oncogene (MYC), and Signal Transducer And Activator Of Transcription 2 (STAT2), involved in the Jak-STAT signaling pathway were significantly associated with prognosis. Moreover, the expression change of these 5 genes was further validated using another microarray dataset. Additionally, we identified camptothecin as an effective drug for PC.
Conclusion:
IL22RA1, BCL2L1, STAT1, MYC, and STAT2 involved in the Jak-STAT signaling pathway may be significantly associated with prognosis of PC.
Keywords: differentially expressed genes, miRNA regulatory network, pancreatic cancer, prognostic biomarkers
1. Introduction
Pancreatic cancer (PC) is one of the most lethal malignancies worldwide with an estimated 53,670 new cases diagnosed and 43,090 deaths in the United States in 2017.[1] Although great progress has been made in the management of PC, the overall 5-year survival rate for patients with PC remains disma—approximately at 5% and the prognosis of PC is poor.[2] The poor prognosis mainly results from delayed diagnosis, early metastasis, and aggressive local invasion.[3] Therefore, it is of great clinical value to improve understanding of the underlying molecular and seek new biomarkers for more reliable and treatments for patients with PC.
Several elements, such as smoking and inherited mutations, have been identified as risk factors for this disease.[4] However, the exact causes were still not clear. Recently, Mao et al[5] showed that change of granulocyte adhesion pathway and alteration of Keratin 16 (KRT16) were involved in the pathogenesis of PC. A study revealed brain and muscle ARNT-like 1 (BMAL1) as an antioncogene in PC by activating the p53 tumor suppressor pathway.[6] Additionally, the Notch pathway was shown to play a role in maintaining the cancer stem cell in PC.[7] Most prognostic markers, such as tumor differentiation, lymph node status, and micrometastasis, are not preoperatively accessible. Prognostic genes can provide insights into the molecular mechanisms of tumor progression and have potential as biomarkers, which are informative regarding clinical outcomes.[8] A recent study indicated that overexpression of topoisomerase 2-alpha was in association with a poor prognosis in pancreatic adenocarcinoma.[9] cyclin G2 expression inversely reflected cancer progression and was reported to be a possible independent prognostic marker in PC.[10] Moreover, miRNA-196b was an independent prognostic biomarker in patients with PC.[11] Multiple studies have confirmed that carcinoembryonic antigen and carbohydrate antigen 19-9 can be used for the diagnosis and follow-up of multiple diseases, including PC.[12] However, these biomarkers are not sufficiently sensitive or specific for use in PC.[13,14] Although tremendous efforts have been made to explore the pathogenesis of PC, there still lacks a overall understanding of underlying molecular events, which help reveal key genes and identify prognostic genes for PC. Moreover, the identification of novel PC-specific molecular biomarkers is crucial for early effective diagnosis and prognosis.
To develop a better molecular understanding and select prognostic biomarker candidates for PC, it is necessary to investigate the gene expression profiles in PC tumor tissues and nontumor tissues. In this study, differentially expressed genes (DEGs) were identified between PC tumor tissues and adjacent normal tissue samples from a public downloaded dataset, and comprehensive bioinformatics analysis was conducted. Here we aimed to identify the underlying mechanisms in PC carcinogenesis and those as potential prognostic biomarkers, which can also be served as new therapeutic targets of PC.
2. Materials and methods
2.1. Data collection and DEGs screening
Two sets of gene expression profiles under the accession number of GSE62452[15] and GSE60979[16] were downloaded from the Gene Expression Omnibus (GEO) repository at the National Center for Biotechnology Information[17] (http://www.ncbi.nlm.nih.gov/geo/). The GSE62452 dataset contained 69 pancreatic tumor tissue samples and 61 adjacent normal samples; the GSE60979 dataset included 49 PC samples and 12 adjacent normal samples. Platforms used for gene profiling of GSE62452 and GSE60979 are GPL6244 (Affymetrix) and GPL14550 (Agilent), respectively. GSE62452 was used as a major analytical dataset for this analysis, while GSE60979 served as a validation dataset for verifying gene expression values following screening of important genes. This study just re-analyzed the microarray data downloaded from public database and performed bioinformatics analysis. No experiments were performed on humans or animals for this investigation. Thus, ethics approval or consent to participate was not applicable.
For the GSE62452 dataset, raw data in Affymetrix CEL files were downloaded from the GEO database, which were then preprocessed using the oligo package (Bioconductor) (http://www.bioconductor.org/packages/oligo.html; version 1.40.2)[18] in R3.1.3, including background correction and quantile normalization. For the GSE60979 dataset, we downloaded raw data provided as TXT format files. The probes were annotated to corresponding genes according to information from the annotation platform. If a gene can correspond to multiple probes, average expression value of the multiple probes was calculated as the expression value of the gene. Thereafter, the data were log2 transformed using limma package[19] (version 3.32.5; http://bioconductor.org/packages/release/bioc/html/limma.html) in R3.1.3 to approximately follow the normal distribution, and then the data were normalized by the median normalization method.[20]
Then, the limma package[19] was used to screen the significant DEGs in the GSE62452 dataset, and the false discovery rate value <0.05 and |log2 fold change (FC)| > 0.585 were selected as the threshold for selecting the DEGs.
2.2. Two-way hierarchical clustering analysis of DEGs
Hierarchical clustering is a powerful data mining technique that has been widely applied to search for groups (clusters) of genes with similar expression patterns or conditions from gene expression data.[21] Two-way hierarchical clustering of both genes and samples can define patterns of genes that are expressed across many samples, producing both gene clusters and sample clusters.[22] In this study, the expression values of the significant DEGs in each sample were extracted from the GSE62452 dataset, and 2-way hierarchical clustering analysis was performed using the pheatmap package[23] in R3.1.3 (version 1.0.8; https://cran.r-project.org/package=pheatmap) based on the Euclidean distance.[24] The result was represented by a heatmap.
2.3. Functional and pathway enrichment analysis of genes with differential expression
Database for Annotation, Visualization, and Integrated Discovery (DAVID) bioinformatics resource is an easy-to-use web tool for systematic and integrative analysis of large gene lists to facilitate the functional annotation and analysis.[25] The DAVID 6.7 (https://david.ncifcrf.gov/) online search software was applied in this study to identify significantly associated Gene Ontology (GO) function and Kyoto Encyclopedia of Genes and Genomes (KEGG) pathway of DEGs. The most significant enrichment of biological annotations is based on the hypergeometric distribution algorithm, as shown below. The threshold of over-represented GO terms and KEGG pathways of DEGs was set as P < .05. (The functional and pathway enrichment analysis methods used in the rest of this article are the same as those here.)
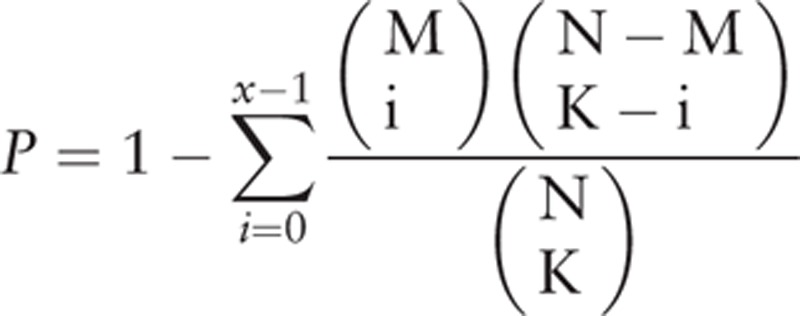 |
N represents the total number of genes in the whole genome, M represents the number of pathway genes, and K represents the number of DEGs. Fisher score represents the probability that at least x genes of the K DEGs belong to the pathway genes.
2.4. Construction of PPI network
With the advent of the postgenome era, protein research has become an extremely important subject. Proteins are the direct function executors of myriad life activities, and most biological processes involve the precise regulation of protein. Protein–protein interaction played an important role in protein function.[26] Therefore, studying how proteins interact with each other to form an intermolecular regulatory network will not only help to understand various biological processes from the system point of view, but also can be widely used to explore the mechanism of disease.
In this analysis, protein–protein interaction (PPI) relationships were derived from 3 PPI databases, STRING[27] (version: 10.0, http://string-db.org/), BioGRID[28] (version: 3.4, https://wiki.thebiogrid.org/), and HPRD[29] (release 9, http://www.hprd.org/). We took the union of PPI information from these 3 databases as a background to get access to PPI relationships of DEGs. PPI network was constructed and visualized through Cytoscape 3.3[30] (http://www.cytoscape.org/).
2.5. Screening of prognosis-related gene
Among the 69 PC samples in the main analysis dataset GSE62452, a total of 65 tumor samples were found to carry additional information on tumor prognosis. There into, death and survival samples were 49 and 16, with an average survival time of 20.203 ± 16.684 months. Univariate and multivariate Cox regression analyses of the survival package (version 2.41.3) (http://bioconductor.org/packages/survival/)[31] in R3.1.3 language were performed to screen for genes that are significantly associated with prognosis. A P value < .05 based on the log-rank test was selected as the screening threshold.
2.6. Construction of prognostic gene-related miRNA regulatory networks
First, we used miR2Disease[32] (http://watson.compbio.iupui.edu:8080/miR2Disease/index.jsp) database to search for miRNAs that had direct associations with PC. Each entry in miR2Disease database (http://watson.compbio.iupui.edu:8080/miR2Disease/index.jsp) includes detailed information on miRNA-disease relationships, such as disease name, miRNA ID, a expression pattern of miRNA in the disease state, miRNA-disease relationship, and references.[32] In this study, we used “pancreatic cancer” as the name of the disease to search for miRNAs associated with the disease reported in the literature.
We then searched the target genes for directly associated miRNAs with the miRanda database[33] (http://www.microrna.org/microrna/home.do). miRanda is the earliest miRNA target gene prediction software. The prognosis-related genes were mapped to the target genes regulated by miRNAs, and the miRNA regulatory network was constructed. The functions and pathways of the target genes regulated by miRNAs were enriched and analyzed. Furthermore, Kaplan–Meier plots[34] were calculated for significant genes to assess the relationship between genes and prognosis.
2.7. Search for the target gene-related drug molecules in the regulatory network
In this study, Connectivity Map (CAMP, https://portals.broadinstitute.org/cmap/) was used in cancer drug discovery.[35] Prognosis-related target genes of miRNAs were used to query the PC-related compounds. The drugs with |score| > 0.8 in this article were retained as small-molecular drugs with high correlation.
3. Results
3.1. Identification of DEGs
In the GSE62452 dataset, 1017 significant DEGs were identified between PC samples and control samples, of which 311 were down-regulated and 706 genes were up-regulated. A volcano plot of the DEGs was shown in Fig. 1. Additionally, a heat-map overview of the 2-way hierarchical clustering analysis of DEGs was shown in Fig. 1B. From the heat map, we found that the expression values of DEGs obtained can separate the different types of samples and the color was clear, indicating that the identified DEGs can be used to distinguish PC samples from control samples.
Figure 1.
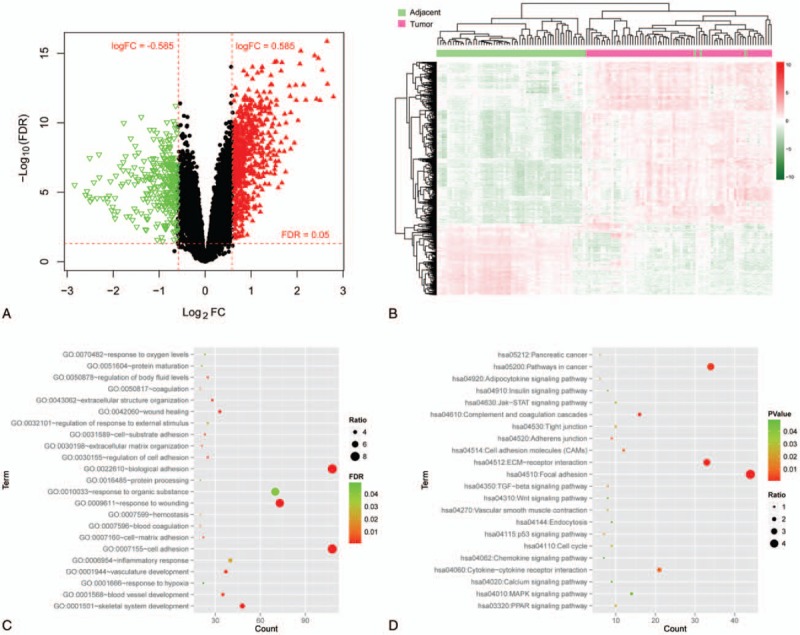
Identification of DEGs and functional enrichment analysis. (A) Volcano plot of the DEGs. Red horizontal dotted line represents the threshold line of false discovery rate = 0.05; red vertical dashed line indicates the threshold line of |log2FC| > 0.585. Red triangle represents significantly up-regulated gene, green inverted triangle represents significantly down-regulated gene, and black dot indicates non-DEG. (B) Heat map of DEGs. Red indicates up-regulation and green indicates down-regulation. In the above sample bar, the green represents adjacent normal samples and light purple indicates pancreatic cancer tumor tissue. Enriched Gene Ontology biology process terms (C) and Kyoto Encyclopedia of Genes and Genomes pathways (D) of DEGs. The abscissa represents the number of genes involved in the corresponding biological processes and pathways, and the ordinate indicates the biological process and the pathway. The color of the point from green to red indicates a significant change in the value of P from small to large, and the size of the point indicates ratio (ratio = number of genes involved in function or pathway/number of background genes). DEGs = differentially expressed genes, FC = fold change.
3.2. GO and KEGG pathway enrichment analysis of DEGs
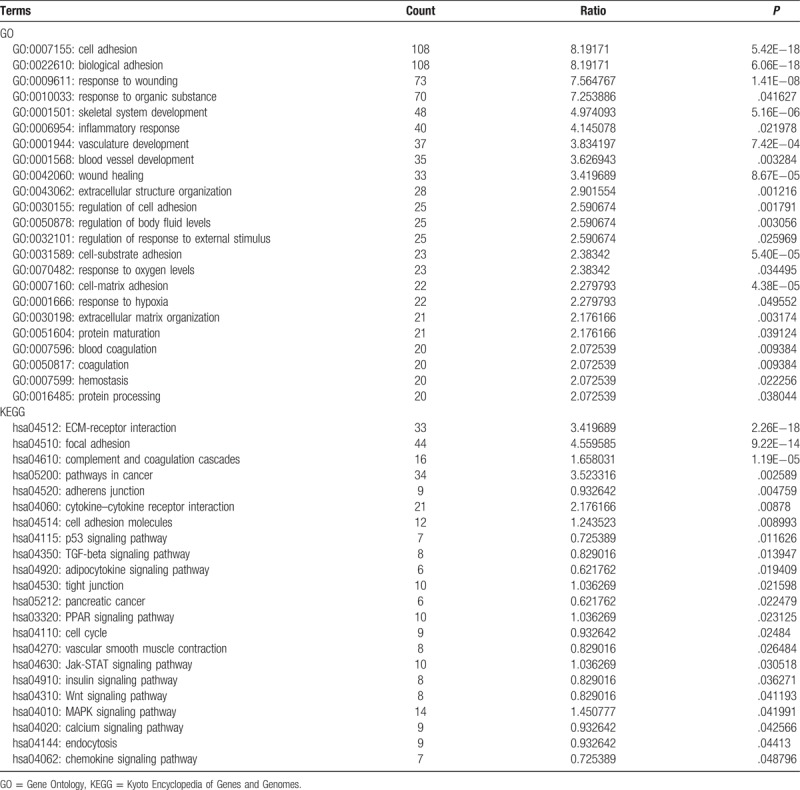
We performed GO and pathway enrichment analysis of DEGs to investigate the involved functions, which revealed that 23 GO terms and 22 KEGG pathways were enriched by all the DEGs (Table 1 and Fig. 1). The most enriched GO terms were “cell adhesion” (GO:0007155) and “biological adhesion” (GO:0022610) in biological processes category (Table 1). On the other hand, the DEGs were significantly enriched in the pathways, such as “ECM-receptor interaction,” “Focal adhesion,” “Cytokine-cytokine receptor interaction,” and “JAK (Janus tyrosine Kinase)-STAT (Signal Transducer and Activator of Transcription) signaling pathway.”
Table 1.
Enriched GO terms and pathways of the identified differentially expressed genes.
3.3. PPI network construction
In total, 1663, 847, and 386 PPI pairs of DEGs were obtained in the STRING, BioGRID, and HPRD databases, respectively. A total of 2061 pairs of interactions (the union of those from 3 databases) are used to construct the PPI network, as shown in Fig. 2, which consisted of 462 nodes and 2061 edges (interactions). The nodes contained 110 down-regulated genes and 352 genes that were up-regulated.
Figure 2.
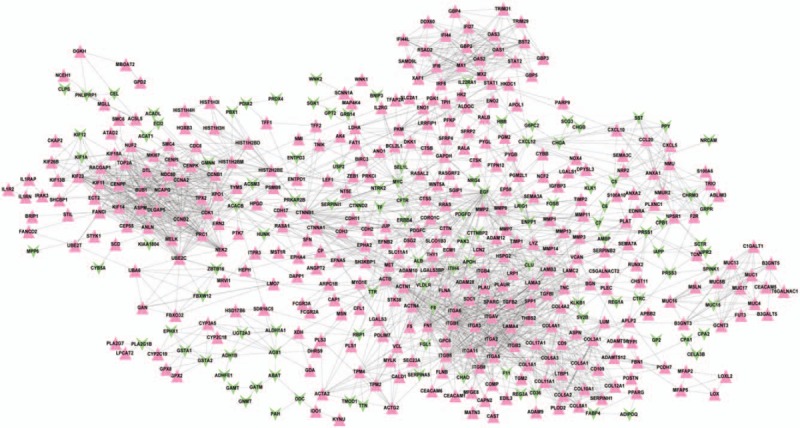
Protein–protein interaction network. Red triangle represents up-regulated gene, and the green inverted triangle represents down-regulated gene.
3.4. Screening of prognostic-related genes from DEGs and construction of miRNA regulatory network
Based on the gene expression values of 462 nodes in the PPI network and prognosis information of samples, a total of 116 prognostic-related genes were identified using univariate cox regression analysis. Ultimately, 26 important prognostic-related genes were found using multivariate cox regression analysis (Table 2), such as BCL2 Like 1 (BCL2L1) and Interleukin 22 Receptor Subunit Alpha 1 (IL22RA1).
Table 2.
Multivariate cox regression analysis of prognostic-associated genes.

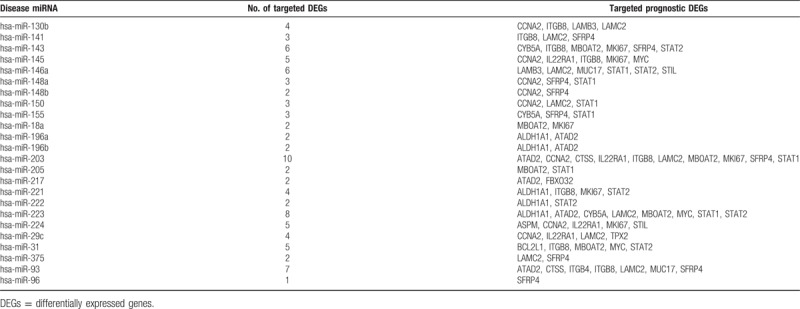
A total of 24 miRNAs were found to be associated with PC by searching in the miR2Disease database, and miRanda was used to search for target genes of these 24 miRNAs. The target genes were mapped to the important prognostic-related genes and 93 pairs of regulatory relationships were identified. Figure 3A shows the miRNA regulatory network constructed based on the 24 miRNAs and their target prognostic-related genes, which included 46 nodes, of which 24 miRNAs and 22 target prognostic-related genes (4 down-regulated and 18 up-regulated genes) were included, and 111 edges, of which 93 miRNA-gene interactions and 18 gene–gene interactions were included. The disease-related miRNAs and their target prognostic-related genes were listed in Table 3.
Figure 3.
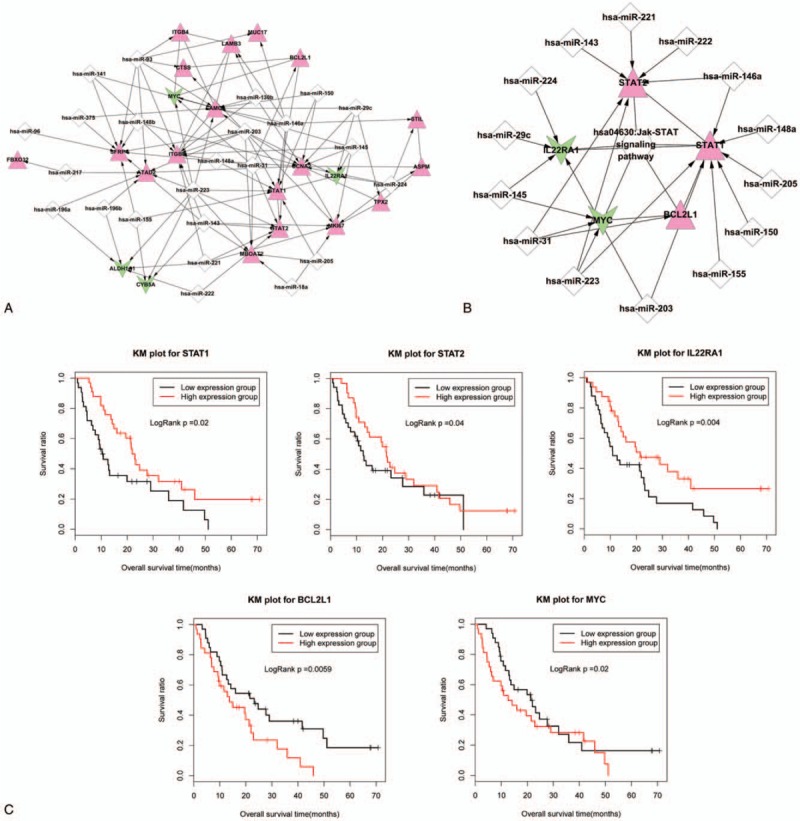
miRNA regulatory networks and Kaplan–Meier curves of 5 genes involved in Jak-STAT signaling pathways. (A) miRNA regulatory network constructed based on the 24 pancreatic cancer-related miRNAs and their target prognostic-related genes. The red triangle represents up-regulated gene, the green inverted triangle represents down-regulated gene, and the white diamond represents the pancreatic cancer-related miRNA. The edge of arrow indicates that the miRNA-gene interaction and the linkage without arrow indicates gene–gene interaction. (B) Jak-STAT signaling pathway-related miRNA regulatory network. The red triangle represents up-regulated gene, the green inverted triangle represents down-regulated gene, the white diamond represents the pancreatic cancer-related miRNA, and the circular node represents the Jak-STAT signaling pathway. The edge with arrow indicates that the miRNA-target gene linkage, and the edge without arrow indicates linkage between gene and the pathway. (C) The Kaplan–Meier curves of the 5 genes involved in the Jak-STAT signaling pathway. The red curve shows high-expression group and the black curve shows low-expression group.
Table 3.
Disease-related miRNAs and their target prognostic-related genes.
The 22 target prognostic-related genes in the miRNA regulatory network were significantly enriched in 4 KEGG pathways, hsa04630: Jak-STAT signaling pathway (P = 3.40E−04), hsa04512: ECM-receptor interaction (8.59E−04), hsa05200: pathways in cancer (0.005558), and hsa04510: focal adhesion (0.010277). In particular, the regulated target prognostic-related genes were most significantly involved in the Jak-STAT signaling pathway, with 5 genes involved: IL22RA1, BCL2L1, Signal Transducer And Activator Of Transcription 1 (STAT1), MYC Proto-Oncogene, BHLH Transcription Factor (MYC), and Signal Transducer And Activator Of Transcription 2 (STAT2) (Fig. 4A). We independently extracted the regulatory relationship between these 5 genes from the miRNA regulatory network and constructed the Jak-STAT signaling pathway-related miRNA regulatory network (Fig. 3B), which included 14 miRNAs.
Figure 4.
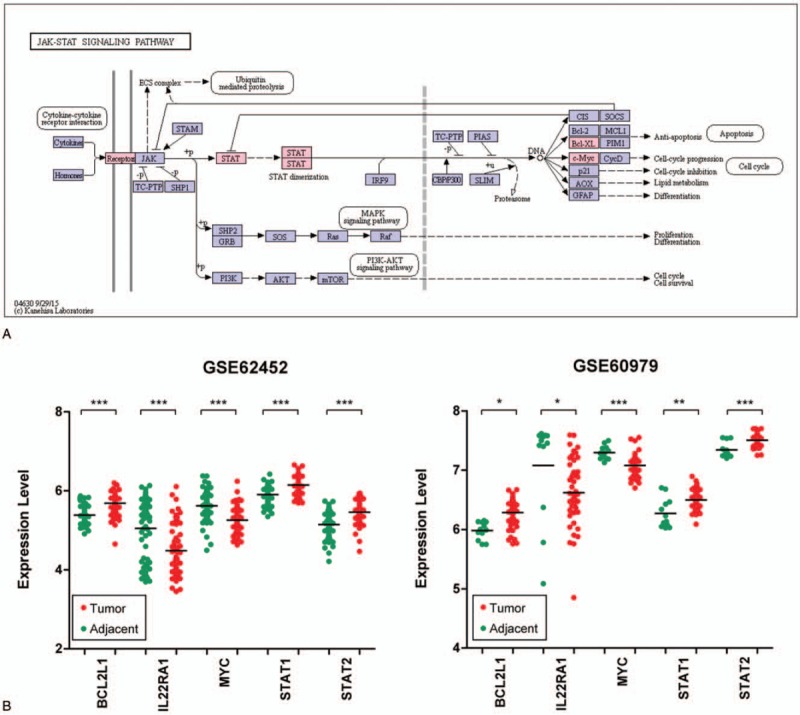
Jak-STAT signaling pathway (A) and data validation using GSE60979 (B).
On the other hand, we performed Kaplan–Meier curves on the 5 prognostic-related genes involved in the Jak-STAT signaling pathway, dividing the expression of each gene in all samples into a high-expression group (expression above that in the sample with the median expression values) and low-expression group (expression less than that in the sample with the median expression values). The results (Fig. 3C) showed that high-expression group of STAT1, STAT2, and IL22RA1 genes had better survival rate, and low-expression group of BCL2L1 and MYC genes had better survival rate.
3.5. Screening of related small-molecule drugs
Several small-molecule drugs were found to have negative correlation with PC using the CMAP database, such as camptothecin (correlation score = −0.947), butein (correlation score = −0.928), 8-azaguanine (correlation score = −0.921), and alsterpaullone (correlation score = −0.921). Two small-molecule drugs were found to have positive correlation with PC, containing (correlation score = −0.836) and vigabatrin (correlation score = 0.85).
3.6. Validation of the 5 prognostic-related genes involved in the Jak-STAT signaling pathway using GSE60979 dataset
In the dataset GSE62452, IL22RA1 and MYC genes were significantly downregulated in PC tissue samples; BCL2L1, STAT1, and STAT2 genes were significantly upregulated in cancer samples. As shown in Fig. 4B, we used another independent dataset GSE60979 to validate the expression characteristics of these 5 genes in different types of samples. As a result, we found that they presented differential expression in the PC tumor samples, and their change directions were exactly the same as those in the GSE62452 dataset.
4. Discussion
Determining differences in gene expression in PC tissues compared with controls is essential to a better knowledge of key moleculars involved in the occurrence and development of PC that may help find a more effective treatment and effective markers for PC patients. In the present study, 26 prognostic seed genes were identified as key prognostic genes. Through pathway enrichment analysis and miRNA regulatory analysis, we found that the 5 genes, IL22RA1, BCL2L1, STAT1, MYC, and STAT2, involved in the Jak-STAT signaling pathway were significantly associated with prognosis. Moreover, the expression change of these 5 genes was further validated using another microarray dataset. In addition, we identified camptothecin as an effective drug for PC.
Jak-STAT signaling pathway is one of the signal transduction cascades for development and homeostasis in animals.[36] Dysregulation of the JAK-STAT pathway affected regulation of cell growth, proliferation, apoptosis, and multiple other processes.[37] Previous study indicated that the JAK-STAT pathway was involved in the anticancer agent-mediated gene transcription in PC cell lines.[38] Thoennissen et al[39] demonstrated that cucurbitacin B induced the apoptosis of PC cells by inhibition of the JAK-STAT pathway. In this study, we found that the JAK-STAT pathway was significantly enriched by the target prognostic genes in the miRNA regulatory network. In this context, it is surmised that dysregulation of the JAK-STAT pathway may be significantly associated with the development and progression of PC.
Moreover, we found 5 prognostic genes, IL22RA1, BCL2L1, STAT1, MYC, and STAT2, involved in the Jak-STAT signaling pathway. Jak-STAT signaling pathway has 3 components: receptor, JAK kinase and STAT factor JAK belongs to a family of nonreceptor protein tyrosine kinases, which is composed of 4 proteins, JAK1, JAK2, JAK3, and TYK2 (nonreceptor Protein Tyrosine Kinase-2). STATs act as transcriptional factors that are phosphorylated on tyrosine residues.[40] In combination with the position of 5 genes involved in the pathway (Fig. 4A), IL22RA1 is located in the stage of tyrosine kinase-related receptors, which is responsible for the binding of cytokines in the pathway, and the binding of cytokines to the corresponding receptors leads to dimerization of the receptor molecules. STAT1 and STAT2 are involved in the dimerization of the receptor molecule. BCL2L1 and MYC are involved in the effect phase and then participate in the regulation of apoptosis and cell cycle. In this study, these 5 genes were identified as key prognostic genes for PC. A recent study have demonstrated that IL22RA1/STAT3 signaling promotes stemness and tumorigenicity in PC.[41] Sun et al[42] showed that differential expression of STAT1 was shown to predict the progression and prognosis of PC. In another study, BCL2L1 was also demonstrated to be differentially expressed in PC samples and normal-appearing tissue samples.[43] Additionally, the findings of Farrell et al[44] indicated that MYC regulated ductal-neuroendocrine lineage plasticity in pancreatic ductal adenocarcinoma, contributing to poor survival and chemoresistance. Thus, it is noteworthy that IL22RA1, BCL2L1, STAT1, MYC, and STAT2 may play critical roles in the pathogenesis of PC and may be correlated with the prognosis of PC. Furthermore, we used another dataset to validate the expression change of these 5 genes and we found that their change directions were exactly the same as those in the GSE62452 dataset. Nevertheless, further investigation is required to evaluate the clinical utility of these genes.
In addition, through the screening of drug molecules, we found the potential antitumor activity of camptothecin to PC. Camptothecin is a natural inhibitor of DNA topoisomerase I for clinical use.[45] It has become a hot research topic in anticancer drugs after paclitaxel. Inhibition of DNA topoisomerase I blocks DNA replication and affects cancer cells.[46] Evidence has indicated efficacy of camptothecin in many cancers, such as colon cancer,[47] gastrointestinal cancer, and bladder cancer.[48] Considering the predictive role of this drug-targeting prognostic genes of PC, PC-specific genes, it is highly likely that camptothecin produces antitumor activity in PC cells.
In conclusion, we suggested that the JAK-STAT pathway may be significantly associated with the development and progression of PC. Besides, several key genes (IL22RA1, BCL2L1, STAT1, STAT2, and MYC) may be associated with the prognosis of PC. While our study provides insight into some prognostic genes, the functions of these key genes need to be validated by further experimental investigations in future.
Author contributions
Conceptualization: Bo Meng.
Data curation: Chun Pang, Yuan Gu, Yuechao Ding, Chao Ma, Wei Yv.
Formal analysis: Chun Pang, Yuan Gu, Yuechao Ding, Chao Ma, Qian Wang.
Methodology: Chao Ma, Bo Meng.
Project administration: Bo Meng.
Software: Chun Pang, Yuan Gu, Qian Wang.
Supervision: Bo Meng.
Validation: Chun Pang, Yuan Gu, Yuechao Ding, Chao Ma, Wei Yv, Qian Wang, Bo Meng.
Visualization: Chun Pang, Bo Meng.
Writing – original draft: Chun Pang, Wei Yv.
Writing – review & editing: Bo Meng.
Bo Meng orcid: 0000-0002-9670-3258.
Footnotes
Abbreviations: BCL2L1 = BCL2 Like 1, DAVID = Database for Annotation, Visualization, and Integrated Discovery, DEGs = differentially expressed genes, FC = fold change, GEO = Gene Expression Omnibus, GO = Gene Ontology, IL22RA1 = Interleukin 22 Receptor Subunit Alpha 1, KEGG = Kyoto Encyclopedia of Genes and Genomes, MYC = MYC Proto-Oncogene, BHLH Transcription Factor, PC = pancreatic cancer, PPI = protein–protein interaction, STAT1 = Signal Transducer And Activator Of Transcription 1, STAT2 = Signal Transducer And Activator Of Transcription 2.
This work was supported by the 2014 science and technology breakthrough project of Henan Provincial Science and Technology Department (No. 142300410279).
The authors have no conflicts of interest to disclose.
References
- [1].Chiaravalli M, Reni M, O’Reilly EM. Pancreatic ductal adenocarcinoma: state-of-the-art 2017 and new therapeutic strategies. Cancer Treat Rev 2017;60:32–43. [DOI] [PubMed] [Google Scholar]
- [2].Siegel RL, Miller KD, Jemal A. Cancer statistics, 2016. CA Cancer J Clin 2016;66:7–30. [DOI] [PubMed] [Google Scholar]
- [3].Kamisawa T, Wood LD, Itoi T, et al. Pancreatic cancer. Lancet 2016;388:73–85. [DOI] [PubMed] [Google Scholar]
- [4].Kolodecik T, Shugrue C, Ashat M, et al. Risk factors for pancreatic cancer: underlying mechanisms and potential targets. Front Physiol 2014;4:415. [DOI] [PMC free article] [PubMed] [Google Scholar]
- [5].Mao Y, Shen J, Lu Y, et al. RNA sequencing analyses reveal novel differentially expressed genes and pathways in pancreatic cancer. Oncotarget 2017;8:42537–47. [DOI] [PMC free article] [PubMed] [Google Scholar]
- [6].Kim K, Jutooru I, Chadalapaka G, et al. HOTAIR is a negative prognostic factor and exhibits pro-oncogenic activity in pancreatic cancer. Oncogene 2013;32:1616. [DOI] [PMC free article] [PubMed] [Google Scholar]
- [7].Abel EV, Kim EJ, Wu J, et al. The Notch pathway is important in maintaining the cancer stem cell population in pancreatic cancer. PLoS ONE 2014;9:e91983. [DOI] [PMC free article] [PubMed] [Google Scholar]
- [8].Yang Y, Han L, Yuan Y, et al. Gene co-expression network analysis reveals common system-level properties of prognostic genes across cancer types. Nat Commun 2014;5:3231. [DOI] [PMC free article] [PubMed] [Google Scholar]
- [9].Zhou Z, Liu S, Zhang M, et al. Overexpression of topoisomerase 2-alpha confers a poor prognosis in pancreatic adenocarcinoma identified by co-expression analysis. Dig Dis Sci 2017;62:2790–800. [DOI] [PubMed] [Google Scholar]
- [10].Hasegawa S, Nagano H, Konno M, et al. Cyclin G2: a novel independent prognostic marker in pancreatic cancer. Oncol Lett 2015;10:2986–90. [DOI] [PMC free article] [PubMed] [Google Scholar]
- [11].Kanno S, Nosho K, Ishigami K, et al. MicroRNA-196b is an independent prognostic biomarker in patients with pancreatic cancer. Carcinogenesis 2017;38:425–31. [DOI] [PubMed] [Google Scholar]
- [12].Ozkan H, Kaya M, Cengiz A. Comparison of tumor marker CA 242 with CA 19-9 and carcinoembryonic antigen (CEA) in pancreatic cancer. Hepatogastroenterology 2003;50:1669–74. [PubMed] [Google Scholar]
- [13].Zhu L, Xue HD, Liu W, et al. Enhancing pancreatic mass with normal serum CA19-9: key MDCT features to characterize pancreatic neuroendocrine tumours from its mimics. Radiol Med 2017;122:337–44. [DOI] [PubMed] [Google Scholar]
- [14].Swords DS, Firpo MA, Scaife CL, et al. Biomarkers in pancreatic adenocarcinoma: current perspectives. Onco Targets Ther 2016;9:7459–67. [DOI] [PMC free article] [PubMed] [Google Scholar]
- [15].Yang S, He P, Wang J, et al. A novel MIF signaling pathway drives the malignant character of pancreatic cancer by targeting NR3C2. Cancer Res 2016;76:3838–50. [DOI] [PMC free article] [PubMed] [Google Scholar]
- [16].Sandhu V, Bowitz Lothe I, Labori KJ, et al. Molecular signatures of mRNAs and miRNAs as prognostic biomarkers in pancreatobiliary and intestinal types of periampullary adenocarcinomas. Mol Oncol 2015;9:758–71. [DOI] [PMC free article] [PubMed] [Google Scholar]
- [17].Barrett T, Troup DB, Wilhite SE, et al. NCBI GEO: archive for high-throughput functional genomic data. Nucleic Acids Res 2008;37:D885–90. [DOI] [PMC free article] [PubMed] [Google Scholar]
- [18].Parrish RS, Spencer HJ., III Effect of normalization on significance testing for oligonucleotide microarrays. J Biopharm Stat 2004;14:575–89. [DOI] [PubMed] [Google Scholar]
- [19].Smyth GK. Limma: Linear Models for Microarray Data. Bioinformatics and Computational Biology Solutions Using R and Bioconductor. 2005;New York, NY: Springer, 397–420. [Google Scholar]
- [20].Zyprych-Walczak J, Szabelska A, Handschuh L, et al. The impact of normalization methods on RNA-Seq data analysis. Biomed Res Int 2015;2015:621690. [DOI] [PMC free article] [PubMed] [Google Scholar]
- [21].Bouguettaya A, Yu Q, Liu X, et al. Efficient agglomerative hierarchical clustering. Expert Syst Appl 2015;42:2785–97. [Google Scholar]
- [22].Tang C, Zhang L, Zhang A, et al. Interrelated two-way clustering: an unsupervised approach for gene expression data analysis. Paper presented at: Bioinformatics and Bioengineering Conference, 2001. Proceedings of the IEEE 2nd International Symposium on 2001; Washington: IEEE Computer Society:41–48. [Google Scholar]
- [23].Xavier RN, Morgan HW, McDonald IR, et al. Effect of long-term starvation on the survival, recovery, and carbon utilization profiles of a bovine Escherichia coli O157:H7 isolate from New Zealand. Appl Environ Microbiol 2014;80:4383–90. [DOI] [PMC free article] [PubMed] [Google Scholar]
- [24].Danielsson P-E. Euclidean distance mapping. Comput Vis Graph Image Process 1980;14:227–48. [Google Scholar]
- [25].Huang DW, Sherman BT, Tan Q, et al. DAVID bioinformatics resources: expanded annotation database and novel algorithms to better extract biology from large gene lists. Nucleic Acids Res 2007;35:W169–75. [DOI] [PMC free article] [PubMed] [Google Scholar]
- [26].Keskin O, Tuncbag N, Gursoy A. Predicting protein–protein interactions from the molecular to the proteome level. Chem Rev 2016;116:4884–909. [DOI] [PubMed] [Google Scholar]
- [27].Szklarczyk D, Franceschini A, Wyder S, et al. STRING v10: protein–protein interaction networks, integrated over the tree of life. Nucleic Acids Res 2014;43:D447–52. [DOI] [PMC free article] [PubMed] [Google Scholar]
- [28].Chatr-aryamontri A, Oughtred R, Boucher L, et al. The BioGRID interaction database: 2017 update. Nucleic Acids Res 2017;45:D369–79. [DOI] [PMC free article] [PubMed] [Google Scholar]
- [29].Keshava Prasad T, Goel R, Kandasamy K, et al. Human protein reference database—2009 update. Nucleic Acids Res 2008;37:D767–72. [DOI] [PMC free article] [PubMed] [Google Scholar]
- [30].Shannon P, Markiel A, Ozier O, et al. Cytoscape: a software environment for integrated models of biomolecular interaction networks. Genome Res 2003;13:2498–504. [DOI] [PMC free article] [PubMed] [Google Scholar]
- [31].Wang P, Wang Y, Hang B, et al. A novel gene expression-based prognostic scoring system to predict survival in gastric cancer. Oncotarget 2016;7:55343–51. [DOI] [PMC free article] [PubMed] [Google Scholar]
- [32].Jiang Q, Wang Y, Hao Y, et al. miR2Disease: a manually curated database for microRNA deregulation in human disease. Nucleic Acids Res 2008;37:D98–104. [DOI] [PMC free article] [PubMed] [Google Scholar]
- [33].Moreno-Moya JM, Vilella F, Simón C. MicroRNA: key gene expression regulators. Fertil Steril 2014;101:1516–23. [DOI] [PubMed] [Google Scholar]
- [34].Takamizawa J, Konishi H, Yanagisawa K, et al. Reduced expression of the let-7 microRNAs in human lung cancers in association with shortened postoperative survival. Cancer Res 2004;64:3753–6. [DOI] [PubMed] [Google Scholar]
- [35].Flynn C, Zheng S, Yan L, et al. Connectivity map analysis of nonsense-mediated decay–positive BMPR2-related hereditary pulmonary arterial hypertension provides insights into disease penetrance. Am J Respir Cell Mol Biol 2012;47:20–7. [DOI] [PMC free article] [PubMed] [Google Scholar]
- [36].Murray PJ. The JAK-STAT signaling pathway: input and output integration. J Immunol 2007;178:2623–9. [DOI] [PubMed] [Google Scholar]
- [37].Thomas S, Snowden J, Zeidler M, et al. The role of JAK/STAT signalling in the pathogenesis, prognosis and treatment of solid tumours. Br J Cancer 2015;113:365–71. [DOI] [PMC free article] [PubMed] [Google Scholar]
- [38].Doi T, Ishikawa T, Okayama T, et al. The JAK/STAT pathway is involved in the upregulation of PD-L1 expression in pancreatic cancer cell lines. Oncol Rep 2017;37:1545–54. [DOI] [PubMed] [Google Scholar]
- [39].Thoennissen NH, Iwanski GB, Doan NB, et al. Cucurbitacin B induces apoptosis by inhibition of the JAK/STAT pathway and potentiates antiproliferative effects of gemcitabine on pancreatic cancer cells. Cancer Res 2009;69:5876–84. [DOI] [PubMed] [Google Scholar]
- [40].Becerra-Díaz M, Valderrama-Carvajal H, Terrazas LI. Signal transducers and activators of transcription (STAT) family members in helminth infections. Int J Biol Sci 2011;7:1371–81. [DOI] [PMC free article] [PubMed] [Google Scholar]
- [41].He W, Wu J, Shi J, et al. IL-22RA1/STAT3 signaling promotes stemness and tumorigenicity in pancreatic cancer. Cancer Res 2018;78:3293–305. [DOI] [PubMed] [Google Scholar]
- [42].Sun Y, Yang S, Sun N, et al. Differential expression of STAT1 and p21 proteins predicts pancreatic cancer progression and prognosis. Pancreas 2014;43:619–23. [DOI] [PubMed] [Google Scholar]
- [43].Huang YJ, Frazier ML, Zhang N, et al. Reverse-phase protein array analysis to identify biomarker proteins in human pancreatic cancer. Dig Dis Sci 2014;59:968–75. [DOI] [PMC free article] [PubMed] [Google Scholar]
- [44].Farrell AS, Joly MM, Allen-Petersen BL, et al. MYC regulates ductal-neuroendocrine lineage plasticity in pancreatic ductal adenocarcinoma associated with poor outcome and chemoresistance. Nat Commun 2017;8:1728. [DOI] [PMC free article] [PubMed] [Google Scholar]
- [45].Bertozzi D, Marinello J, Manzo SG, et al. The natural inhibitor of DNA topoisomerase I, camptothecin, modulates HIF-1α activity by changing miR expression patterns in human cancer cells. Mol Cancer Ther 2014;13:239–48. [DOI] [PubMed] [Google Scholar]
- [46].Zhang XX, Gan L, Gan Y. Effects of breast cancer resistance protein inhibitors and pharmaceutical excipients on decreasing gastrointestinal toxicity of camptothecin analogs. Acta Pharmacol Sin 2008;29:1391–8. [DOI] [PubMed] [Google Scholar]
- [47].Thakral NK, Ray AR, Bar-Shalom D, et al. Soluplus-solubilized citrated camptothecin—a potential drug delivery strategy in colon cancer. AAPS PharmSciTech 2012;13:59–66. [DOI] [PMC free article] [PubMed] [Google Scholar]
- [48].Ulivi P, Zoli W, Fabbri F, et al. Cellular basis of antiproliferative and antitumor activity of the novel camptothecin derivative, gimatecan, in bladder carcinoma models. Neoplasia 2005;7:152–61. [DOI] [PMC free article] [PubMed] [Google Scholar]


