

Abstract
Cancer immunotherapy based on genetically redirecting T-cells has been used successfully to treat B-cell malignancies1–3. In this strategy, the T-cell genome is modified by integration of viral vectors or transposons encoding chimeric antigen receptors (CARs) that direct tumor cell killing. However, this approach is often limited by the extent of expansion and persistence of CAR T-cells4,5. Here we report mechanistic insights from studies of a chronic lymphocytic leukemia (CLL) patient treated with CAR T-cells targeting the CD19 protein. Following CAR T-cell infusion, anti-tumor activity was evident in the peripheral blood, lymph nodes and bone marrow, and was accompanied by complete remission. Unexpectedly, at the peak of the response, 94% of CAR T-cells originated from a single clone in which lentiviral vector-mediated insertion of the CAR transgene disrupted the methylcytosine dioxygenase TET2 gene. Further analysis revealed a hypomorphic mutation in this patient’s second TET2 allele. TET2-disrupted CAR T-cells exhibited an epigenetic profile consistent with altered T-cell differentiation and, at the peak of expansion, displayed a central memory phenotype. Experimental knock-down of TET2 recapitulated the potency-enhancing effect of TET2 dysfunction in this patient’s CAR T-cells. These findings suggest that the progeny of a single CAR T-cell induced leukemia remission and that TET2 modification may be useful for improving immunotherapies.
Here we describe an unusual case of CAR T-cell therapy of CLL that helps clarify determinants of CAR-T cell efficacy and persistence. A seventy-eight-year-old man with advanced relapsed/refractory CLL (Patient-10) enrolled in a clinical trial for CD19 CAR T-cell (CTL019) therapy (NCT01029366). He underwent two adoptive transfers of autologous CTL019 cells, spaced apart by approximately two months. Following the first infusion, he became persistently febrile and was diagnosed with cytokine release syndrome (CRS). Signs of CRS rapidly resolved following administration of interleukin (IL)-6 receptor-blocking therapy. Patient-10 continued to show progressive leukemia six weeks after receiving his first dose of CAR T-cells (Fig. 1a-c).
Figure 1. Evaluation of clinical responses following adoptive transfer of CAR T-cells in a CLL patient.
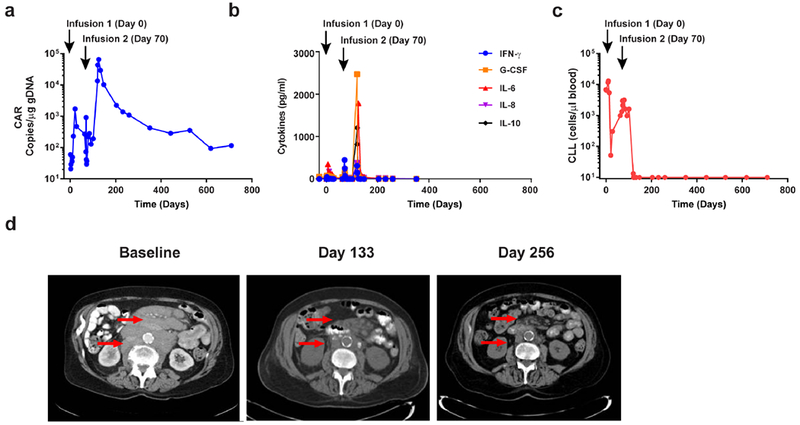
a, In vivo expansion and persistence of CAR T-cells. b, Longitudinal measurements of serum cytokines before and after CAR T-cell infusions. c, Total number of circulating B-CLL cells before and after CTL019 therapy. d, Sequential computed tomography imaging of chemotherapy-refractory lymphadenopathy. Red arrows indicate masses that were progressively reduced following the second CAR T-cell infusion.
Because there was a concern that early blockade of IL-6-mediated signaling may have diminished the response to CAR T-cell therapy, this patient was retreated with the remainder of his CAR T-cells 70-days after the first dose (Supplementary Table 1). Infusions were again complicated by CRS that resolved without anti-IL-6 receptor-blocking intervention. Evaluation of his bone marrow 1-month later revealed extensive infiltration of CLL (Extended Fig. 1) and computed tomography (CT) scans showed minimal improvement in extensive adenopathy. Unexpectedly, 2-months following the second infusion, the expansion of CAR T-cells peaked in the peripheral blood, followed by contraction (Fig. 1a). CTL019 cell outgrowth occurred in the CD8+ T-cell compartment, which is typical in responding CLL patients (Extended Fig. 2a). Delayed CAR T-cell expansion was accompanied by high-grade CRS and elevated circulating levels of interferon (IFN)-γ, granulocyte-colony stimulating factor (G-CSF), IL-6, IL-8 and IL-10 (Fig. 1b). Coincident with the onset of high fevers, rapid clearance of CLL was observed (Fig. 1c and d). Next-generation sequencing of rearrangement products at the immunoglobulin heavy chain (IGH) locus showed a 1-log reduction in tumour burden 51-days following the second infusion, with complete eradication of this clone from the blood 1-month later (Supplementary Table 2). CT scans showed dramatic improvement in mediastinal and axillary adenopathy (69% change; Fig. 1d). Patient-10 achieved a complete response with no evidence of CLL in his marrow (Extended Fig. 1; Supplementary Table 2) and resolution of all abnormal adenopathy 6-months later (Fig. 1d). His most recent long-term follow-up evaluation (>4.2 years) revealed the presence of CAR T-cells in the peripheral blood, ongoing B-cell aplasia (Extended Fig. 2b-e) and no evidence of circulating disease or marrow infiltration (Extended Fig. 1). Immune cell populations in the blood were normal in frequency, with no observed signs of lymphoproliferative abnormalities (Extended Fig. 2f and data not shown). The patient remains well in complete remission that has been sustained for more than 5-years at the time of this report.
Deep sequencing of the T-cell receptor beta repertoire indicated that pre-infused CD8+ CTL019 cells and the peripheral blood CD8+ T-cell compartment 1-month following infusion were polyclonal, with multiple distinct TCRVβ clonotypes similar between the samples (Extended Fig. 3a; Fig. 2a). Approximately 2-months after the second infusion, TCRVβ5.1 family usage exhibited a skewing of greater than 50%, with clonal dominance occurring in CD8+ CTL019 cells (Fig. 2a-b). Subsequent analysis revealed that 94% of the CD8+ CAR T-cell repertoire consisted of a single clone that was not detected at the time of transfer or at 1-month following the second infusion (Fig. 2c). The expansion of this clonal population of cells declined coincident with CAR T-cell decay kinetics (Fig. 2d). Thus, leukemia was eliminated in this patient primarily by the progeny of a single CAR T-cell that demonstrated massive in vivo expansion (approximately 29 population doublings in the peripheral blood).
Figure 2. Analysis of CAR T-cell clonal expansion in a CLL patient who had a delayed therapeutic response.
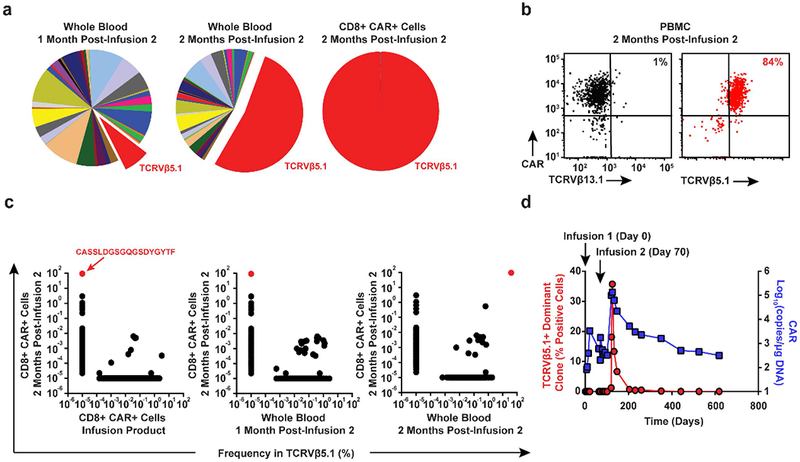
a, Frequency of TCRVβ gene segment usage in the blood of Patient-10 1-month (left pie chart) and 2-months (middle pie chart) following the second CAR T-cell infusion. TCRVβ clonotype frequencies in sorted CAR T-cells at the peak of expansion following are also shown (rightmost pie chart). b, Flow cytometric proportions of TCRVβ5.1 versus TCRVβ13.1 (negative control) positive CAR T-cells. c, Abundance of different TCRVβ5.1 clones in CAR+ T-cells at the peak of activity relative to other time points. Red dots indicate the dominant TCRVβ5.1 clone (representative of 2 independent experiments). d, Expansion kinetics of the TCRVβ5.1+ dominant clone following a second infusion of CAR T-cells plotted in parallel with CTL019 levels. Percentages of positive cells were calculated based on the results of a qPCR assay designed to amplify clonotype-specific sequences.
Longitudinal analysis of Patient-10 blood samples revealed a highly abundant cell clone with an integration site in intron 9 of TET2, which was expanded in CAR T-cells at the peak of clinical activity and not at earlier time points (Fig 3a). This large degree of clonal dominance has not been observed in more than 100 patients treated with CD19-directed T-cells. In CLL and ALL, the CAR T-cell accumulation in vivo results from the expansion of a diverse poly-clonal or pauci-clonal repertoire within the transduced T-cell population (6 and Extended Fig. 3). In Patient-10, cells bearing the TET2 integration event were present in the blood at a relative abundance of 14% at 4.2-years following infusion (Fig. 3a). The clonal population thus contracted, with no signs of insertional oncogenesis (Extended Fig. 3b-f). Because TET2 is a tumour suppressor gene, we are continuing to monitor this patient.
Figure 3. Investigation of CAR lentiviral integration sites and TET2 dysfunction in Patient-10.
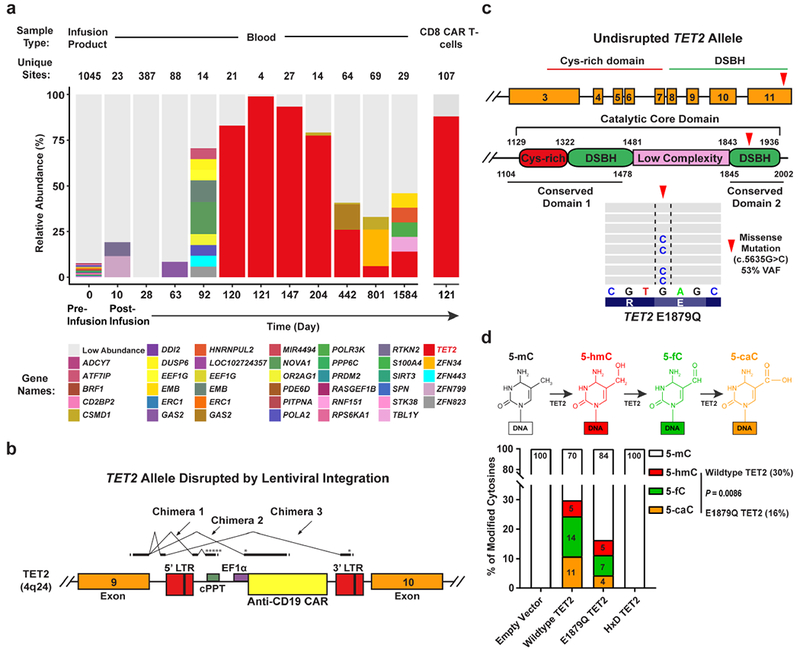
a, Longitudinal CAR T-cell clonal abundance as marked by integration sites. Different colors (horizontal bars) indicate major cell clones. A key to the sites, named for the nearest gene, is shown below the graph (abundances < 3% binned as “Low Abundance”). b, Diagram of the vector at the TET2 integration site locus illustrating splicing into the vector provirus to yield truncated transcripts. Asterisks denote ectopic stop codons. Splice junctions 3 chimeric messages (5 total junctions) are listed below the diagram. Splice donors and acceptors are underlined. LTR, long terminal repeat; cPPT, polypurine tract; EF1α, elongation factor 1 alpha promoter. c, Domain organization of TET2 and location of a residue mutated in Patient-10 CAR+ and CAR− T-cells. Cysteine (Cys)-rich and catalytic double-stranded beta-helix (DSBH) domains are also shown (red arrow denotes an amino acid change resulting from a missense mutation). Representative results of next generation sequencing appear beneath the structural diagrams. Each gray bar denotes a DNA fragment. A single-base G/C nucleotide substitution is highlighted by dashed lines above the consensus sequence. d, Diagram of the TET2-catalyzed sequential oxidations of 5-mC to 5-hmC and to 5-fC and 5-caC is shown (top). Genomic levels of 5-mC, 5-hmC, 5-fC, and 5-caC modifications produced by the E1879Q TET2 mutant shown as the percent of total cytosine modifications. Percentages derived from the mean of 3 independent experiments are shown. P-values were determined using a two-tailed, paired student’s t-test.
TET2 is a master regulator of blood cell formation. Haploinsuffciency or deletion of TET2 is found in normal clonal hematopoiesis7 as well as the initiation of lymphoma and leukemia, including naturally-arising and human T-lymphotropic virus type 1 (HTLV-1)-associated malignancies8–11. Although TET2 inactivation may contribute to increased self-renewal of hematopoietic stem and progenitor cells, its disruption alone infrequently leads to overt oncogenesis10,12. Analysis of polyadenylated TET2 RNA populations in clonal CAR T-cells at the peak of expansion in Patient-10 showed the appearance of new chimeric RNAs that spliced from TET2 exon 9 into the vector and terminated, truncating the encoded protein with premature stop codons (Fig. 3b and Extended Fig. 4a-b). While it is possible that expression of truncated fusion TET2 protein may have a dominant negative effect, it has been demonstrated that other TET2 mutant proteins do not exhibit such characteristics13.
We next sequenced CAR+ cells and CAR-T-cells from this subject and examined genes involved in hematologic malignancies (Extended Fig. 4c). In both samples, a missense variant in TET2 encoding amino acid 1879 was found in the catalytic domain, converting the wild-type residue, glutamic acid, to glutamine (Fig. 3c and data not shown). The C.5635C mutation was present in the allele of TET2 without the integrated CAR transgene, as that chromosome contained the wild-type reference sequence (c.5635G; Extended Fig. 4d). No other mutations in the panel of 67 additional genes analyzed were found.
TET2 encodes methylcytosine dioxygenase, an enzyme that catalyzes the conversion of 5-methylcytosine (5-mC) into 5-hydroxymethylcytosine (5-hmC) and the rarer bases 5-formylcytosine (5-fC) and 5-carboxylcytosine (5-caC), thereby mediating DNA demethylation14–19 (Fig. 3d, top panel). Methylation at the C5 position of cytosine normally represses transcription, and therefore, demethylation is expected to activate gene expression. We interrogated the functional significance of the E1879Q mutation using plasmids encoding wild-type TET2 or this TET2 variant that were transfected into HEK293T cells. Overexpression of wild-type or mutant TET2 proteins was verified by western blotting (Supplementary Fig. 1a-b, right panels). Analysis of genomic DNA isolated from these cells using both dot blotting (Supplementary Fig. 1a-b, left panels) and liquid chromatography-tandem mass spectrometry (Supplementary Fig. 2) revealed that E1879Q compromises the step-wise oxidation of 5-mC relative to wild-type TET2, with significant reductions in 5-fC and 5-caC occurring (Fig. 3d). Therefore, the clonal expansion of CAR T-cells in Patient-10 was comprised of a compound heterozygous loss-of-function in TET2 on one allele and a hypomorphic E1879Q variant on the other allele.
CAR+Vβ5.1+ T-cells from Patient-10 exhibited lower total levels of 5-hmC compared to their CAR-Vβ5.1- T-cell counterpart (Fig. 4a). This was presumably the result of TET2 disruption of the wild-type TET2 allele following lentiviral integration, as the TET2 E1879Q variant can form 5-hmC (Fig. 3d; Supplementary Fig. 1). To interrogate the effects of TET2 alteration on CAR T-cell fate and function, we performed ATAC-seq which monitors DNA accessibility (Supplementary Table 3). The global epigenetic changes between CAR+ and CAR− T cells from Patient-10 were modest (Extended Fig. 5a). However, we found that genes with more accessible chromatin in CAR+ compared to CAR-T-cells were enriched in pathways that regulate the cell cycle and T-cell receptor signaling (Extended Fig. 5b; Supplementary Tables 4–5a). ATAC-seq peaks that were reduced or lost in the setting of TET2 biallelic dysfunction included those corresponding to several regulators of T-cell effector differentiation/exhaustion such as IFNG, NOTCH2, CD28, ICOS and PRDM1 (Fig. 4b; Extended Fig. 5c; Supplementary Tables 4–5b). Furthermore, transcription factor motifs within sites that changed accessibility could have affected specific transcriptional circuits controlling CAR T-cell fate and anti-tumour activity in this patient (Extended Fig. 5d; Supplementary Tables 6a-b). Functional analysis of TET2 biallelically altered CAR+ T-cells cultured from this patient showed a diminished capacity to express IFNγ and CD107a (a surrogate marker for degranulation) when activated (Fig. 4c), consistent with a less-differentiated state. Thus, lentiviral integration into TET2 together with a hypomorphic mutation on the second allele reprogrammed the epigenetic landscape of CAR T-cells in a manner that was consistent with altered T-lymphocyte differentiation.
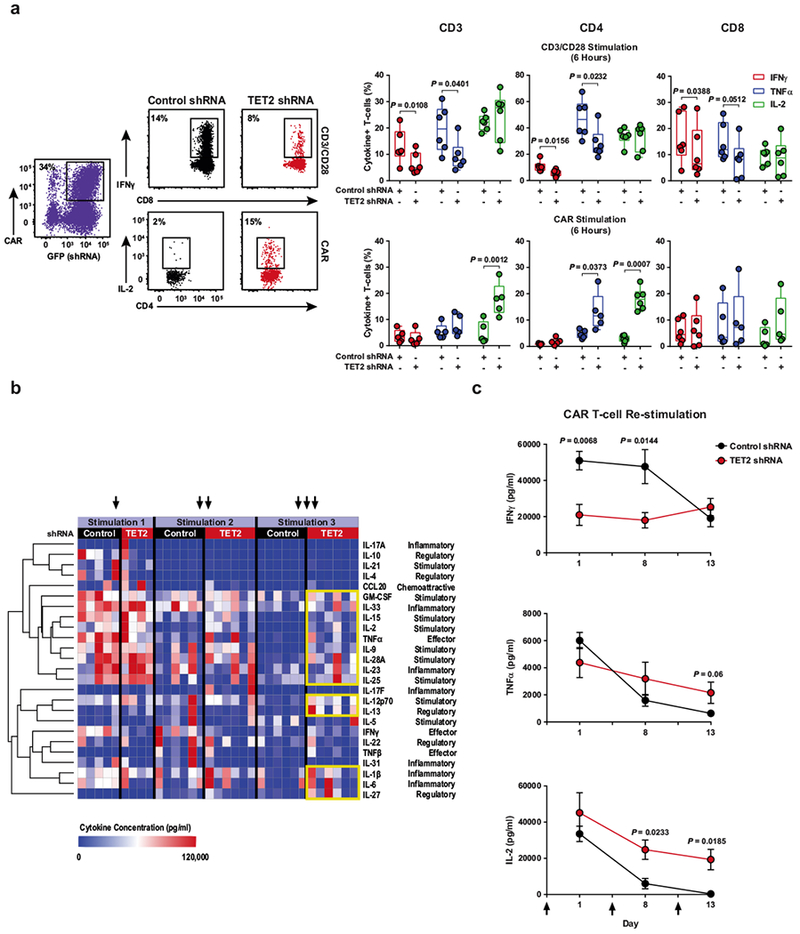
Figure 4. Effect of TET2 alteration on the epigenetic landscape of CAR T-cells.
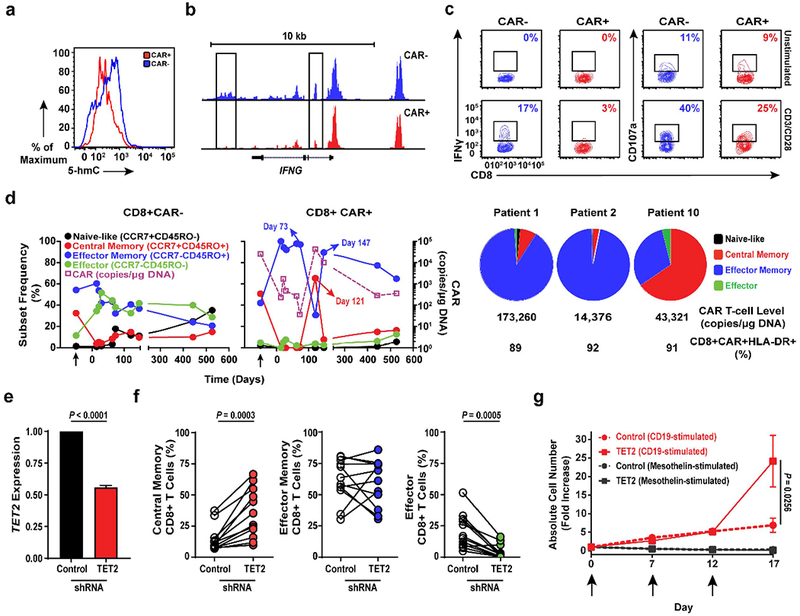
a, Total 5-hmC levels in CAR+ and CAR− T-cells cultured from Patient-10. Histograms depict the intensity of intracellular 5-hmC staining. b, Genome browser views of ATAC enrichment at the IFNG locus of Patient-10 T-cells. c, Frequencies of IFNγ and CD107a expressing T-cells expanded from Patient-10 unstimulated or stimulated with anti-CD3/CD28 antibodies. Insets indicate frequencies of gated cell populations. d, Longitudinal differentiation phenotypes of CAR+ (left) and CAR− (middle) T-cells from Patient-10. Arrows denote pre-infusion CAR T-cells. Differentiation phenotype at the peak of in vivo activity is shown in two long-term complete responding CLL patients (Patients-1 and -2) compared to Patient-10 (right). Pie slices represent T-cell subset frequencies. The CTL019 cell level and frequencies of activated CAR T-cells expressing HLA-DR at the peak of each patient’s response are listed below the pie charts. e, TET2 expression in healthy donor CD8+ T-cells transduced with a scrambled shRNA (control) or TET2 sequences. Error bars depict s.e.m. f, Frequencies of central memory (left), effector memory (middle) and effector CD8+ T cells following shRNA-mediated knock-down of TET2 (n = 12; pooled results from 4 independent experiments). g, Proliferation of healthy donor CTL019 cells (n = 8; 3 independent experiments) in response to repetitive stimulation (arrows) with K562 cells expressing CD19 or mesothelin (negative control). CAR T-cells were transduced to express either a scrambled control or TET2-specific shRNA. P values were determined using a two-tailed, paired student’s t-test. All error bars depict the s.e.m.
We next analyzed the differentiation state of ex vivo CTL019 cells from Patient-10 and compared it to CAR T-cells from six other patients who responded to this therapy (Extended Fig. 6), including two subjects with CLL (Patients-1 and -2) who had long-term durable remissions (>6 years) and did not have TET2 integrations (data not shown). At the peak of in vivo expansion and activation marker expression, 65% of the CAR T-cells in Patient-10 were of a central memory phenotype (Fig. 4d; Extended Fig. 6a) which differed from other responders whose repertoires were dominated by CD8+ effector memory and effector CTL019 cells at the height of the response (Fig. 4d; Extended Fig. 6b). Experimental knock-down of TET2 (Fig. 4e) recapitulated the effect of its dysfunction in Patient-10 on the differentiation state of both total and CAR+ CD8+ as well as CD4+ primary T-cells (Fig. 4f; Extended Fig. 7a-b), implicating TET2 as an epigenetic modulator of human T-lymphocyte fate. TET2-mediated regulation of CD8+ T-cell differentiation may not occur at the transcriptional level, as we did not observe differential TET2 mRNA expression between naive and memory subsets (Extended Fig. 7c).
To investigate effects of TET2 inhibition on CAR T-cell function, we performed an in vitro serial re-stimulation assay. Repeated stimulation with CD19-expressing tumour cells allowed TET2 knock-down CAR T-cells to continue to expand in an antigen-dependent manner, whereas re-stimulation of CAR T-cells with unaltered TET2 resulted in culture growth arrest (Fig. 4g) without affecting their viability (Extended Fig. 7d). We next examined cytokine production following acute (Extended Fig. 8a) and chronic (Extended Fig. 8b-c) antigen stimulation. Consistent with our analysis of CD8+ CAR+ T-cells in Patient-10, IFNγ production following CD3/CD28 activation was diminished in CD8+ as well as CD4+ T-cells with reduced TET2 levels (Extended Fig. 8a). A similar decrease was observed for TNFα generation (Extended Fig. 8a). In contrast, acute production of both TNFα and IL-2 by CD4+ T-cells was increased upon CAR-specific stimulation (Extended Fig. 8a). While repeated exposure of bulk CTL019 cells to CD19-expressing tumours also led to decreased IFNγ elaboration (Extended Fig. 8b-c), TET2 inhibition resulted in the sustained production of various other cytokines following multiple rounds of stimulation (Extended Fig. 8b). Thus, TET2 may control human T-cell subset-specific cytokine production in an antigen-receptor and/or co-stimulatory signal-dependent fashion.
Based on our evaluation of CAR+ T-cells expanded from Patient-10, we predicted that knock-down of TET2 would decrease effector molecule expression. Unexpectedly, CAR-specific, but not CD3/CD28 stimulation increased the expression of CD107a (Extended Fig. 9a). This may be attributed, at least in part, to enhanced cytolytic capacity mediated by 4-1BB over CD28 co-stimulation due to NKG2D up-regulation20. Because CD8+ T-cell differentiation is accompanied by decreased methylation and upregulated gene expression at effector gene loci, including GZMB (encoding granzyme B) and IFNG21, we subsequently explored whether TET2 inhibition influences critical components of the cytotoxic machinery. In contrast to IFNγ, TET2 reduction in CD8+ CAR+ T-cells increased granzyme B and perforin expression levels (Extended Fig. 9b). These changes were associated with the heightened cytotoxic activity of TET2 knock-down CAR T-cells (Extended Fig. 9c).
The above findings suggest that TET2 dysfunction may produce potent CAR T-cells with properties of short-lived memory cells that can expand and elicit effector responses, as well as long-lived memory cells that durably persist. We thus examined additional effector/memory markers in CD8+ CAR+ and CAR− T-cells using post-infusion samples from Patient-10 and other long-term responding CLL patients. At the height of the response, tumour-reactive CAR+ T-cells from Patient-10 possessed higher levels of granzyme B (Extended Fig. 10a) and Eomesodermin (Eomes; a transcription factor involved in the formation and maintenance of the CD8+ memory T-cell pool; Extended Fig. 10b) compared to matched CAR-T-cells, which was distinct from other complete responders. All clinically active CD8+ CAR+ T-cells in these expressed CD27, a co-stimulatory receptor involved in the generation of T-cell memory (Extended Fig. 10b). The frequency of CTL019 cells expressing KLRG1, a marker of T-lymphocyte senescence that is known to be regulated by DNA methylation21, was significantly lower on Patient-10 CAR+ T-cells compared to those of other subjects (Extended Fig. 10b). A high frequency of Ki-67 positive CAR+ T-cells was observed at the peak of in vivo expansion in Patient-10 (Extended Fig. 10a), further suggesting that TET2 is required for CAR-specific CD8+ T-cell proliferation. These observations collectively support the idea that TET2 dysfunction promotes the development of human memory CAR T-cells capable of eliciting effective anti-tumour responses. The remission observed in Patient-10 was likely due to the significant increase in the number of CTL019 cells with TET2 dysfunction, despite the diminishment of certain effector functions.
In summary, profound clonal expansion of a single CAR-transduced T-cell with biallelic TET2 dysfunction transformed a non-curative response into a deep molecular remission in a seventy-eight-year-old CLL patient. Characterization of this T-lymphocyte population revealed that changes to the epigenetic environment altered the differentiation state as well as proliferative capacity and translated into a considerable therapeutic effect. Although our initial studies were based on an extensive analysis of one subject, recapitulation of the effect of TET2 dysfunction on CAR T-cell fate and anti-tumour activity in relevant culture systems involving primary human T-lymphocytes supports the discovery of a modifiable epigenetic pathway that can shape the immune response. Thus, targeting the epigenome may improve the efficacy and persistence of CAR T-cells. Finally, our results indicate that the progeny of a single CAR T-cell are sufficient to mediate potent anti-tumor effects in advanced leukemia, a finding that has substantial clinical implications regarding the delivery of bespoke cellular therapies.
Methods
Patient samples.
Patients were enrolled in institutional review board (IRB)-approved clinical protocol: “Genetically Engineered Lymphocyte Therapy in Treating Patients With B-Cell Leukemia or Lymphoma That is Resistant or Refractory to Chemotherapy” (ClinicalTrials.gov number: NCT01029366) which was designed to evaluate the safety and efficacy of the adoptive transfer of autologous T-cells expressing CD19 chimeric antigen receptors (CAR19) that incorporate TCR zeta and 4-1BB costimulatory domains (CTL019). Participants provided written informed consent in accordance with the Declaration of Helsinki and the International Conference on Harmonization Guidelines for Good Clinical Practice. All regulations were followed according to this United States (US) Food and Drug Administration (FDA)-approved clinical protocol. The current study is a secondary investigation using patient samples collected from existing clinical trials. Therefore, the sample sizes in this report were determined by the original clinical trial designs and sample availability; no additional inclusion/exclusion criteria were applied.
Cell Lines.
NALM-6, K562 and HEK293T cell lines were originally obtained from the American Type Culture Collection (ATCC). OSU-CLL cells22 were obtained from Ohio State University. Cells were expanded in RPMI media containing 10% fetal bovine serum (FBS), penicillin, and streptomycin at a low passage and tested for mycoplasma using the MycoAlert detection kit as per the manufacturer’s (Lonza) instructions. Authentication of cell lines was performed by the University of Arizona (USA) Genetics Core based on criteria established by the International Cell Line Authentication Committee. Short tandem repeat (STR) profiling revealed that these cell lines were well above the 80% match threshold. NALM-6 and OSU-CLL cells were engineered to constitutively express click beetle green (CBG) luciferase/enhanced GFP (eGFP). K562 cells were transduced with a lentiviral vector encoding human CD19 (K562-CD19), and negative control cells were K562 cells expressing mesothelin (K562-mesothelin)23. Following transgene introduction, cells were sorted on a FACSAria (BD) to obtain a >99% pure population. Mycoplasma and authentication testing are routinely performed before and after molecular engineering.
CAR T-cell manufacturing and correlative studies.
Peripheral blood T-cells for CTL019 cell manufacturing were obtained by leukapheresis as previously described1,4. The processing, flow cytometric evaluation, quantification of cytokines and quantitative PCR analyses (i.e., detection of CAR19 and the TCRvβ5.1+ dominant clone) on pre- and post-CTL019 infusion samples were conducted as previously reported24. Next generation sequencing of immunoglobulin heavy chain (IGH) rearrangements was carried out on DNA isolated from blood and marrow samples. Briefly, primers specific for the variable and joining gene segments of the third complementarity-determining region of the IGH were used for amplification and deep sequencing to identify the leukemic clone relative to baseline samples (Adaptive Biotechnologies). The frequency of the leukemic clone in each sample was calculated using the number of total and unique productive reads.
Population doublings of clonal CAR T-cells in the blood (assuming a 5-liter volume of peripheral blood) were calculated using the equation At = A02n, where n is the number of population doublings, A0 is the input number of cells (assuming a single TET2-disrupted cell), and At is the number of CAR T-cells at day 121 (peak CAR T-cell expansion; 95.445 CD3+ CD8+ CAR+ cells/μl whole blood).
These correlative assays were carried out at time points defined by the clinical protocol in parallel with disease response evaluations. This clinical trial was a single-treatment study; comparisons between patients in the current study were defined by the observed clinical responses. Investigators were blinded to clinical responses as correlative assays were conducted using de-identified subject samples.
Flow cytometry.
Routine assessments of CAR T-cell expansion and persistence as well as B-CLL burden in the blood and marrow were conducted according to our previously published methods using a six-parameter Accuri C6 flow cytometer (BD)1,4. T-cell immunophenotyping was performed by surface staining with flow cytometry antibodies immediately following pre-incubation with Aqua Blue dead cell exclusion dye (Invitrogen). The Alexa Fluor 647–conjugated monoclonal antibody that was used to detect the CAR molecule has been described25. Commercially available flow cytometry antibodies against the following antigens used in the study are as follows: CD3 allophycocyanin (APC) H7, CCR7 PE/CF594, CD107a APC, (BD Biosciences); CD45RO brilliant violet (BV)570, CD8 BV650, CD4 BV785, Perforin BV421, Ki-67 Alexa Fluor (AF)700, TNFα BV605 (Biolegend); TCRVβ5.1 APC, IFNγ PE, IL-2 PerCP-eFluor 710, Eomes FITC (eBioscience); Granzyme B PE/Cyanine5.5 (Invitrogen). For intracellular staining, cells were fixed and permeabilized using the Foxp3 Fixation/Permeabilization Kit (eBioscience) or the Cytofix/Cytoperm Kit (BD Biosciences). The Golgi Stop protein transport inhibitor containing monensin and GolgiPlug protein transport inhibitor containing brefeldin A (BD Biosciences) were used when staining for intracellular cytokine production. All flow cytometry reagents were titrated prior to use. Samples were acquired on an LSRFortessa (BD) and data were analyzed using FlowJo software (TreeStar).
TCRVβ deep sequencing.
Genomic DNA from pre-infusion T cells, peripheral blood samples or sorted post-infusion T-cells was isolated using the DNeasy Blood and Tissue Kit (Qiagen). TCRVβ deep sequencing was carried out by immunoSEQ (Adaptive Biotechnologies). Only productive TCR rearrangements were used in the assessment of TCR clonotype frequencies.
Integration site analysis.
Vector integration sites were detected from genomic DNA as described previously26–29. Genomic sequences were aligned to the human genome by BLAT (hg38, version 35, >95% identity) and statistical methods for analyzing integration site distributions were carried out as previously described30. The SonicAbundance method was used to infer the abundance of cell clones from integration site data28. All samples were analyzed independently in quadruplicate to suppress founder effects in the PCR and stochastics of sampling.
Detection of TET2 chimeric transcripts.
RNA was isolated from cells and used as template with the One-Step RT-PCR Kit (Qiagen). Primers were designed to target the exon 9 and 10 boundaries of TET2, flanking the vector integration site and sequences internal to the anti-CD19BBζ CAR lentiviral vector. These included various regions of the vector sequence (Extended Fig. 6a). Reactions were carried out as per the manufacturer’s specifications. Thermocycling temperatures and time for reverse transcription as well as PCR activation were conducted using the following cycling conditions: 30 seconds at 94°C for melting, 30 seconds at 57°C for primer annealing and 1.5 minutes at 72°C for primer extension (35 cycles). A final extension at 72°C was held for 10 minutes for each sample. PCR products were visualized on ethidium bromide agarose gels (1.5% by weight) via electrophoresis and ultraviolet imaging.
Next-generation sequencing of post-infusion CAR T-cell samples.
CAR+ and CAR− CD8+ T-cells were purified from post-infusion PBMC samples corresponding to the peak of in vivo expansion in Patient-10. T-cells were sorted using a FACSAria (BD) and genomic DNA was isolated from these lymphocytes as described above. A custom targeted next generation sequencing panel of 68 genes associated with hematologic malignancies was then utilized (TruSeq Custom Amplicon, Illumina Inc.) and sequenced on the Illumina MiSeq (Illumina, Inc.). A minimal mean depth of 2110 reads was achieved for the specimens sequenced, with the assay and bioinformatics performed as previously described31. The data presented is based on the human reference sequence UCSC build hg 19 (NCBI build 37.1).
Determining the TET2 allele hosting vector integration.
A PCR assay was developed to amplify the region of DNA (approximately 4 kb) between the vector integration and the locus of the c.5635G>C mutation. Primers were designed to anneal to the vector sequence (MKL-3: 5’-CTTAAGCCTCAATAAAGCTTGCCTTGAG-3’) and multiple locations downstream of the mutation, chr4:105,276,145 (50 bp: 5’ GCTGGTAAAAGACGAGGGAGATCCTG-3’, 99 bp: 5’-GGCTTCCCAAAGAGCCAAGCC ATG-3’, 120 bp:5’-CACGGGCTTTTTCAGCCATTTTGGC-3’). Genomic DNA samples from sorted CAR+ and CAR− CD8+ T-cells corresponding to the peak of clonal expansion in Patient-10 were selected for amplification. PCR reactions were carried out with Long Amp Taq polymerase (New England BioLabs) and 100 – 400 ng of DNA isolated from samples, according to the manufacturer’s recommendations. Amplification was conducted as follows: 94°C for 30 seconds, 30 cycles of (94°C for 30 seconds, 60°C for 30 seconds, and 65°C for 3 minutes 20 seconds), and a final extension of 65°C for 10 minutes. Amplified products were separated by electrophoresis on a 1% ethidium bromide agarose gel and prominent bands of 4 kb in size were isolated using the QIAquick Gel Extraction Kit (Qiagen). Isolated bands were ligated into pCR2.1 and cloned into TOP-10 chemically competent cells using the TOPO TA Cloning Kit (Invitrogen). Purified plasmids were sequenced using Ml3 forward and reverse primers using standard Sanger technology. Sequencing results were aligned to the vector sequence and reference genome.
Characterization of the TET2 E1879Q mutation.
The previously characterized and crystalized human TET2-CS variant (1129-1936 Δ1481-1843) with an N-terminal FLAG-tag was expressed using a pLEXm expression vector32,33. The E1879Q mutation or mutation of the catalytic H1382Y and D1384A (HxD mutant) were generated by standard means. HEK293T cells were cultured in DMEM with GlutaMAX (ThermoFisher Scientific) and 10% FBS (Sigma). Cells were transfected with wild-type (WT), mutant hTET2-CS or an empty pLEXm vector control using Lipofectamine 2000 (ThermoFisher Scientific) according to the manufacturer’s protocol. Media was changed 24-hours after transfection, and cells were harvested by trypsinization 48-hours after transfection and resuspended in phosphate-buffered saline. Genomic DNA was isolated from four-fifths of the cells using the DNeasy Blood and Tissue Kit (Qiagen) and the remaining one-fifth of the cells were lysed using the CytoBuster Protein Extraction Reagent (EMD Millipore) for western blot analysis.
DNA blots for cytosine modifications were carried out according to established protocols34. Purified DNA from HEK293T cells was diluted to 15 ng/μL in Tris-EDTA (TE) buffer, pH 8.0 for two-fold dilutions of each sample. One-fourth volume of 2 M NaOH-50 mM EDTA was added to each sample. The DNA was denatured for 10 minutes at 95°C and transferred quickly to ice, followed by the addition of 1:1 ice cold 2 M ammonium acetate. Polyvinylidene Difluoride (PVDF) membranes were cut to size, wet with MeOH and equilibrated in TE buffer and then assembled into the PR 648 Slot Blot Manifold (GE Healthcare Life Sciences). Each well was washed with 400 μL TE drawn through with gentle vacuum, and 600 ng of genomic DNA was loaded, followed by another TE wash. Membranes were blocked for 2-hours in 5% milk–TBST, washed thrice with TBST, and blotted at 4°C overnight with primary antibodies against each modified cytosine — 1:5,000 mouse anti-5-mC (Abcam); 1:10,000 rabbit anti-5-hmC (Active Motif); 1:5,000 rabbit anti-5-fC (Active Motif); 1:10,000 rabbit anti-5-caC (Active Motif). Blots were then washed, incubated with a 1:2,000 dilution of a secondary horse anti-mouse- horseradish peroxidase (HRP; Cell Signaling Technology) or 1:5,000 goat anti-rabbit-HRP (Santa Cruz Biotechnology) for 2-hours, washed and imaged using the Immobilon Western Chemiluminescent HRP Substrate (Millipore) and the Amersham Imager 600 (GE Healthcare Life Sciences).
For protein detection, clarified cell lysates were run on 8% sodium dodecyl sulfate polyacrylamide (SDS–PAGE) gels. Gels were transferred together onto a PVDF membrane using the iBlot 2 Gel Transfer Device (ThermoFisher Scientific). Membranes were blocked for 2-hours at room temperature with 5% (w/v) milk in Tris-buffered saline with 0.1% (v/v) Tween-20 (TBST), washed ×3 with TBST and blotted either with primary 1:10,000 anti-FLAG M2 (Sigma) or 1:1,000 anti-Hsp90α/β (Santa Cruz Biotechnology) antibodies at 4°C overnight. Following incubation, membranes were washed and blotted with a 1:5,000 dilution of a secondary goat anti-mouse-HRP (Santa Cruz Biotechnology) for 2-hours, washed and imaged with Immobilon Western Chemiluminescent HRP Substrate (Millipore) on an Amersham Imager 600 (GE Healthcare Life Sciences).
For liquid chromatography tandem-mass spectrometry (LC-MS/MS), 1-2 μg of genomic DNA from each sample was degraded to component nucleosides with 1 U DNA Degradase Plus (Zymo Research Corporation) at 37°C overnight. The nucleoside mixture was diluted ten-fold into 0.1% formic acid, and injected onto an Agilent 1200 Series HPLC with a 5 μm, 2.1 × 250 mm Supelcosil LC-18-S analytical column (Sigma) equilibrated to 45°C in Buffer A (5 mM ammonium formate, pH 4.0). The nucleosides were separated in a gradient of 0–15% Buffer B (4 mM ammonium formate, pH 4.0, 20% (v/v) methanol) over 8 minutes at a flow rate of 0.5 mL/minute. Tandem MS/MS was performed by positive ion mode ESI on a 6460 triple-quadrupole mass spectrometer (Agilent) with a gas temperature of 250°C, a gas flow of 12 L/minute, a nebulizer pressure of 35 psi, a sheath gas temperature of 300°C, a sheath gas flow of 11 L/minute, a capillary voltage of 3,500 V, a fragmentor voltage of 70 V and a delta EMV of +1,000 V. Collision energies were optimized to 10 V for 5-mC and 5-fC; 15 V for 5-caC; and 25 V for 5-hmC. Multiple reaction monitoring (MRM) mass transitions were 5-mC 242.11→126.066 m/z; 5-hmC 258.11→124.051; 5-fC 256.09→140.046; 5-caC 272.09→156.041; and T 243.10→127.050. Standard curves were generated using standard nucleosides (Berry & Associates, Inc.) ranging from 2.5 μM to 610 pM (12.5 pmol to 3 fmol total). Digested oligonucleotides containing equimolar amounts of each modified cytosine were used as quality control samples. The sample peak areas were fit to the standard curve, as adjusted by the quality control samples to determine the amount of each modified cytosine in the genomic DNA sample. Amounts are expressed as the percentage of total cytosine modifications.
Measurement of total 5-hydroxymethylcytosine levels.
CD8+ T-cells were purified from post-infusion PBMC samples using the EasySep Human CD8+ T-cell Immunomagnetic Negative Selection Kit (StemCell Technologies) and expanded ex vivo using a previously reported rapid expansion protocol35. Following culture, CD8+ CAR+ TCRVβ5.1+ and CD8+ CAR-TCRVβ5.1-T-cells were sorted on a FACSAria (BD). Cells were permeabilized and treated with 300 μg/ml DNase I for 60 minutes at 37°C. After washing, samples were incubated with an anti-5-hmC monoclonal antibody or an isotype control for 30 minutes, followed by staining with an Alexa Fluor 647-conjugated secondary antibody, as previously described36. Cells were immediately acquired on an LSRFortessa (BD).
Global chromatin profiling by ATAC-seq.
Following culture, CD8+ CAR+ TCRVβ5.1+ and CD8+ CAR− TCRVβ5.1-T-cells were sorted on a FACSAria (BD). ATAC-seq was carried out as previously described37,38. Two replicates were performed for each ex vivo expanded CD8+ CAR+ TCRVβ5.1+ and CD8+ CAR− TCRVβ5.1- T-cell culture. Briefly, nuclei were isolated from 200,000 sorted CD8+ T-cells for each replicate, followed by the transposition reaction in the presence of Tn5 transposase (Illumina, Inc.) for 45 minutes at 37°C. Purification of transposed DNA was subsequently completed with the MinElute Kit (Qiagen) and fragments were barcoded with dual indexes (Illumina Nextra). Paired-end sequencing (2 × 75 bp reads) was carried out using the Illumina NextSeq 500. Raw sequencing data were processed and aligned to the GRC37h/hg19 reference genome using Bowtie2 and regions of significant enrichment were identified using MACS v1.4.2. Merged peak lists were created using BedTools. ATAC sequencing tag enrichment and DNA motif analysis across the merged peak list were carried out using HOMER (homer.salk.edu). Gene Ontology (GO)/Pathway analysis was performed with Metascape (http://metascape.org). Only high-confidence peaks were used for gene ontology and DNA motif analyses. For these evaluations, peaks with an enrichment score less than 5 were filtered out as previously established39.
CAR T-cell differentiation and expansion potency assays.
Bulk primary human T-cells were activated with paramagnetic polystyrene beads coated with anti-CD3 and anti-CD28 monoclonal antibodies as previously described40 and transduced with lentiviral vectors encoding the CD19BBζ CAR and shRNA hairpin sequences targeting TET2 or a scrambled control with GFP co-expression (Cellecta). Knock-down efficiency in CTL019 cells following shRNA transduction was determined by real-time quantitative PCR with Taqman gene expression assays (Applied Biosystems) for TET2 (assay Hs00325999_ml) and GAPDH (assay (Hs03929097_gl) which served as a loading and normalization control. Following 14-days of culture, the differentiation phenotype of these cells was determined by flow cytometry. GFP+ CAR+ T-cells were sorted on a FACSAria (BD) and combined 1:1 with irradiated K562 cells engineered to express CD194 or mesothelin as a negative control. CTL019 cells were serially re-stimulated with irradiated K562 targets for a total of 3 times, with absolute counts and viability assessments taken at regular intervals over 17-days. Cell counts and viability measurements were obtained using the LUNA Automated Cell Counter (Logos Biosystems). Supernatants were collected 24-hours after each stimulation for longitudinal measurements of cytokine levels in cultures, as previously described41.
Intracellular cytokine, perforin and granzyme B analysis.
CD8+ T-cells from Patient-10 were stimulated 3:1 with paramagnetic polystyrene beads coated with anti-CD3 and anti-CD28 monoclonal antibodies for 6-hours in the presence of CD107a monoclonal antibody and the golgi inhibitors brefeldin A and monensin. Cells were washed, stained with live/dead viability dye, followed by surface staining for CD3, CD8 and TCRVβ5.1+. These lymphocytes were subsequently fixed/permeabilized and intracellularly stained for IFNγ, CAR T-cells generated from healthy donors (TET2 knock-down or control) were stimulated in the same way with CD3/CD28 beads or beads coated with an anti-idiotypic antibody against CAR19. Cells were then stained for surface antigens (CD3, CD4, CD8 and CAR19). After fixation and permeabilization, intracellular staining for IFNγ, TNFα and IL-2 was performed.
For perforin and granzyme B analysis, CTL019 cells that had been transduced with a TET2 or scrambled control shRNA were expanded for 14-days and cryopreserved. These CAR T-cells were then thawed and rested for 4-hours, followed by live/dead and surface staining for CD3, CD8 as well as CAR19. Intracellular staining for perforin and granzyme was carried out following fixation and permeabilization. Cells were analyzed on an LSRFortessa (BD).
Cytotoxicity assay.
Healthy donor CTL019 cells transduced with a shRNA directed against TET2 or a scrambled control were co-cultured with CBG luciferase-expressing NALM-6 and OSU-CLL cell lines at the indicated ratios for 16-hours41. Cell extracts were created using the Bright-Glo Luciferase Assay System (Promega Corporation) and substrate was added according to the manufacturer’s instructions. Luciferase measurements were taken on a SpectraMax luminescence microplate reader (Molecular Devices), and specific lysis was calculated as previously described41.
Analysis of TET2 gene expression levels in T-cell subsets.
TET2 expression levels were determined by analyzing a published gene expression dataset (https://www.ncbi.nlm.nih,gov/geo/query/acc.cgi?acc=GSE23321) for CD8+ T-cell subsets (Naïve, TN; Stem Cell Memory, TSCM; Central Memory, TCM; and Effector Memory, TEM) isolated from 3 different healthy human subjects42. Genechip (Affymetrix) data were processed with the Bioconductor Oligo software package43 (release 3.6, Bioconductor) using the RMA method44.
Statistical analyses.
Normality was assessed for all data using the D’Agostino-Pearson omnibus test. For integration site data analysis, genomic feature data comparisons were carried out as previously described using X2, Fisher’s exact tests, or a combination of Bayesian model averaging, conditional logit and regression27,45,46. Assessments of T-cell differentiation and function in shRNA-mediated TET2 knock-down experiments were performed using a paired student’s t-test. Estimates of variation within each group of data are presented as error bars in figures. Analyses were performed with SAS (SAS Institute Inc.), Stata 13.0 (StataCorp) or GraphPad Prism 6 (GraphPad Software, Inc.). Cytokine heat maps were constructed using Morpheus software (Broad Institute; accessed at https://software.broadinstitute.org/morpheus/). All tests were two-sided. Exact P values are reported. A P value < .05 was considered statistically significant.
Availability of Data.
Sequencing data are available at the NCBI Sequence Read Archive (accession number SRP136348; analyses of lentiviral integration sites, TET2 chimeric transcripts and alleles as well as mutations associated with hematologic malignancies), Adaptive Biotechnologies’ immuneACCESS® database (https://doi.org/10.21417/B72D1Q; TCR V-Beta and BCR IgH immunosequencing) and Gene Expression Omnibus (accession number GSE112494; ATAC-seq). Any other data that support the findings of the study can be made available upon reasonable request.
Extended Data
Extended Data Fig. 1 |. Timeline of disease clearance by CAR T cells in Patient-10.
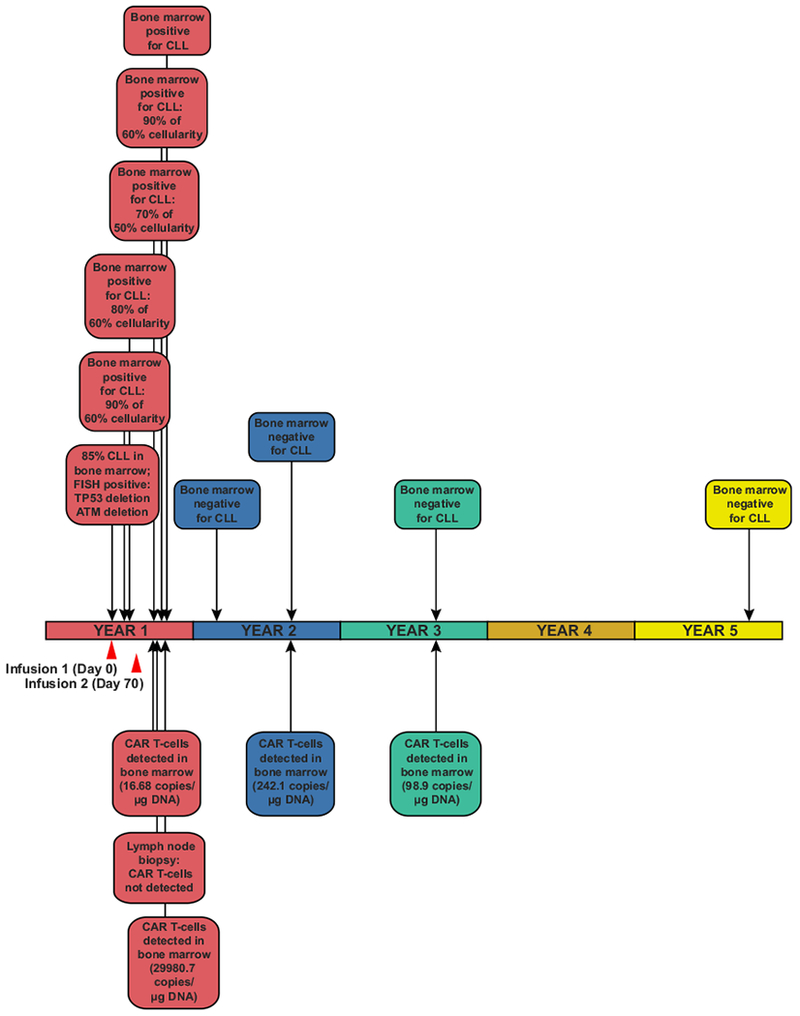
An outline of clinical findings in Patient-10, including the results of bone marrow assessments, tumour cytogenetics and CAR T cell persistence. CTL019 cell infusion time points are indicated by red arrows.
Extended Data Fig. 2 |. CAR T cell detection and profiling of immune cell populations in Patient-10 and other responders.
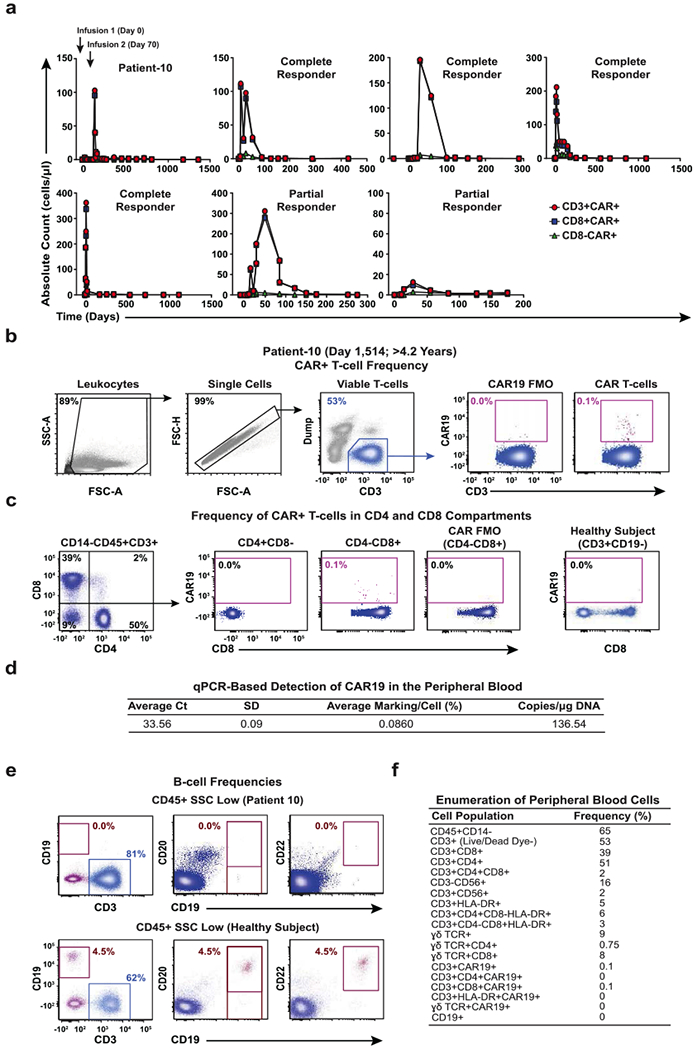
a, Pre- and post-infusion kinetics of CAR T cell expansion (CD3+, CD8+ and CD8−) are shown in Patient-10 compared to other responders. The number of circulating CTL019 cells was calculated based on frequencies of CD3+, CD8+ and CD8− CAR T cell populations and absolute cell counts. b, Flow cytometry gating strategy to identify peripheral blood CAR T cells in Patient-10. c, Relative percentages of CTL019 cells in the CD4 and CD8 compartments of this patient. T cells from a healthy subject served as a negative control. d, The persistence of CAR T cells in the peripheral blood of Patient-10 was determined by qPCR. The average threshold cycle (Ct) value obtained from three replicates and a standard deviation (SD) is listed. Calculations of CAR T cell abundance are reported as average marking per cell as well as transgene copies per microgram of genomic DNA. e, Frequencies of circulating B cells in Patient-10 compared to a healthy subject. Pre-gating was performed to exclude dead cells as well as doublets, and all gating thresholds were based on fluorescence minus one (FMO) controls (representative of two independent experiments). f, Enumeration of various immune cell populations in the blood of Patient-10. The frequency of each population is listed in a separate column that corresponds to its phenotypic marker.
Extended Data Fig. 3 |. Clonal composition of CAR T cells from Patient-10 and other subjects treated with CTL019.
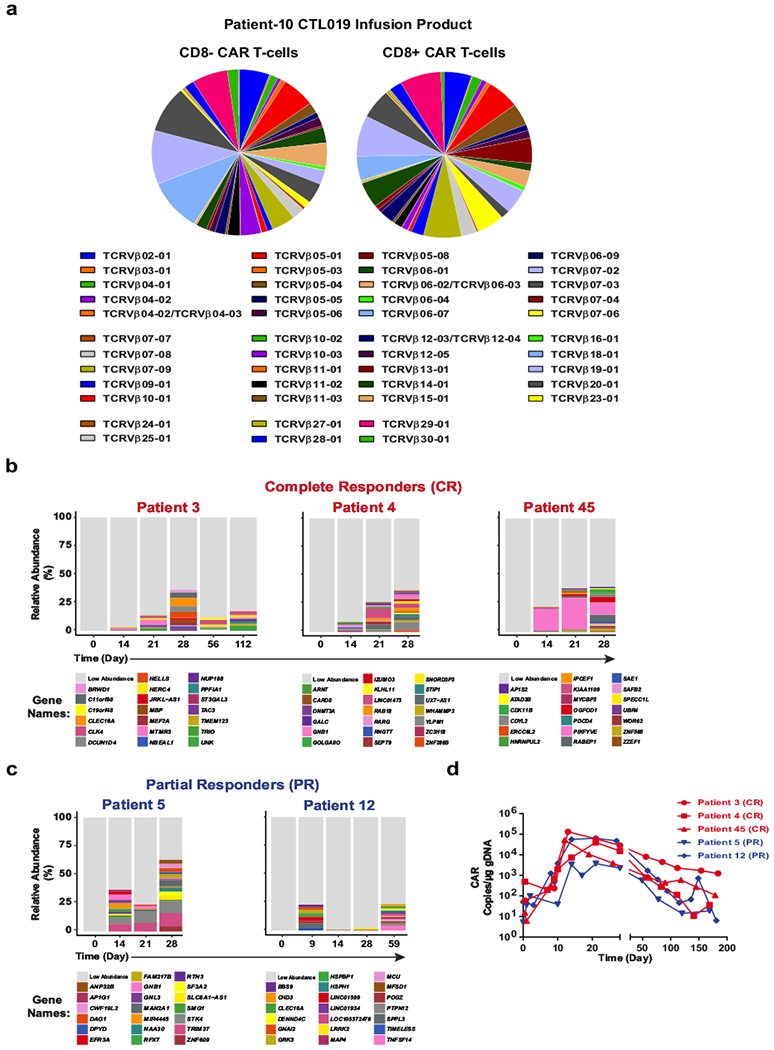
a, TCRVβ distribution in CD8− (left) and CD8+ (right) CAR T cells in the cellular infusion product of Patient-10. b, Relative frequencies of CAR T cell clones in three patients who had complete responses to CTL019 therapy, summarized as stacked bar graphs. Each colour (horizontal bar) denotes a major cell clone, as marked by lentiviral integration sites. c, Integration site analysis in CAR T cells from two partially responding patients. d, In vivo expansion of CAR T cells in the above patients as determined by quantifying the average CAR transgene copies per microgram DNA at each time point.
Extended Data Fig. 4 |. Detection of TET2 chimaeric transcripts in Patient-10 CAR T cells and DNA sequencing for mutation detection.
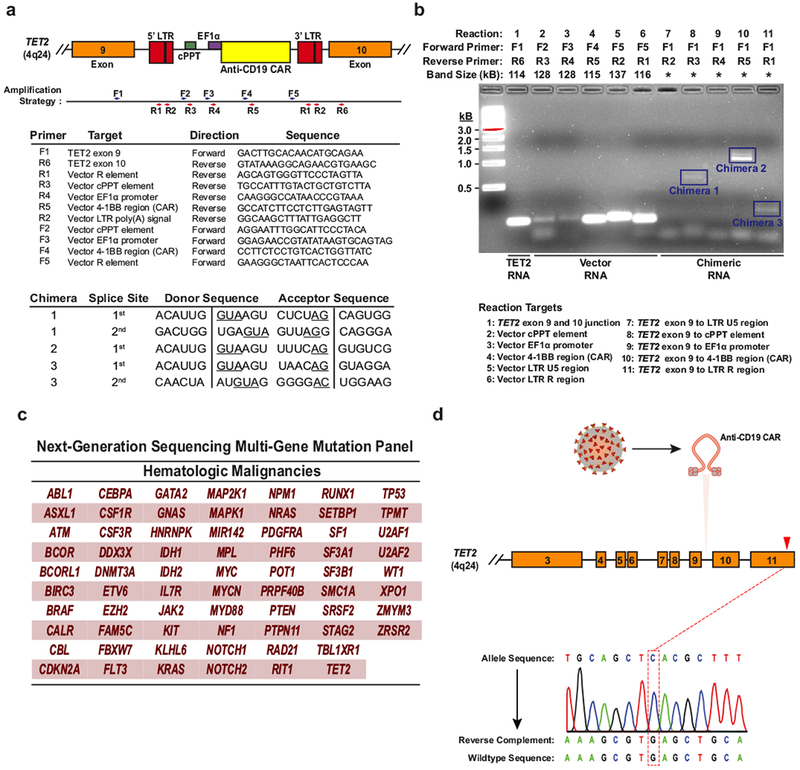
a, The strategy for detection of polyadenylated RNA corresponding to truncated TET2 transcripts is depicted. Boxes represent the genomic regions between TET2 exons 9 and 10 with the integrated vector present. Blue and red arrows indicate general locations of the forward and reverse primers, which are listed below the diagram. LTR, long terminal repeat; cPPT, polypurine tract; EF1α, elongation factor 1-α promoter. Sequences corresponding to the splice junctions for the three chimaeric messages (five total junctions) are listed in the bottom chart. Underlines indicate consensus splice donors and acceptors. b, Visualization of chimaeric TET2 RT–PCR products. PCR products were separated on a native agarose gel and stained with ethidium bromide. Expected sizes of amplicons are listed above the gel. Truncated transcripts are highlighted by blue boxes. A key to the RT–PCR reactions is shown below the diagram. *Band size not determined (two independent experiments). c, Genes interrogated by the next generation sequencing panel used to analyse DNA isolated from CD8+CAR+ T cells and CAR− T cells in Patient-10 at the peak of his response. d, Sanger sequencing of specific amplifications corresponding to the allele that was disrupted by integration of the CAR lentivirus is shown. The mutation that was detected by next generation sequencing of total genomic DNA from CAR+ T cells (Fig. 3c) is not present in the TET2 allele hosting the lentiviral integration site.
Extended Data Fig. 5 |. Analysis of DNA methylation variants from HEK293T cells overexpressing TET2.
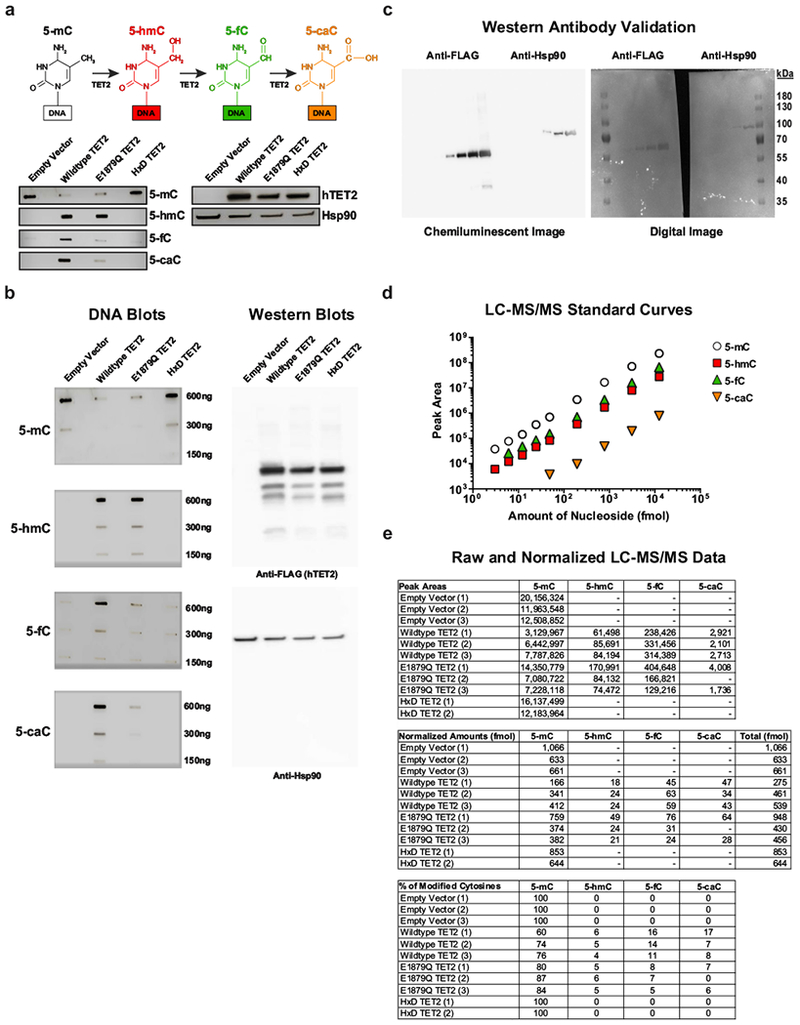
a, Depiction of sequential oxidations of 5-mC to 5-hmC, 5-fC and 5-caC catalysed by TET2 (top). Dot blots for 5-mC, 5-hmC, 5-fC and 5-caC in genomic DNA (gDNA) isolated from HEK293T cells transfected with the E1879Q TET2 mutant are shown. Assay controls include an empty vector, wild-type TET2 and a catalytically inactive (HxD) TET2 mutant (bottom left). A western blot using anti-FLAG antibody to detect hTET2 in the above cells is also shown. Hsp90α/β was used as a loading control (bottom right). Brightness and contrast were adjusted evenly across blots. b, Original, uncropped DNA (left) and western (right) blots. A dilution series was used for semiquantitative analysis of DNA methylation variants. Representative results of three independent experiments are shown. c, Validation of anti-FLAG and anti-Hsp90α/β antibodies. Serial dilutions of lysates (0.008, 0.04, 0.2, 0.8, 4.0 μg μl−1) obtained from HEK293T cells transfected with wild-type TET2. Gels were probed by western blot. Both chemiluminescence (left) and digital (right) images were captured, demonstrating that these antibodies exhibit specificity for the expected FLAG tag and Hsp90 based on molecular weight markers. d, 5-mC, 5-hmC, 5-fC and 5-caC nucleosides were analysed at fixed concentrations using LC–MS/MS to generate standard curves. The area under the curve (AUC) was calculated for each MS/MS fragment. In the case of 5-hmC, the slope was further adjusted because of quality control analysis of an equimolar mixture of oligonucleotides, each containing a single modification. e, Analysis of gDNA from individual biological replicates within each HEK293T cell group. The top chart lists the raw AUCs that were converted to relative amounts of modified cytosine (middle) according to their signal intensities from the respective standard curves. The percentage of each modified cytosine calculated for each sample is shown in the bottom chart. Results are from three independent experiments.
Extended Data Fig. 6 |. Global chromatin profiling of CAR+ and CAR− T cells from Patient-10.
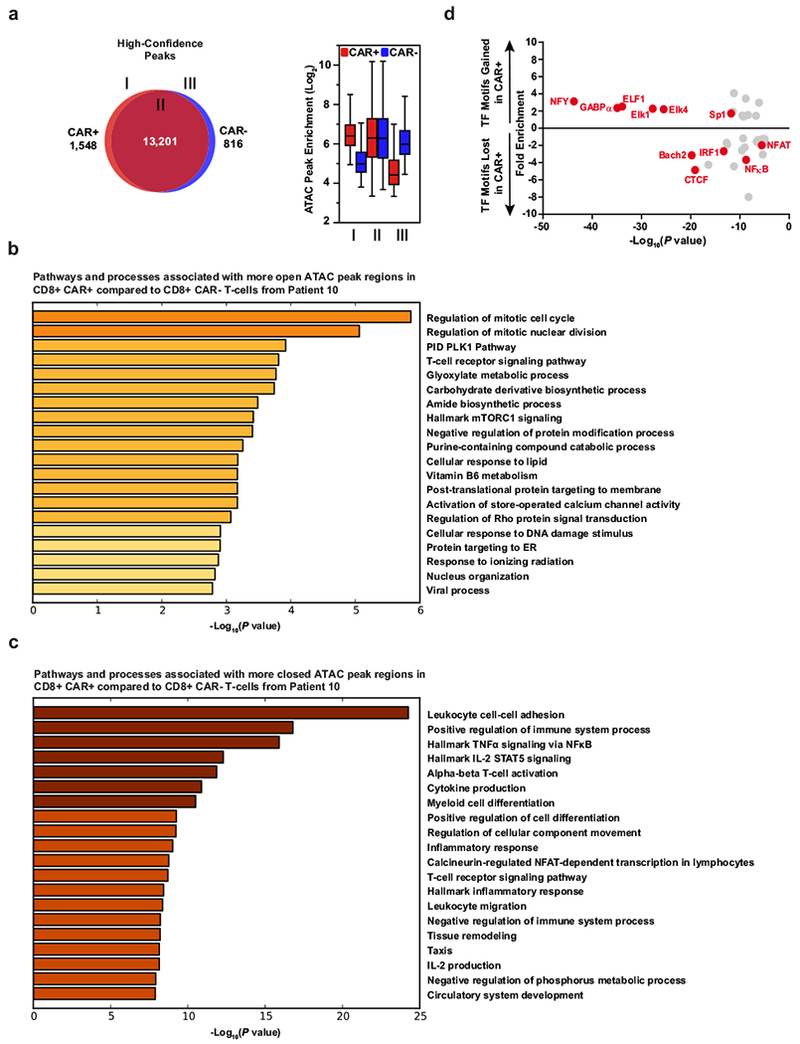
a, Venn diagrams of high-confidence differential ATAC–seq regions (left) and enrichment of those peaks in regions of the diagrams (right) in CAR+ and CAR−CD8+ T cells expanded from Patient-10 (two biological replicates analysed in two independent experiments). Boxes extend from the 25th to 75th percentiles, the middle line denotes the median and whiskers show minimum and maximum. b, Gene Ontology terms associated with chromatin regions that are significantly more open in CD8+CAR+ T cells from Patient-10 compared to their matched CD8+CAR− T cell counterparts. c, Ontology analysis for chromatin regions that are less accessible in CD8+CAR+ T cells than in CD8+CAR− T cells. d, Enrichment of transcription factor (TF) binding motifs in chromatin regions gained or lost in CAR+ compared to CAR−T cells from Patient-10. Transcription factor motifs that were potentially more accessible in increased ATAC–seq peaks of CAR+ T cells included E26 transformation-specific (ETS) (GABPα, ELF1, Elk4) and zinc finger (ZF) transcription factor (Sp1) binding sites that are known to be enriched in human CD8+ T cells before differentiation occurs47. Transcription factor motifs that were potentially less accessible owing to reduced ATAC–seq peaks in CAR+ T cells from Patient 10 (NF-κB, IRF1, NFAT–AP1 and CTCF) are enriched in terminally differentiated effector and exhausted T cells and have known key roles in forming the epigenetic landscape that programs their biology38.
Extended Data Fig. 7 |. The differentiation state of CAR T cells in Patient-10 compared to other responders over time.
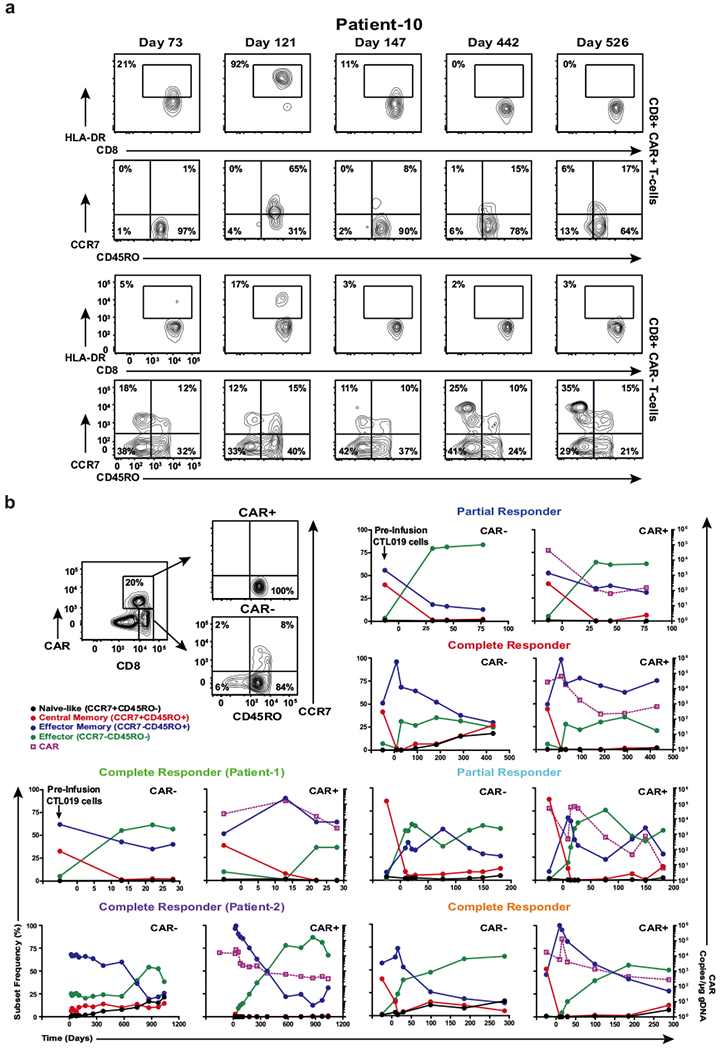
a, Representative contour plots of flow cytometric data depicting the frequency of CAR+ and CAR−CD8+ T cells in Patient-10 that express HLA-DR. The proportions of these cells that express CD45RO and CCR7 as determinants of differentiation status are shown. Contour plot insets indicate the frequencies of the gated cell populations. b, Example gating strategy used to determine the differentiation phenotype of CD8+CAR+ and CAR− T cells from a complete responder (top left). Line graphs depict the differentiation state of these cell populations in other responding patients over time and are plotted with corresponding CAR T cell levels in the blood, as determined by qPCR.
Extended Data Fig. 8 |. Effect of TET2 expression on T cell differentiation and viability.
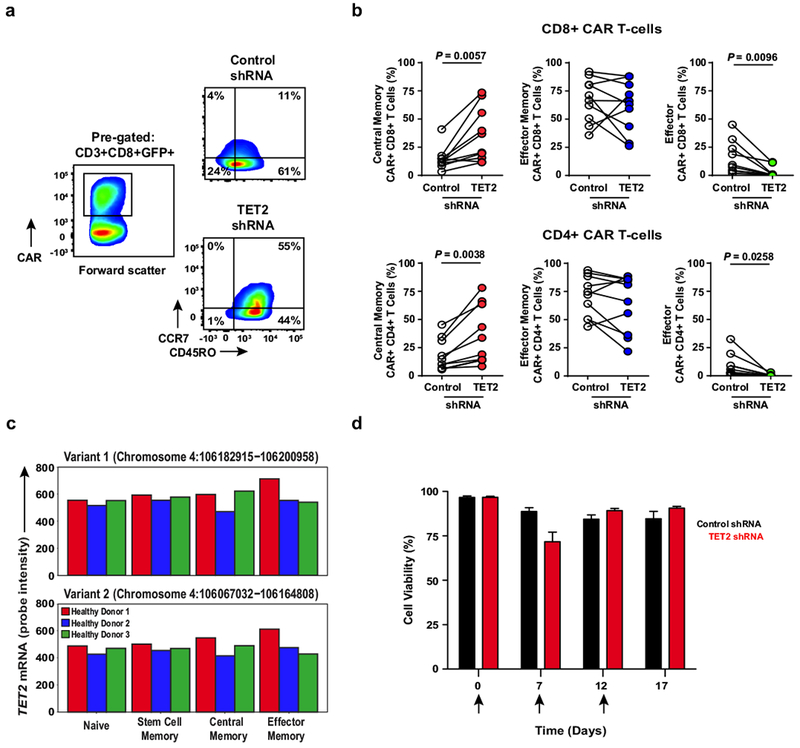
a, Representative flow cytometry plots showing the differentiation state of healthy donor CD8+CAR+ T cells after transduction with a scrambled shRNA (control) or shRNA targeting TET2. Insets define frequencies of gated populations. b, Frequencies of healthy subject CAR+CD8+ (top) and CAR+CD4+ (bottom) T cells according to differentiation phenotype following control or TET2 shRNA transduction (n = 10; pooled results from four independent experiments). P values were determined using a two-tailed, paired Student’s t-test. c, Comparison of the expression levels of TET2 in naive and memory CD8+ T cell subsets from three healthy donors. Two variants encoding different isoforms have been identified for this gene in humans. Expression levels of each TET2 variant were estimated by measuring the probe intensity from microarray analysis. d, Viability of CAR+ T cells transduced with a TET2 shRNA or scrambled control and restimulated with K562 cells expressing CD19 (n = 12; pooled results from three independent experiments). Each arrow indicates the time point at which CAR T cells were exposed to antigen. Error bars depict s.e.m.
Extended Data Fig. 9 |. CAR T cell cytokine profiles following TET2 inhibition.
a, Representative flow cytometry of acute intracellular cytokine production by healthy donor (n = 6; three independent experiments) CAR T cells transduced with a TET2 shRNA or a scrambled control shRNA (left). Production of IFNγ, TNFα and IL-2 by total CD3+, CD4+ and CD8+ CAR T cells is shown. These cells were stimulated with beads coated with anti-CD3 and anti-CD28 antibodies (top right) or CAR anti-idiotypic antibodies (bottom right). Boxes represent the 25th to 75th percentiles, the middle line denotes the median and whiskers depict minimum and maximum. b, Heat map and cluster analysis of cytokine profiles for CAR T cells transduced with a TET2 shRNA or scrambled control and serially restimulated with irradiated K562 cells expressing CD19 are shown. Colours represent scaled cytokine data corresponding to each stimulation time point. Hierarchal clustering was used to generate the cluster dendrogram and cytokine response groups. c, Production of IFNγ (top), TNFα (middle) and IL-2 (bottom) by TET2 knockdown or control CAR T cells (n = 6; three independent experiments) following restimulation with CD19 antigen. Black arrows indicate when CAR T cells were exposed to CD19-expressing K562 cells. Error bars denote s.e.m. All P values were determined using a two-tailed, paired Student’s t-test.
Extended Data Fig. 10 |. Effect of TET2 knockdown on the cytotoxic machinery of CAR T cells.
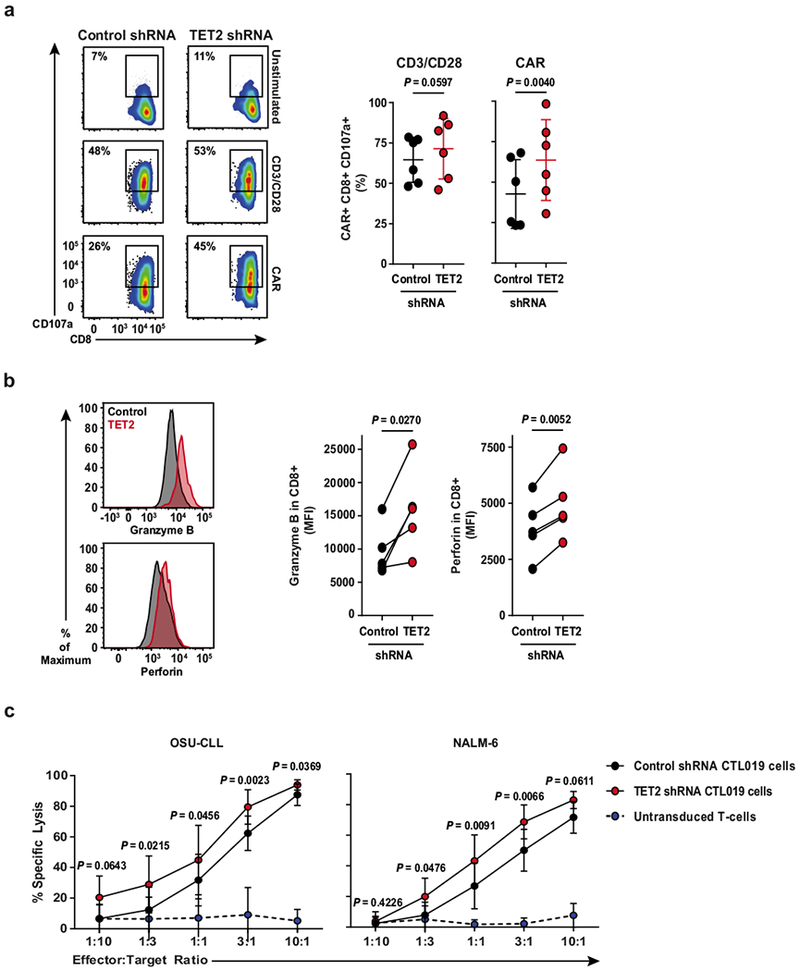
a, Flow cytometry plots showing the frequency of TET2 knockdown or control CAR T cells expressing CD107a (a marker of cytolysis) following CD3 and CD28 or CAR-specific stimulation (left). Summarized data from analysis of CAR T cells manufactured from n = 6 different healthy donors is shown (right). b, Representative histograms illustrating expression levels of granzyme B and perforin in CAR T cells in the setting of TET2 inhibition as compared to its counterpart control (left). Pooled data from CAR T cells of n = 5 healthy donors are summarized on the right. c, Cytotoxic capacity of CTL019 cells (transduced with a TET2 or scrambled control shRNA) after overnight co-culture with luciferase-expressing OSU-CLL (left) or NALM-6 (right) cells. Untransduced T cells were included as an additional group to control for non-specific lysis. P values were determined using a two-tailed, paired Student’s t-test. All data were pooled from three independent experiments.
Extended Data Fig. 11 |. Effector and memory molecule expression by CAR T cells from Patient-10 compared to those from other responding subjects.
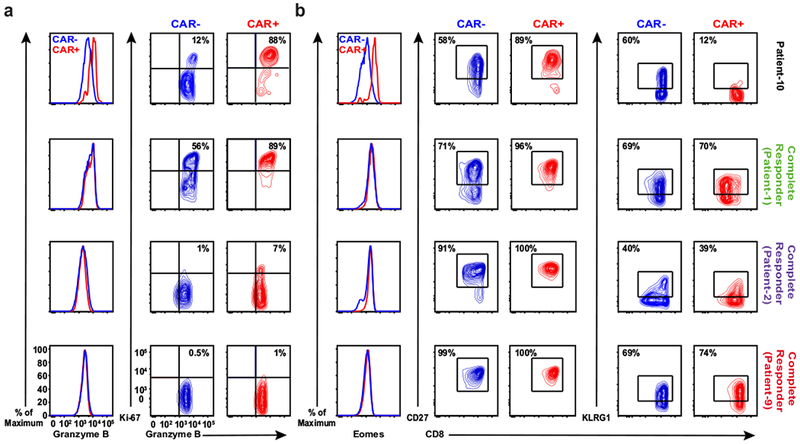
a, Expression of granzyme B (left) and the frequency of CAR−and CAR+ T cells co-expressing granzyme B/Ki-67 (right panel) at the peak of in vivo CTL019 expansion in Patient-10 compared to three other complete responders. b, Representative histograms of intracellular Eomes expression (left), and contour plots depicting frequencies of CD27-(middle) and KLRG1-expressing (right) lymphocytes in the same cell populations of these patients. These results are representative of three experiments repeated independently with comparable findings.
Supplementary Material
Acknowledgements
L. Tian, V. Gonzalez, N. Kengle, J. Scholler, Y. Wu, A. Bagg, C. Pletcher, B. Carreno, A. Bigdeli and A. Chew (University of Pennsylvania) are acknowledged for research support. D. Campana and C. Imai (St. Jude Children’s Research Hospital) provided the CD19-directed CAR under material transfer agreements. B. Jena and L. Cooper (MD Anderson Cancer Center) provided the CAR anti-idiotypic antibody. The OSU-CLL cell line was a kind gift of J.C. Byrd (Ohio State University).
This work was supported by funding from NCI T32CA009140 (J.A.F.), P01CA214278 (C.H.J.), AI104400, AI 082020, AI045008, AI117950 (F.D.B), NIAID K08AI101008 (S.A.C.), NIGMS R01GM118501 (R.M.K.), R01CA165206 (D.L.P. and C.H.J.), a Stand Up to Cancer Phillip A. Sharp Innovation in Collaboration Award (S.L.B. and C.H.J.) and Novartis.
Footnotes
Competing Financial Interests
J.A.F., C.L.N., R.M.Y., B.L.L. M.K., D.L.P., S.F.L., F.D.B., C.H.J. and J.J.M. hold patents related to CTL019 cell therapy. These authors declare no additional financial interests. The remaining authors declare no competing financial interests.
Supplementary Information is available online.
References
- 1.Porter DL, Levine BL, Kalos M, Bagg A & June CH Chimeric antigen receptor-modified T cells in chronic lymphoid leukemia. The New England journal of medicine 365, 725–733, doi: 10.1056/NEJMoa1103849 (2011). [DOI] [PMC free article] [PubMed] [Google Scholar]
- 2.Schuster SJ et al. Chimeric Antigen Receptor T Cells in Refractory B-Cell Lymphomas. The New England journal of medicine 377, 2545–2554, doi: 10.1056/NEJMoa1708566 (2017). [DOI] [PMC free article] [PubMed] [Google Scholar]
- 3.Maude SL et al. Tisagenlecleucel in Children and Young Adults with B-Cell Lymphoblastic Leukemia. The New England journal of medicine 378, 439–448, doi: 10.1056/NEJMoa1709866 (2018). [DOI] [PMC free article] [PubMed] [Google Scholar]
- 4.Porter DL et al. Chimeric antigen receptor T cells persist and induce sustained remissions in relapsed refractory chronic lymphocytic leukemia. Science translational medicine 7, 303ra139, doi: 10.1126/scitranslmed.aac5415 (2015). [DOI] [PMC free article] [PubMed] [Google Scholar]
- 5.Savoldo B et al. CD28 costimulation improves expansion and persistence of chimeric antigen receptor-modified T cells in lymphoma patients. The Journal of clinical investigation 121, 1822–1826, doi: 10.1172/JCI46110 (2011). [DOI] [PMC free article] [PubMed] [Google Scholar]
- 6.Turtle CJ et al. CD19 CAR-T cells of defined CD4+:CD8+ composition in adult B cell ALL patients. The Journal of clinical investigation 126, 2123–2138, doi: 10.1172/JCI85309 (2016). [DOI] [PMC free article] [PubMed] [Google Scholar]
- 7.Busque L et al. Recurrent somatic TET2 mutations in normal elderly individuals with clonal hematopoiesis. Nature genetics 44, 1179–1181, doi: 10.1038/ng.2413 (2012). [DOI] [PMC free article] [PubMed] [Google Scholar]
- 8.Tefferi A et al. Detection of mutant TET2 in myeloid malignancies other than myeloproliferative neoplasms: CMML, MDS, MDS/MPN and AML. Leukemia 23, 1343–1345, doi: 10.1038/leu.2009.59 (2009). [DOI] [PMC free article] [PubMed] [Google Scholar]
- 9.Delhommeau F et al. Mutation in TET2 in myeloid cancers. The New England journal of medicine 360, 2289–2301, doi: 10.1056/NEJMoa0810069 (2009). [DOI] [PubMed] [Google Scholar]
- 10.Quivoron C et al. TET2 inactivation results in pleiotropic hematopoietic abnormalities in mouse and is a recurrent event during human lymphomagenesis. Cancer cell 20, 25–38, doi: 10.1016/j.ccr.2011.06.003 (2011). [DOI] [PubMed] [Google Scholar]
- 11.Yeh CH et al. Mutation of epigenetic regulators TET2 and MLL3 in patients with HTLV-I-induced acute adult T-cell leukemia. Molecular cancer 15, 15, doi: 10.1186/s12943-016-0500-z (2016). [DOI] [PMC free article] [PubMed] [Google Scholar]
- 12.Zang S et al. Mutations in 5-methylcytosine oxidase TET2 and RhoA cooperatively disrupt T cell homeostasis. The Journal of clinical investigation 127, 2998–3012, doi: 10.1172/JCI92026 (2017). [DOI] [PMC free article] [PubMed] [Google Scholar]
- 13.Aslanyan MG et al. Clinical and biological impact of TET2 mutations and expression in younger adult AML patients treated within the EORTC/GIMEMA AML-12 clinical trial. Ann Hematol 93, 1401–1412, doi: 10.1007/s00277-014-2055-7 (2014). [DOI] [PubMed] [Google Scholar]
- 14.Tahiliani M et al. Conversion of 5-methylcytosine to 5-hydroxymethylcytosine in mammalian DNA by MLL partner TET1. Science 324, 930–935, doi: 10.1126/science.1170116 (2009). [DOI] [PMC free article] [PubMed] [Google Scholar]
- 15.Kriaucionis S & Heintz N The nuclear DNA base 5-hydroxymethylcytosine is present in Purkinje neurons and the brain. Science 324, 929–930, doi: 10.1126/science.1169786 (2009). [DOI] [PMC free article] [PubMed] [Google Scholar]
- 16.Ito S et al. Role of Tet proteins in 5mC to 5hmC conversion, ES-cell self-renewal and inner cell mass specification. Nature 466, 1129–1133, doi: 10.1038/nature09303 (2010). [DOI] [PMC free article] [PubMed] [Google Scholar]
- 17.Pfaffeneder T et al. The discovery of 5-formylcytosine in embryonic stem cell DNA. Angewandte Chemie 50, 7008–7012, doi: 10.1002/anie.201103899 (2011). [DOI] [PubMed] [Google Scholar]
- 18.He YF et al. Tet-mediated formation of 5-carboxylcytosine and its excision by TDG in mammalian DNA. Science 333, 1303–1307, doi: 10.1126/science.1210944 (2011). [DOI] [PMC free article] [PubMed] [Google Scholar]
- 19.Ito S et al. Tet proteins can convert 5-methylcytosine to 5-formylcytosine and 5-carboxylcytosine. Science 333, 1300–1303, doi: 10.1126/science.1210597 (2011). [DOI] [PMC free article] [PubMed] [Google Scholar]
- 20.Zhang H et al. 4–1BB is superior to CD28 costimulation for generating CD8+ cytotoxic lymphocytes for adoptive immunotherapy. Journal of immunology 179, 4910–4918 (2007). [DOI] [PMC free article] [PubMed] [Google Scholar]
- 21.Scharer CD, Barwick BG, Youngblood BA, Ahmed R & Boss JM Global DNA methylation remodeling accompanies CD8 T cell effector function. Journal of immunology 191, 3419–3429, doi: 10.4049/jimmunol.1301395 (2013). [DOI] [PMC free article] [PubMed] [Google Scholar]
- 22.Hertlein E et al. Characterization of a new chronic lymphocytic leukemia cell line for mechanistic in vitro and in vivo studies relevant to disease. PLoS ONE 8, e76607 (2013). [DOI] [PMC free article] [PubMed] [Google Scholar]
- 23.Barrett DM et al. Treatment of advanced leukemia in mice with mRNA engineered T cells. Hum. Gene Ther. 22, 1575–1586 (2011). [DOI] [PMC free article] [PubMed] [Google Scholar]
- 24.Maude SL et al. Chimeric antigen receptor T cells for sustained remissions in leukemia. N. Engl. J. Med 371, 1507–1517 (2014). [DOI] [PMC free article] [PubMed] [Google Scholar]
- 25.Jena B et al. Chimeric antigen receptor (CAR)-specific monoclonal antibody to detect CD19-specific T cells in clinical trials. PLoS ONE 8, e57838 (2013). [DOI] [PMC free article] [PubMed] [Google Scholar]
- 26.Brady T et al. A method to sequence and quantify DNA integration for monitoring outcome in gene therapy. Nucleic Acids Res. 39, e72 (2011). [DOI] [PMC free article] [PubMed] [Google Scholar]
- 27.Berry C, Hannenhalli S, Leipzig J & Bushman FD Selection of target sites for mobile DNA integration in the human genome. PLOS Comput. Biol. 2, e157 (2006). [DOI] [PMC free article] [PubMed] [Google Scholar]
- 28.Berry CC et al. Estimating abundances of retroviral insertion sites from DNA fragment length data. Bioinformatics 28, 755–762 (2012). [DOI] [PMC free article] [PubMed] [Google Scholar]
- 29.Berry CC, Ocwieja KE, Malani N & Bushman FD Comparing DNA integration site clusters with scan statistics. Bioinformatics 30, 1493–1500 (2014). [DOI] [PMC free article] [PubMed] [Google Scholar]
- 30.Scholler J et al. Decade-long safety and function of retroviral-modified chimeric antigen receptor T cells. Sci. Transl. Med 4, 132ra53 (2012). [DOI] [PMC free article] [PubMed] [Google Scholar]
- 31.Daber R, Sukhadia S & Morrissette JJ Understanding the limitations of next generation sequencing informatics, an approach to clinical pipeline validation using artificial data sets. Cancer Genet. 206, 441–448 (2013). [DOI] [PubMed] [Google Scholar]
- 32.Liu MY et al. Mutations along a TET2 active site scaffold stall oxidation at 5-hydroxymethylcytosine. Nat. Chem. Bio 13, 181–187 (2017). [DOI] [PMC free article] [PubMed] [Google Scholar]
- 33.Hu L et al. Crystal structure of TET2-DNA complex: insight into TET-mediated 5mC oxidation. Cell 155, 1545–1555 (2013). [DOI] [PubMed] [Google Scholar]
- 34.Liu MY, DeNizio JE & Kohli RM Quantification of oxidized 5-methylcytosine bases and TET enzyme activity. Methods Enzymol. 573, 365–385 (2016). [DOI] [PMC free article] [PubMed] [Google Scholar]
- 35.Jin J et al. Simplified method of the growth of human tumor infiltrating lymphocytes in gas-permeable flasks to numbers needed for patient treatment. J. Immunother 35, 283–292 (2012). [DOI] [PMC free article] [PubMed] [Google Scholar]
- 36.Carty SA et al. The loss of TET2 promotes CD8+ T cell memory differentiation. J. Immunol 200, 82–91 (2018). [DOI] [PMC free article] [PubMed] [Google Scholar]
- 37.Buenrostro JD, Giresi PG, Zaba LC, Chang HY & Greenleaf WJ Transposition of native chromatin for fast and sensitive epigenomic profiling of open chromatin, DNA-binding proteins and nucleosome position. Nat. Methods 10, 1213–1218 (2013). [DOI] [PMC free article] [PubMed] [Google Scholar]
- 38.Pauken KE et al. Epigenetic stability of exhausted T cells limits durability of reinvigoration by PD-1 blockade. Science 354, 1160–1165 (2016). [DOI] [PMC free article] [PubMed] [Google Scholar]
- 39.Xu J et al. Landscape of monoallelic DNA accessibility in mouse embryonic stem cells and neural progenitor cells. Nat. Genet 49, 377–386 (2017). [DOI] [PMC free article] [PubMed] [Google Scholar]
- 40.Laport GG et al. Adoptive transfer of costimulated T cells induces lymphocytosis in patients with relapsed/refractory non-Hodgkin lymphoma following CD34+-selected hematopoietic cell transplantation. Blood 102, 2004–2013 (2003). [DOI] [PubMed] [Google Scholar]
- 41.Fraietta JA et al. Ibrutinib enhances chimeric antigen receptor T cell engraftment and efficacy in leukemia. Blood 127, 1117–1127 (2016). [DOI] [PMC free article] [PubMed] [Google Scholar]
- 42.Gattinoni L et al. A human memory T cell subset with stem cell-like properties. Nat. Med 17, 1290–1297 (2011). [DOI] [PMC free article] [PubMed] [Google Scholar]
- 43.Carvalho BS & Irizarry RA A framework for oligonucleotide microarray preprocessing. Bioinformatics 26, 2363–2367 (2010). [DOI] [PMC free article] [PubMed] [Google Scholar]
- 44.Irizarry RA et al. Summaries of Affymetrix GeneChip probe level data. Nucleic Acids Res. 31, e15 (2003). [DOI] [PMC free article] [PubMed] [Google Scholar]
- 45.Brady T et al. Integration target site selection by a resurrected human endogenous retrovirus. Genes Dev. 23, 633–642 (2009). [DOI] [PMC free article] [PubMed] [Google Scholar]
- 46.Ocwieja KE et al. HIV integration targeting: a pathway involving Transportin-3 and the nuclear pore protein RanBP2. PLoS Pathog. 7, e1001313 (2011). [DOI] [PMC free article] [PubMed] [Google Scholar]
- 47.Moskowitz DM et al. Epigenomics of human CD8 T cell differentiation and aging. Sci. Immunol 2, eaag0192 (2017). [DOI] [PMC free article] [PubMed] [Google Scholar]
Associated Data
This section collects any data citations, data availability statements, or supplementary materials included in this article.