

Abstract
Purpose:
The NHS-IL12 immunocytokine is composed of two IL-12 heterodimers fused to the NHS76 antibody. Preclinical studies have shown that this antibody targets IL-12 to regions of tumor necrosis by binding histones on free DNA fragments in these areas, resulting in enhanced antitumor activity. The objectives of this phase I study were to determine the maximum tolerated dose (MTD) and pharmacokinetics of NHS-IL12 in subjects with advanced solid tumors.
Experimental Design:
Subjects (n=59) were treated subcutaneously with NHS-IL12 in a single ascending dose cohort followed by a multiple ascending dose cohort (n=37 with every 4-week dosing).
Results:
The most frequently observed treatment-related adverse events (TRAEs) included decreased circulating lymphocytes, increased liver transaminases and flu-like symptoms. Of the grade ≥ 3 TRAEs, all were transient and only one was symptomatic (hyperhidrosis). The MTD is 16.8 µg/kg. A time-dependent rise in IFN-γ and an associated rise in IL-10 were observed post‒NHS-IL12. Of peripheral immune cell subsets evaluated, most noticeable were increases in frequencies of activated and mature natural killer (NK) cells and NKT cells. Based on TCR sequencing analysis, increases in T-cell receptor diversity and tumor-infiltrating lymphocyte density were observed post-treatment where both biopsies and peripheral blood mononuclear cells were available. Although no objective tumor responses were observed, 5 subjects had durable stable disease (range 6–30+ months).
Conclusions:
NHS-IL12 was well tolerated up to a dose of 16.8 µg/kg, which is the recommended phase II dose. Early clinical immune-related activity warrants further studies, including combination with immune checkpoint inhibitors.
Keywords: NHS-IL12, immunotherapy, immunocytokine
Introduction
Interleukin-12 (IL-12), a proinflammatory cytokine produced by activated phagocytes and dendritic cells (DCs), is critical to regulating the transition from innate to adaptive immunity. IL-12 acts directly on natural killer (NK), NKT, and CD8+ T cells to stimulate proliferation and increase their cytotoxic functions (1). IL-12 drives differentiation of helper T cells down the Th1 pathway, thereby promoting production of cytokines, notably IFN-γ, that favor cell-mediated immunity (2). IL-12 also acts directly on DCs to further stimulate IL-12 production and enhance antigen presentation (3). Administration of exogenous IL-12 thus could promote effective antitumor immune responses by amplifying these positive immunostimulatory effects.
However, recombinant (r) IL-12 is not approved for any indication. A narrow therapeutic window with previously evaluated forms of systemic administration may have limited its ability to induce objective responses, delaying further clinical development (4, 5). To mitigate the side effects caused by systemic exposure, some early studies were done with intratumoral injections with viral vectors encoding IL-12; however, this approach is logistically demanding (6). Furthermore, IL-12 induces a counter-regulation, making subjects temporarily less sensitive to the effects of IL-12. This counter-regulation is mediated by the induction and release of Th2 cytokines, such as IL-10, which negates the IL-12 response (7). If repeated doses of rIL-12 are administered during this period of decreased sensitivity, increases in serum IFN-γ are sharply reduced compared to levels induced by the initial dose of rIL-12.
rIL-12 has nonetheless shown promising clinical activity in phase I trials (8), showing an ability to induce antitumor immune responses at the maximum tolerated dose (MTD) over an extended period (9). Higher objective response rates with rIL-12 have been reported in certain neoplastic diseases, including T-cell lymphoma (56%) (10), non-Hodgkin’s lymphoma (21%) (11), and AIDS-related Kaposi’s sarcoma (50%–71%) (12).
NHS-IL12 may reduce toxicities associated with systemic administration of recombinant human IL-12 by altering pharmacokinetics and selectively targeting IL-12 to tumors. The NHS antibody component selectively targets human lung carcinomas as a radiolabeled monoclonal antibody (13). The NHS-IL12 immunocytokine is composed of two IL-12 heterodimers, each fused to one of the H chains of the NHS76. This antibody targets IL-12 to regions of tumor necrosis by binding to histones on free DNA fragments in these areas, thus increasing intratumoral exposure and reducing systemic exposure (14). This targeted strategy could reduce systemic toxicity and increase immune infiltration and activity within the tumor microenvironment (15), in turn priming otherwise nonimmunogenic tumors to checkpoint inhibition and increasing the spectrum of cancers that may respond to these agents.
Data from both in vitro assays using human peripheral blood mononuclear cells (PBMCs) and in vivo primate studies showed that immune cells produce less IFN-γ following treatment with NHS-IL12, suggesting less toxicity than rIL-12 alone (13). NHS-IL12 up to 0.8 mg/m2 was safely administered systematically to dogs and produced both immunological and clinical activity (14), including complete regression of a 4.4-cm malignant melanoma. NHS-IL12 was also superior to rIL-12 as an antitumor agent in 3 murine tumor models (13). Mechanistic studies all indicated that the antitumor effects of NHS-IL12 were primarily CD8+ T cell-dependent and likely IL-12-mediated.
This phase I study evaluated the safety, tolerability, pharmacokinetics, biological and clinical activity, effects on immune cell subsets, and T-cell receptor (TCR) clonality of NHS-IL12 in subjects with metastatic or locally advanced solid epithelial or mesenchymal tumors.
Patients and Methods
Eligibility
Eligible subjects had histologically or cytologically verified metastatic or locally advanced solid epithelial or mesenchymal tumors. All had completed, or progressed on, at least one prior therapy for metastatic disease, or were not candidates for therapy of proven efficacy for their disease. Subjects were ≥ 18 years old, had an ECOG performance status of 0–2, and had adequate organ function. Subjects had no history of autoimmune disease. The study protocol (NCT01417546) was approved by the National Cancer Institute’s Institutional Review Board, all subjects gave written informed consent, and the study was conducted in accordance with all institutional and federal guidelines.
Assessment of toxicities
Toxicities, graded using the NCI Common Terminology Criteria for Adverse Events v.4.0, were identified by medical history, physical examination, and laboratory studies. A dose-limiting toxicity (DLT) was defined as any grade ≥ 4 hematologic toxicity or grade 3 thrombocytopenia with associated bleeding and any grade ≥ 3 nonhematologic toxicity, with minor exceptions, that was definitely, probably, or possibly related to administration of NHS-IL12.
Study design
This phase I, open-label, single and multiple dose-escalation study evaluated the MTD of NHS-IL12 monotherapy given subcutaneously (s.c.) as a single dose or every 4 weeks (see Table 1). Subjects were enrolled in cohorts of 3–6 using a standard 3+3 approach until MTD was reached. Dose level 8 enrolled 11 additional subjects in an expansion cohort evaluating biomarker analysis, immune infiltration of tumor, and response to treatment.
Table 1.
Demographic data
| Dose level | Demographics | Single dose (n=22) | Multiple dose (n=37) | Overall (n=59) |
|---|---|---|---|---|
| Evaluable for Safety, n | ||||
| 1 | Dose 0.1 μg/kg | 3 | 3 | |
| 2 | Dose 0.5 μg/kg | 3 | 3 | |
| 3 | Dose 1.0 μg/kg | 4 | 4 | |
| 4 | Dose 2.0 μg/kg | 4 | 5 | 9 |
| 5 | Dose 4.0 μg/kg | 3 | 3 | 6 |
| 6 | Dose 8.0 μg/kg | 3 | 3 | 6 |
| 7 | Dose 12.0μg/kg | 2 | 3 | 5 |
| 8 | Dose 16.8 μg/kg | 17 | 17 | |
| 9 | Dose 21.8 μg/kg | 6 | 6 | |
| Age, years | ||||
| Mean ±SD | 59±13 | 58±12 | 59±12 | |
| Median | 61 | 62 | 62 | |
| Min, Max | 36; 80 | 34; 85 | 34; 85 | |
| Sex, n (%) | ||||
| Male | 12 (54.5) | 18 (48.65) | 30 (50.85) | |
| Female | 10 (45.5) | 19 (51.35) | 29 (49.15) | |
| Race, n (%) | ||||
| White | 17 (77.3) | 22 (59.5) | 39 (66.1) | |
| Black or African-American | 3 (13.6) | 6 (16.2) | 9 (15.3) | |
| Asian | 1 (4.5) | 5 (13.5) | 6 (10.2) | |
| Unknown or not reported | 1 (4.5) | 4 (10.8) | 5 (8.5.) | |
| Number of Prior Treatments | ||||
| Mean ±SD | 3.73±2.31 | 3.45±2.0 | 3.55±2.11 | |
| Median | 3.5 | 3 | 3 | |
| Min,Max | 1;10 | 1;9 | 1;10 | |
| ECOG Performance Status, n (%) | ||||
| 6 (27.2) | 21 (56.8) | 27 (45.8) | ||
| 0 | 16 (72.8) | 16 (43.2) | 32 (54.2) | |
| 1 |
In the single-dose cohort, subjects received 1 dose of NHS-IL12 and were then followed for 28 days. In the multiple-dose escalation cohort, subjects received NHS-IL12 every 4 weeks at 2, 4, 8, 12, 16.8, and 21.8 µg/kg, then were observed for ≥ 6 weeks to evaluate DLTs.
Tumor responses were assessed by CT scan of the chest, abdomen, and pelvis after every 2 treatments or 8 weeks, or, for subjects with nonmeasurable but evaluable disease, after every 4 treatments or every 16 weeks based on clinical judgment and subject preference. Responses were assessed by modified immune-related RECIST criteria. For immune-related response criteria (irRC), only index and measurable new lesions were taken into account. Overall responses were derived from changes in index, nonindex, and new lesions.
Pharmacokinetics and pharmacodynamics
Pharmacokinetic (PK) parameters, including T1/2, Cmax, and AUC, were determined after single and multiple s.c. doses of NHS-IL12. Pharmacodynamic (PD) data were also collected and analyzed, including changes in serum levels of cytokines (IFN- γ, IL-10, IL-6, IL-8, IL-4, and TNF-α) using a multiplex cytokine/chemokine kit (Meso Scale Discovery, Gaithersburg, MD) and the human IP-10 Instant ELISA kit (eBioscience, San Diego, CA) per the manufacturer’s instructions. Biopsies were collected for analysis of TCR clonality, CD8 and CD4 memory/effector cells, regulatory T cells, NK cells, and DCs.
Flow cytometry
Flow cytometry was performed as previously described (16) using 4 panels of antibodies to identify 9 immune cell subsets, including CD4+ and CD8+ T lymphocytes, Tregs, NK cells, NKT cells, B lymphocytes, conventional and plasmacytoid DCs, and myeloid-derived suppressor cells, and 114 additional refined subsets relating to the maturation/function of standard subsets. All values were reported as % of PBMCs to eliminate bias that could occur in smaller populations with fluctuations in parental leukocyte subpopulations (17). Only those subsets with a frequency of ≥ 0.01% of PBMCs were considered. Statistical analyses were performed using GraphPad Prism 7 (GraphPad Software, La Jolla, CA), employing Wilcoxon paired samples test for comparisons between 2 time points. P values were adjusted for the large number of subsets evaluated using Holm’s method and adjusting within each major subset.
TCR sequencing analysis
DNA was extracted from fresh frozen liver metastases and cryopreserved PBMCs before and after therapy with NHS-IL12 using the Qiagen DNeasy Blood and Tissue Kit (Qiagen, Venlo, Netherlands). TCR Vβ CDR3 sequencing (TCRseq) was performed at the NCI genomic core facility (Frederick, MD) using the survey (tumor) or deep (PBMCs) resolution Immunoseq platform (Adaptive Biotechnologies, Seattle, WA); analysis was performed using the ImmunoSeq ANALYZER 3.0 (Adaptive Biotechnologies). Repertoire size, a measure of TCR diversity, was determined by calculating the number of individual clonotypes represented in the top 25th percentile by ranked molecule count after sorting by abundance. Tumor-infiltrating lymphocyte (TIL) density was calculated from TCRseq data based on a human genome weight of 6.6 pg/cell: TIL density = (# productive templates) / (DNA input (pg) / 6.6).
Statistical analysis
Summary statistics used to describe the study population included means, medians, ranges, and appropriate measures of variability for all demographic and baseline performance status characteristics. Results of safety evaluations were tabulated and displayed by dose level. Except for a few comparisons of biologic parameters, only exploratory statistical analyses were performed due to the limited number of subjects receiving each dose level. Descriptive statistics were examined for indications of dose-related toxicity.
Results
Altogether, 59 subjects were treated with NHS-IL12. The single ascending-dose cohort had 22 subjects who received a single dose of NHS-IL12 on day 1 and completed the study after 28 days of safety observation (see Table 1). In the multiple ascending-dose and expansion cohorts, 37 subjects were treated every 4 weeks.
The median treatment duration in the multiple ascending-dose cohort was 70.0 days (range 28–1410+), with a median 2.5 doses administered (range 1–47+). The 17 subjects treated at 16.8 µg/kg MTD (dose level 8) received a median 2 doses (range 1–8).
Pharmacokinetics and pharmacodynamics data
PK data from the single- (Supplementary Table 1A) and multiple-dose (Supplementary Table 1B) cohorts show a dose-dependent increase in T1/2, Cmax, and AUC for NHS-IL12. PD data (Figure 1A) demonstrate a time-dependent rise in IFN-γ after administration and an associated rise of IL-10 (Supplemental Figure 1). These correspond to a similar rise in IL-12 seen in the PK data, peaking around 36 hours then falling to near baseline around day 8. In most multiple-dose subjects, despite a similar rise in serum IL-12, IFN-γ and IL-10 rose to a lesser degree after the second dose. Figure 1A shows PD results for subjects dosed at the MTD of 16.8 µg/kg every 4 weeks (dose level 8). Supplementary Figures 2, 3, and 4 show PD results for dose levels 6, 7, and 9, respectively.
Figure 1.
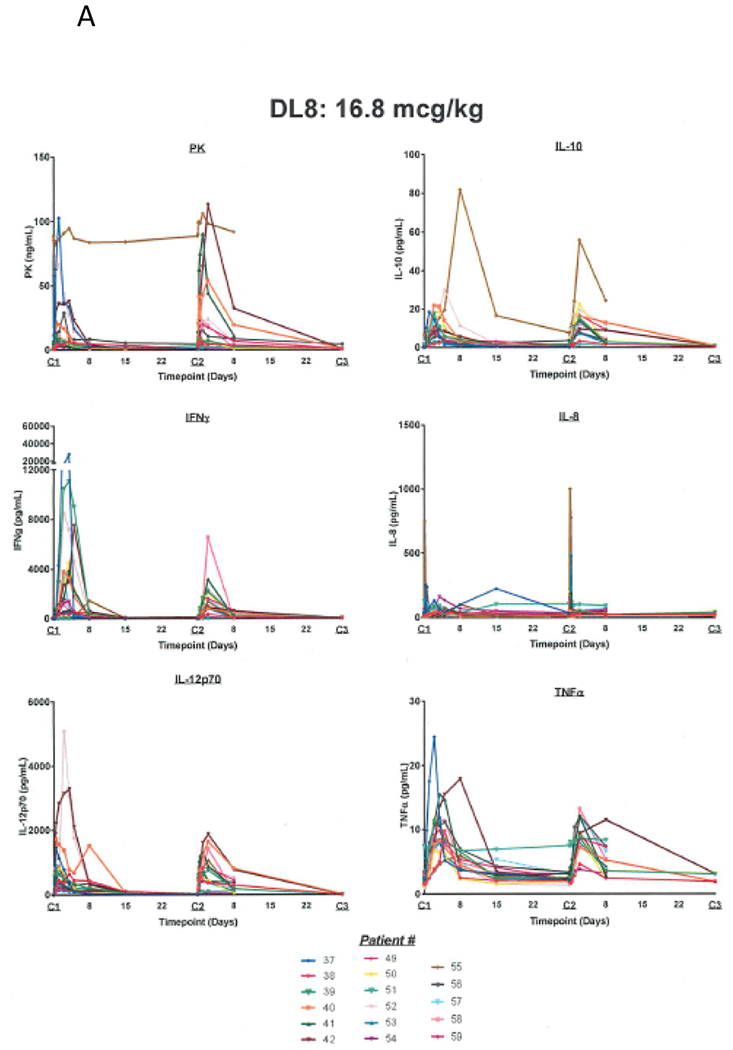
A) Pharmacokinetic and pharmacodynamic parameters for NHS-IL12 dosed at the MTD of 16.8 µg/kg every 4 weeks. A time-dependent rise in IFN-γ was noted after administration and a subsequent rise of IL-10. These corresponded to a rise in IL-12 similar to what was seen with the PK values, peaking around 36 hours, and then falling to near baseline levels around day 8. When subjects were re-dosed at 4 weeks, in most cases, despite a similar rise in the serum IL-12, a diminished rise was noted in IFN-γ and IL-10 with the second dose. B) Analysis of serum levels of IP-10 following treatment with NHS-IL12 at different dose levels. Serum levels of IP-10 were measured by ELISA pre‒ and at multiple time points post‒NHS-IL12.
Similar trends were seen for serum levels of IFN-γ‒inducible protein (IP-10, CXCL10; Figure 1B), a chemokine secreted by macrophages after stimulation by IFN-γ that acts as a chemoattractant for activated T cells and inhibits neovascularization (18). We found highly increased levels after cycle 1 and lesser increases after cycle 2. The highest levels were in subjects treated at the highest doses of NHS-IL12 (Figure 1B).
Toxicity
The primary objective of this trial was to determine MTD as defined by the number of DLTs. None of the subjects treated with single or multiple doses up to 12.0 µg/kg experienced a DLT. At 16.8 µg/kg, 1/6 subjects had a DLT (grade 3 increase in alanine transaminase [ALT]). At 21.8 µg/kg, 2/6 subjects had a DLT (grade 3 increase in aspartate transaminase [AST] and ALT; grade 3 increase in lipase without clinical signs of pancreatitis). MTD was 16.8 µg/kg.
The most frequently observed treatment-related adverse event (TRAE) was decreased lymphocyte count (27/59 subjects; 45.8%). Other TRAEs included decreased white blood cells (WBCs) (24/59; 40.7%), fever and elevated AST (21 each; 35.6%), elevated ALT (20; 3.9%), and anemia and flu-like symptoms (18 each; 30.5%) (Table 2; Supplemental Figure 5). Among the cohort receiving 16.8 µg/kg, the most frequently reported TRAEs were elevated AST (75%), decreased WBCs and elevated ALT (68.8% each), and decreased lymphocyte count and fever (62.5% each).
Table 2.
Overview of Treatment Emergent Adverse Events (TEAEs) and Treatment Related Adverse Events (TRAEs)
| TEAE categories | Single dose (n=22) n (%) | Multiple doses (n=37) n (%) | Overall (n=59) n (%) |
|---|---|---|---|
| Any TEAE | 21 (95.5) | 36 (97.3) | 57 (96.6) |
| Any grade ≥ 3 TEAE | 7 (31.8) | 15 (40.5) | 22 (37.3) |
| Any TRAE | 17 (77.3) | 31 (83.89) | 48 (81.4) |
| Any grade ≥ 3 TRAE | 2 (9.1) | 10 (27.0) | 12 (20.3)* |
| Any TEAE leading to permanent discontinuation of study drug | 0 (0.0) | 3 (8.1) | 3 (5.1) |
| Any serious TEAE | 3 (13.6) | 6 (16.2) | 9 (15.3) |
| Any serious TRAE | 0 (0.0) | 2 (5.4) | 2 (3.4) |
| Adverse Event | Grade 1/2 n (%) | Grade 3 n (%) | Grade 4 n (%) |
|---|---|---|---|
| Decrease in lymphocyte count | 21 (35.6%) | 5 (8.5%) | 1 (1.7%) |
| Decrease in neutrophil count | 6 (10.2%) | 4 (6.8%) | 0 |
| Thrombocytopenia | 12 (20.3%) | 0 | 0 |
| Decrease in WBCs | 22 (37.3%) | 2 (3.4%) | 0 |
| Hyperglycemia | 10 (16.9%) | 0 | 0 |
| Hypoalbuminemia | 6 (10.2%) | 0 | 0 |
| Hypokalemia | 0 | 1 (1.7%) | 0 |
| Hypophosphatemia | 6 (10.2%) | 0 | 0 |
| Hyperhidrosis | 0 | 1 (1.7%) | 0 |
| Anemia | 18 (30.5%) | 0 | 0 |
| Fatigue | 10 (16.9%) | 0 | 0 |
| Fever | 21 (35.6%) | 0 | 0 |
| Flu-like symptoms | 18 (30.5%) | 0 | 0 |
| Increase in ALT | 17 (28.8%) | 3 (5.1%) | 0 |
| Increase in alkaline phosphatase | 12 (20.3%) | 1 (1.7%) | 0 |
| Increase in AST | 20 (33.9%) | 1 (1.7%) | 0 |
| Increase in lipase | 0 | 1 (1.7%) | 0 |
Except for one episode of grade 3 hyperhidrosis, all other grade 3 TEAEs were asymptomatic hematologic events and were not clinically significant.
WBC, white blood cell count
ALT, alanine transaminase
AST, aspartate transaminase
At least one grade ≥ 3 TRAE was seen in 12/59 subjects (20.3%). These included decreased lymphocyte count (5; 8.5%), decreased neutrophil count (4; 6.8%), elevated ALT (3; 5.1%), decreased WBCs (2; 3.4%), and hypokalemia, hyperhidrosis, elevated alkaline phosphatase, AST, and lipase (1 each; 1.7%). All grade ≥ 3 TRAEs were transient; only hyperhidrosis was symptomatic. One grade 4 TRAE was observed (asymptomatic decreased lymphocyte count); no grade 5 TRAE was observed. Toxicity was slightly worse at 16.8 µg/kg, with 5/17 subjects (29.4%) experiencing at least one grade ≥ 3 TRAE. Overall, 48 subjects (81.4%) experienced TRAEs (Table 2); only 2 (3.4%) were serious.
Response to therapy
No objective tumor responses were observed according to modified RECIST criteria. Of 30 subjects with measurable disease, 15 had stable disease and 15 had progressive disease as best overall response. Five subjects (prostate x2, colorectal, breast, chordoma) stayed on study for ≥ 182 days. One subject with prostate cancer and one with chordoma had prolonged stable disease (30+ months and 13 months, respectively).
Changes in the peripheral immunome
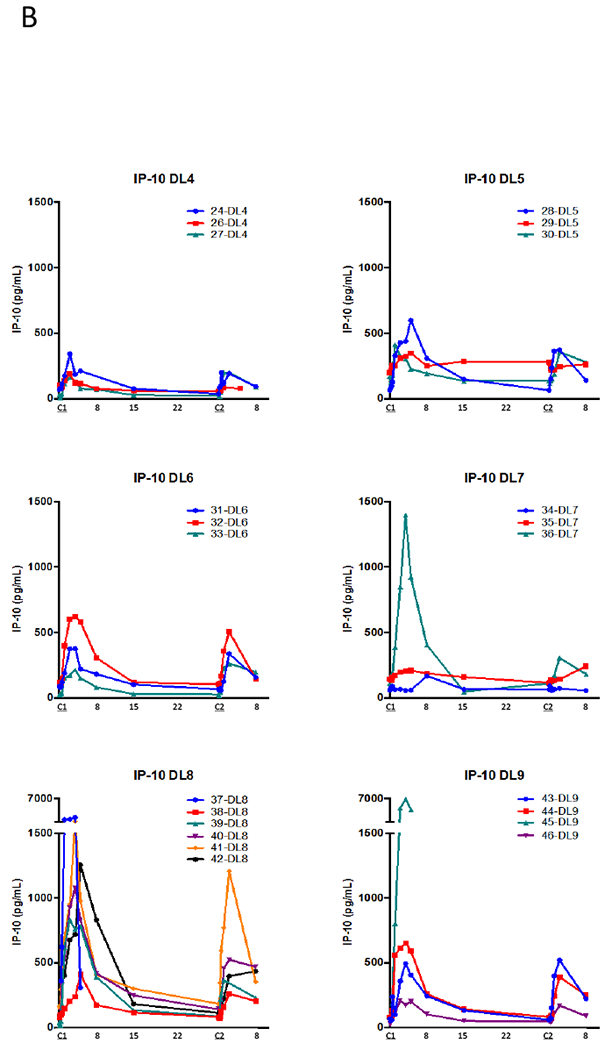
Multicolor flow cytometry was used to evaluate 123 discrete immune cell subsets, including 9 standard subsets and 114 refined subsets, as previously described (16). All 123 immune cell subsets were evaluated on day 1 and day 8, 1 week after the first dose, in 10 subjects receiving 16.8 µg/kg of NHS-IL12 (dose level 8). Frequencies of activated (Tim3+) NK cells, mature NK cells, and PD-1+ NKT cells increased (Figure 2). Frequencies of terminally differentiated PD-L1+ CD4 T cells (CD4-EMRA) and plasmacytoid DCs decreased, while frequencies of the 9 standard immune cell subsets remained unchanged 1 week post-therapy. PBMCs were also available from 13/17 subjects at dose level 8 for multicolor flow cytometry at baseline and day 57 after 2 cycles of NHS-IL12. Of the 9 standard subsets, only the frequency of NKT cells increased significantly from day 1 to day 57 (Supplementary Table 2). No other subsets changed significantly.
Figure 2.
The frequencies of five refined immune cell subsets changed significantly 1 week post‒cycle 1 vs. pre‒NHS-IL-12 treatment for 10 subjects at dose level 8 (16.8 µg/kg). Flow cytometry was performed to evaluate 123 discrete immune cell subsets, including nine standard subsets and 114 refined subsets A). All values shown are the frequency of the subset out of all PBMCs shown as median (IQR). B-D) Graphs depicting three of these subsets.
Changes in immune cell infiltration
Three pre- and post-treatment paired biopsies were evaluated using the MultiOmyx mIF-IHC TIL Panel (NeoGenomics, Fort Myers, FL) to assess potential NHS-IL12-induced changes in immune cell infiltration and PD-L1 expression. A trend toward increased PD-L1 expression was detected in 2/3 pairs. No large changes in various immune cell readouts were observed; however, sample size was limited.
TCR sequencing
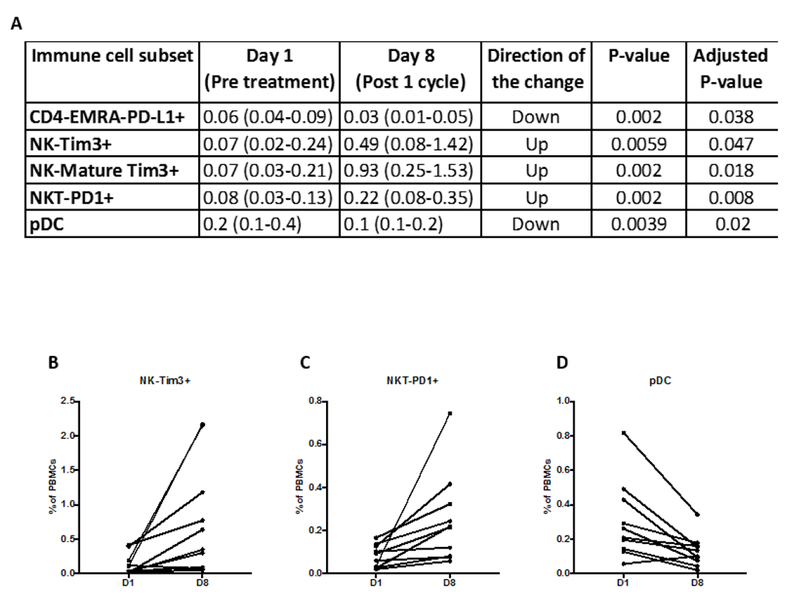
To investigate whether NHS-IL12 induces remodeling of the T-cell repertoire, we performed TCRseq on available tumor biopsies and corresponding PBMCs pre- and post-NHS-IL12 from 4 subjects in the dose level 8 expansion cohort (Figure 3A). Representative TCRβ clonotype frequency plots of the biopsy (Figure 3B) and PBMCs (Figure 3C) of a subject with a high systemic IFN-γ response (PT58) are depicted pre- and post-NHS-IL12 therapy. TCR diversity increased 6- to 14-fold in biopsies of subjects with a high (PT58) or intermediate (PT57) IFN-γ response, but was unchanged or decreased in biopsies of subjects with a low (PT51, PT59) IFN-γ response (Figure 3D).
Figure 3.
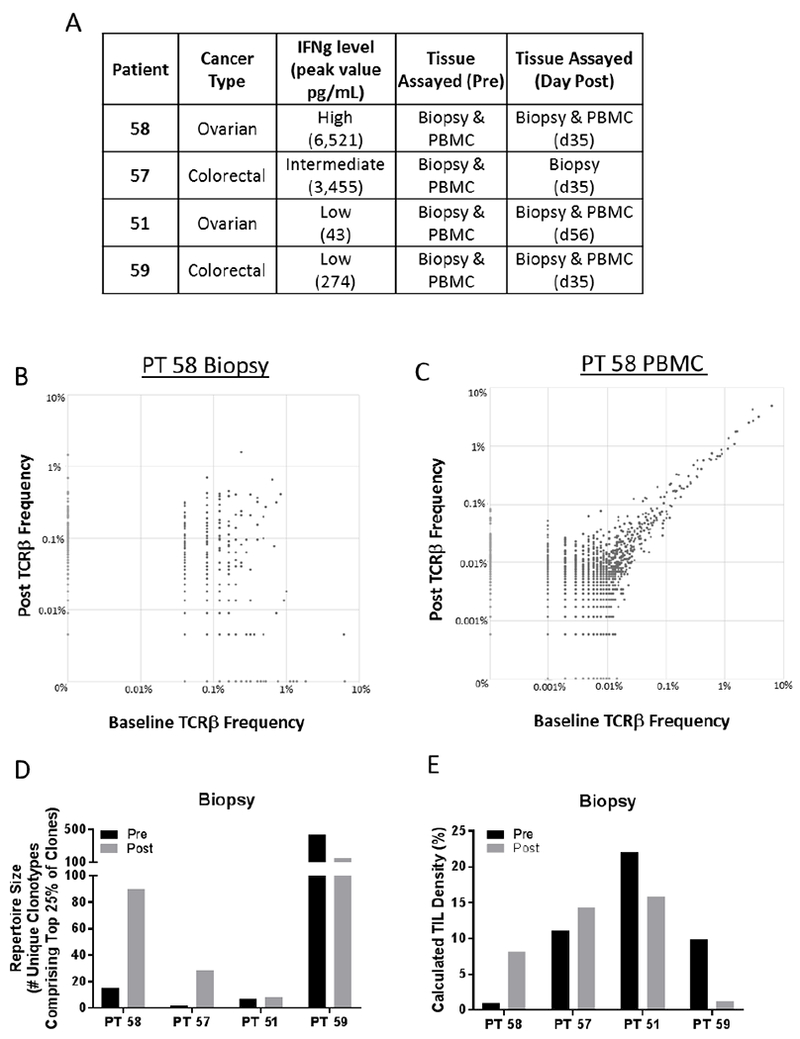
Effect of NHS-IL12 on remodeling of T-cell repertoire in four subjects from dose level 8 expansion with varying IFN-γ responses. A) Subject characteristics, peak IFN-γ levels, and tissues assayed by TCRseq are indicated. B and C) TCRβ clonotype frequency plots are depicted from the tumor biopsy (B) and PBMCs (C) of subject 58, before and day 35 after treatment with NHS-IL12. Clones remaining stable in abundance are found on the X=Y diagonal, while those that increase or decrease following treatment are found above or below the diagonal, respectively. D) TCR diversity, measured by the metric of repertoire size, in the biopsy of subjects before and after NHS-IL12. Values indicate the number of individual clonotypes comprising the top 25th percentile by ranked molecule count after sorting by abundance. E) Overall TIL density calculated from TCRseq data using the formula: TIL density = (# Productive Templates) / (DNA input (pg) / 6.6). This formula is based on the human genome weighing 6.6 pg/cell.
We next investigated whether any unique clones expanded in the tumor and periphery after NHS-IL12 therapy. Up to 6 of the top 10 clones that increased the most in a subject’s biopsy also increased in PBMCs (Table 3A); moreover, as many as 5 of the top 10 clones that increased the most in a subject’s PBMCs also increased in the biopsy, but often to a lesser extent (Table 3B). TIL density (see Methods) also increased 1.3- to 8.6-fold in subjects with a high or intermediate IFN-γ response, but decreased in subjects with a low IFN-γ response (Figure 3E).
Table 3.
Degree of overlap of expanded clones in the biopsy and PBMCs of 3 subjects post– vs. pre–NHS-IL12 treatment
| A | ||||||||
|---|---|---|---|---|---|---|---|---|
| PT58:117 clones with >2 fold increase in Biopsy | PT51: 1,458 clones with >2 fold increase in Biopsy | PT59:1,831 clones with >2 fold increase in Biopsy | ||||||
| Clone | Fold Change in Biopsy | Fold Change in PBMC | Clone | Fold Change in Biopsy | Fold Change in PBMC | Clone | Fold Change in Biopsy | Fold Change in PBMC |
| 1 | 36.1 | 4.2 | 1 | 162.6 | 0.8 | 1 | 135.2 | 2.0 |
| 2 | 17.1 | 0.0 | 2 | 67.2 | 0.0 | 2 | 90.1 | 95.9 |
| 3 | 10.9 | 2.4 | 3 | 49.5 | 0.8 | 3 | 90.1 | 0.0 |
| 4 | 10.6 | 2.7 | 4 | 47.7 | 0.0 | 4 | 67.6 | 0.0 |
| 5 | 10.3 | 4.9 | 5 | 44.2 | 19.2 | 5 | 67.6 | 0.0 |
| 6 | 8.8 | 0.7 | 6 | 44.2 | 10.0 | 6 | 60.1 | 1.4 |
| 7 | 8.7 | 3.6 | 7 | 44.2 | 0.8 | 7 | 52.6 | 1.4 |
| 8 | 8.1 | 1.8 | 8 | 38.9 | 0.0 | 8 | 45.1 | 0.0 |
| 9 | 7.8 | 0.6 | 9 | 33.6 | 0.0 | 9 | 45.1 | 0.0 |
| 10 | 7.6 | 2.2 | 10 | 31.8 | 0.0 | 10 | 37.6 | 1480.0 |
| B | ||||||||
|---|---|---|---|---|---|---|---|---|
| PT58:1,936 clones with >2 fold increase in PBMC | PT51: 2,723 clones with >2 fold increase in PBMC | PT59:16,581 clones with >2 fold increase in PBMC | ||||||
| Clone | Fold Change in Biopsy | Fold Change in PBMC | Clone | Fold Change in Biopsy | Fold Change in PBMC | Clone | Fold Change in Biopsy | Fold Change in PBMC |
| 1 | 0.7 | 84.8 | 1 | 30.0 | 64.4 | 1 | 37.6 | 1480.0 |
| 2 | 0.6 | 79.5 | 2 | 0.0 | 41.0 | 2 | 15.0 | 536.0 |
| 3 | 0.7 | 60.5 | 3 | 0.0 | 36.8 | 3 | 30.0 | 387.7 |
| 4 | 1.9 | 59.9 | 4 | 5.3 | 26.8 | 4 | 22.5 | 348.9 |
| 5 | 0.4 | 57.5 | 5 | 0.5 | 25.9 | 5 | 0.0 | 314.2 |
| 6 | 0.9 | 54.0 | 6 | 1.5 | 24.7 | 6 | 0.0 | 300.6 |
| 7 | 0.2 | 54.0 | 7 | 3.5 | 21.9 | 7 | 0.0 | 281.6 |
| 8 | 1.0 | 48.0 | 8 | 44.2 | 19.2 | 8 | 0.0 | 262.5 |
| 9 | 0.1 | 44.5 | 9 | 1.8 | 18.4 | 9 | 0.0 | 257.1 |
| 10 | 1.0 | 38.6 | 10 | 10.6 | 17.6 | 10 | 0.0 | 186.4 |
The number of clones increased >2-fold after treatment in each subject’s biopsy is indicated. Values represent the fold change of the top 10 expanded clones in each subject’s biopsy, and the fold change of these clones in each subject’s peripheral blood mononuclear cells (PBMCs).
The number of clones increased >2-fold after treatment in each subject’s PBMCs is indicated. Values represent the fold change of the top 10 expanded clones in each subject’s PBMCs, and the fold change of these clones in each subject’s biopsy.
Discussion
PD data from this trial (Figure 1A) demonstrated a time-dependent rise in IFN-γ after treatment and an associated rise in IL-10. Despite a similar rise in serum IL-12, most multiple-dose subjects had a diminished rise in IFN-γ and IL-10 on the second dose. This observation is consistent with the finding that the second and subsequent doses of NHS-IL12 were generally better tolerated and had decreased toxicity compared with the first dose (Supplementary Table 3). These data also support the hypothesis that the frequency of NHS-IL12 may feasibly be increased to every 2 weeks with minimal risk for dose stacking and added toxicities. Based on these data, a 2-week dosing schedule is currently being evaluated. Although we have not seen responses with this agent at the doses and frequencies tested so far, more frequent dosing may lead to greater efficacy.
This therapy was evaluated in subjects with a wide array of locally advanced or metastatic cancers, many of which were refractory to multiple standard therapies. In addition, while NHS-IL12’s antitumor activity may be modest as a monotherapy, a great deal of preclinical data suggest that its combination with other treatment modalities, including radiation, chemotherapy, or other immunotherapies, may improve antitumor responses (13, 15, 19). For example, the combination of NHS-IL12 with localized fractionated radiotherapy, sunitinib, or gemcitabine showed additive tumor growth inhibition relative to these agents as monotherapies (13, 20). The combination of NHS-IL12 and avelumab has also been shown to enhance antitumor efficacy more than either therapy alone in multiple murine tumor models (21). Antitumor efficacy correlated with higher frequency of tumor antigen-specific splenic CD8+ T cells and enhanced T-cell activation over a wide range of NHS-IL12 concentrations. Based on these data, NHS-IL12 plus avelumab is now being evaluated (NCT02994953), and a number of clinical trials are planned to evaluate NHS-IL12 in combination with other therapies. Notably, the potential for combination tumor-directed IL-12 therapy plus checkpoint inhibitor therapy over checkpoint inhibitor therapy alone was recently demonstrated in KEYNOTE 695, a phase II trial evaluating intratumoral plasmid IL-12 injection with electroporation in combination with pembrolizumab in patients with advanced melanoma. In this study, 11/22 patients (50%) who were deemed unlikely to respond to checkpoint inhibition, based upon baseline biomarker data, had an objective response and 3/9 patients (33%) who had progressed on prior checkpoint inhibitor therapy developed objective responses. Since NHS-IL12 is an immunocytokine, one would expect to see changes in the peripheral immunome soon after treatment. The earliest that PBMCs were available for evaluation was 1 week after NHS-IL12 infusion, at which time there were increased levels of activated (Tim3+) and mature (CD16+ CD56dim) NK cells, as well as PD-1+ NKT cells. These changes are expected, since it is well known that IL-12 increases both proliferation and lytic capacity of NK cells (1). Levels of terminally differentiated CD4+ T cells and plasmacytoid DCs decreased. Similar changes were also observed 1 week after the second infusion (data not shown). In contrast, only NKT cells were still increased 2 months after treatment. Interestingly, NKT cells have a dual role in tumor progression and treatment, and when they are stimulated by self-antigens in the presence of IL-12, they are among the first lymphocytes to become activated to promote antitumor responses by producing IFN-γ and by stimulating IL-12 production from myeloid DCs (22).
Sequencing of TCR CDR3 regions is a valuable technique for evaluating T-cell clonal representation in both tumors and peripheral blood. We performed TCRseq on tumor biopsies and matching PBMCs, where available, from 4 subjects with varying systemic IFN-γ responses in the dose level 8 expansion cohort. Although only a very small number of subjects were assayed, the results demonstrate that those subjects with a high/medium IFN-γ response to NHS-IL12 had an increase in tumor-infiltrating lymphocyte density and TCR diversity within the tumor. This broadening of TCR diversity within the tumor suggests that NHS-IL12 may facilitate trafficking of T cells into the tumor, is consistent with other immunotherapy studies, and does not conflict with a concurrent focusing of an underlying antitumor immune response (23, 24). Comparison of TCRseq data from the biopsy and peripheral blood showed that some clones increased in both.
Conclusion
NHS-IL12 proved to be generally well tolerated, and preclinical data suggest its potential to improve antitumor responses when given with other standard treatments and immunotherapies. The next step will be to evaluate NHS-IL12 in combination therapy. Because NHS-IL12 can increase immune infiltration within the tumor microenvironment, it may also prime otherwise nonimmunogenic tumors to checkpoint inhibition and increase the spectrum of cancers responding to immunotherapy. Given this potential, multiple clinical studies are evaluating the combination of NHS-IL12 and checkpoint inhibition.
Supplementary Material
Statement of Translational Relevance.
Interleukin-12 (IL-12) is a proinflammatory cytokine that activates natural killer, NKT, and CD8+ T cells, drives Th1 pathway differentiation, enhances antigen presentation and cell-mediated immunity. Therefore, administration of IL-12 has the potential to promote effective antitumor immune responses. However, older systemic forms of recombinant (r)IL-12 have had a narrow therapeutic window limiting its ability to induce objective responses. NHS-IL12 is an immunocytokine composed of two IL-12 heterodimers fused to the NHS76 antibody which targets IL-12 to regions of tumor necrosis and has the potential to result in enhanced antitumor activity and decreased systemic toxicity. In this phase I trial we observed NHS-IL12 to be well tolerated and to result in enhanced immune-related activity including evidence of increased immune infiltration within the tumor microenvironment. Based on these observations, NHS-IL12 has the potential to prime otherwise nonimmunogenic tumors to checkpoint inhibition and increase the spectrum of cancers responding to immunotherapy.
Acknowledgments
The authors are indebted to the subjects who donated their tissue, blood, and time and to the clinical teams who facilitated subject informed consent, as well as sample and data acquisition. The authors thank Debra Weingarten for her assistance in the preparation of this manuscript.
Funding
This research was sponsored and supported by the Intramural Research Program of the Center for Cancer Research, National Cancer Institute, NIH. EMD Serono supplied NHS-IL12 under a Cooperative Research and Development Agreement (CRADA) with the NCI.
Footnotes
Disclosure of Potential Conflicts of interest
C.R. Heery is an employee of Bavarian Nordic. No potential conflicts of interest were disclosed by the NIH authors.
References
- 1.Aste-Amezaga M, D’Andrea A, Kubin M, Trinchieri G. Cooperation of natural killer cell stimulatory factor/interleukin-12 with other stimuli in the induction of cytokines and cytotoxic cell-associated molecules in human T and NK cells. Cell Immunol 1994;156:480–92. [DOI] [PubMed] [Google Scholar]
- 2.van Herpen CM, van der Voort R, van der Laak JA, Klasen IS, de Graaf AO, van Kempen LC, et al. Intratumoral rhIL-12 administration in head and neck squamous cell carcinoma patients induces B cell activation. Int J Cancer 2008;123:2354–61. [DOI] [PubMed] [Google Scholar]
- 3.Grohmann U, Belladonna ML, Bianchi R, Orabona C, Ayroldi E, Fioretti MC, et al. IL-12 acts directly on DC to promote nuclear localization of NF-kappaB and primes DC for IL-12 production. Immunity 1998;9:315–23. [DOI] [PubMed] [Google Scholar]
- 4.Del Vecchio M, Bajetta E, Canova S, Lotze MT, Wesa A, Parmiani G, et al. Interleukin-12: biological properties and clinical application. Clin Cancer Res 2007;13:4677–85. [DOI] [PubMed] [Google Scholar]
- 5.Lacy MQ, Jacobus S, Blood EA, Kay NE, Rajkumar SV, Greipp PR. Phase II study of interleukin-12 for treatment of plateau phase multiple myeloma (E1A96): a trial of the Eastern Cooperative Oncology Group. Leuk Res 2009;33:1485–9. [DOI] [PMC free article] [PubMed] [Google Scholar]
- 6.Sangro B, Mazzolini G, Ruiz J, Herraiz M, Quiroga J, Herrero I, et al. Phase I trial of intratumoral injection of an adenovirus encoding interleukin-12 for advanced digestive tumors. J Clin Oncol 2004;22:1389–97. [DOI] [PubMed] [Google Scholar]
- 7.Coughlin CM, Wysocka M, Trinchieri G, Lee WM. The effect of interleukin 12 desensitization on the antitumor efficacy of recombinant interleukin 12. Cancer Res 1997;57:2460–7. [PubMed] [Google Scholar]
- 8.Gollob JA, Mier JW, Veenstra K, McDermott DF, Clancy D, Clancy M, et al. Phase I trial of twice-weekly intravenous interleukin 12 in patients with metastatic renal cell cancer or malignant melanoma: ability to maintain IFN-gamma induction is associated with clinical response. Clin Cancer Res 2000;6:1678–92. [PubMed] [Google Scholar]
- 9.Mortarini R, Borri A, Tragni G, Bersani I, Vegetti C, Bajetta E, et al. Peripheral burst of tumor-specific cytotoxic T lymphocytes and infiltration of metastatic lesions by memory CD8+ T cells in melanoma patients receiving interleukin 12. Cancer Res 2000;60:3559–68. [PubMed] [Google Scholar]
- 10.Rook AH, Wood GS, Yoo EK, Elenitsas R, Kao DM, Sherman ML, et al. Interleukin-12 therapy of cutaneous T-cell lymphoma induces lesion regression and cytotoxic T-cell responses. Blood 1999;94:902–8. [PubMed] [Google Scholar]
- 11.Younes A, Pro B, Robertson MJ, Flinn IW, Romaguera JE, Hagemeister F, et al. Phase II clinical trial of interleukin-12 in patients with relapsed and refractory non-Hodgkin’s lymphoma and Hodgkin’s disease. Clin Cancer Res 2004;10:5432–8. [DOI] [PubMed] [Google Scholar]
- 12.Little RF, Pluda JM, Wyvill KM, Rodriguez-Chavez IR, Tosato G, Catanzaro AT, et al. Activity of subcutaneous interleukin-12 in AIDS-related Kaposi sarcoma. Blood 2006;107:4650–7. [DOI] [PMC free article] [PubMed] [Google Scholar]
- 13.Fallon J, Tighe R, Kradjian G, Guzman W, Bernhardt A, Neuteboom B, et al. The immunocytokine NHS-IL12 as a potential cancer therapeutic. Oncotarget 2014;5:1869–84. [DOI] [PMC free article] [PubMed] [Google Scholar]
- 14.Paoloni M, Mazcko C, Selting K, Lana S, Barber L, Phillips J, et al. Defining the Pharmacodynamic Profile and Therapeutic Index of NHS-IL12 Immunocytokine in Dogs with Malignant Melanoma. PLoS One 2015;10:e0129954. [DOI] [PMC free article] [PubMed] [Google Scholar]
- 15.Xu C, Zhang Y, Rolfe PA, Hernandez VM, Guzman W, Kradjian G, et al. Combination Therapy with NHS-muIL12 and Avelumab (anti-PD-L1) Enhances Antitumor Efficacy in Preclinical Cancer Models. Clin Cancer Res 2017;23:5869–80. [DOI] [PubMed] [Google Scholar]
- 16.Donahue RN, Lepone LM, Grenga I, Jochems C, Fantini M, Madan RA, et al. Analyses of the peripheral immunome following multiple administrations of avelumab, a human IgG1 anti-PD-L1 monoclonal antibody. J Immunother Cancer 2017;5:20. [DOI] [PMC free article] [PubMed] [Google Scholar]
- 17.Idorn M, Kollgaard T, Kongsted P, Sengelov L, Thor Straten P. Correlation between frequencies of blood monocytic myeloid-derived suppressor cells, regulatory T cells and negative prognostic markers in patients with castration-resistant metastatic prostate cancer. Cancer Immunol Immunother 2014;63:1177–87. [DOI] [PMC free article] [PubMed] [Google Scholar]
- 18.Sgadari C, Angiolillo AL, Tosato G. Inhibition of angiogenesis by interleukin-12 is mediated by the interferon-inducible protein 10. Blood 1996;87:3877–82. [PubMed] [Google Scholar]
- 19.Lee P, Wang F, Kuniyoshi J, Rubio V, Stuges T, Groshen S, et al. Effects of interleukin-12 on the immune response to a multipeptide vaccine for resected metastatic melanoma. J Clin Oncol 2001;19:3836–47. [DOI] [PubMed] [Google Scholar]
- 20.Eckert F, Schmitt J, Zips D, Krueger MA, Pichler BJ, Gillies SD, et al. Enhanced binding of necrosis-targeting immunocytokine NHS-IL12 after local tumour irradiation in murine xenograft models. Cancer Immunol Immunother 2016;65:1003–13. [DOI] [PMC free article] [PubMed] [Google Scholar]
- 21.Fallon JK, Vandeveer AJ, Schlom J, Greiner JW. Enhanced antitumor effects by combining an IL-12/anti-DNA fusion protein with avelumab, an anti-PD-L1 antibody. Oncotarget 2017;8:20558–71. [DOI] [PMC free article] [PubMed] [Google Scholar]
- 22.Gumperz JE. CD1d-restricted “NKT” cells and myeloid IL-12 production: an immunological crossroads leading to promotion or suppression of effective anti-tumor immune responses? J Leukoc Biol 2004;76:307–13. [DOI] [PubMed] [Google Scholar]
- 23.Sheikh N, Cham J, Zhang L, DeVries T, Letarte S, Pufnock J, et al. Clonotypic Diversification of Intratumoral T Cells Following Sipuleucel-T Treatment in Prostate Cancer Subjects. Cancer Res 2016;76:3711–8. [DOI] [PMC free article] [PubMed] [Google Scholar]
- 24.Cha E, Fong L. Shuffling the deck with CTLA-4 therapy: Deep sequencing of rearranged TCRB genes demonstrates T cell repertoire remodeling in cancer patients. OncoImmunology 2018;7:4. [DOI] [PMC free article] [PubMed] [Google Scholar]
Associated Data
This section collects any data citations, data availability statements, or supplementary materials included in this article.