

SUMMARY
The oral mucosa is one of the most rapidly dividing tissues in the body and serves as a barrier to physical and chemical insults from mastication, food, and microorganisms. Breakdown of this barrier can lead to significant morbidity and potentially life-threatening infections for patients. Determining the identity and organization of oral epithelial progenitor cells (OEPCs) is therefore paramount to understanding their roles in homeostasis and disease. Using lineage tracing and label retention experiments, we show that rapidly-dividing OEPCs are located broadly within the basal layer of the mucosa throughout the oral cavity. Quantitative clonal analysis demonstrated that OEPCs undergo population asymmetrical divisions following neutral drift dynamics and that they respond to chemotherapyinduced damage by altering daughter cell fates. Finally, using single cell RNAseq, we establish the basal layer population structure and propose a model that defines the organization of cells within the basal layer.
Keywords: oral epithelium, tongue, stem cell, Bmi1, single cell RNA-seq
In Brief
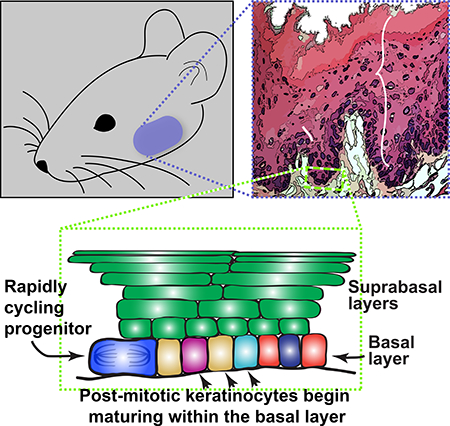
Jones et al. define the organization, cycling kinetics, and clonal dynamics of oral mucosal progenitor cells. They also show via single-cell RNA sequencing that the basal layer contains progenitor and post-mitotic cells at various stages of maturation, demonstrating basal layer heterogeneity and providing insights into localization of cell fate decisions.
Graphical Abstract
INTRODUCTION
For several decades, the epidermal proliferative unit (EPU) hypothesis, also known as the invariant asymmetry model, was used to describe the organization of stem cells within the epidermis and oral mucosa. In this model, single stem cells within the basal layer divide slowly and asymmetrically, always resulting in a stem cell and a daughter transit amplifying (TA) cell, which remain closely associated with one another and are organized in stem cell/TA territories, or progenitor units (Mackenzie, 1997; Potten, 1974). More recently, studies in several epithelial tissues such as the epidermis and esophagus support the alternative population asymmetry model, in which the basal layer consists of a single pool of progenitor cells along with post-mitotic cells fated for differentiation (Figure S1a,b; Clayton et al., 2007; Doupe et al., 2012). Although prior work in the tongue epithelium supported the invariant asymmetry model, based in part on the suggestion that solitary stem cells express high levels of Bmi1 within the dorsal tongue epithelium (Tanaka et al., 2013), quantitative clonal analysis to confirm this finding has not yet been performed. In this study, we sought to identify and characterize OEPCs in all oral mucosal sites, determine how they are organized, study the effects that aging and cytotoxic damage have on their behavior, and resolve which model – invariant asymmetry or population asymmetry – best explains their division kinetics and clonal growth patterns.
RESULTS
Bmi1 Labels Basal Oral Epithelial Cells, Including Oral Epithelial Progenitors
A prior study in keratinocytes within the dorsal tongue epithelium using in situ hybridization (ISH) and lineage tracing techniques reported that Bmi1 is highly expressed by rare, solitary stem cells primarily in the suprabasal layer (Tanaka et al., 2013). Therefore, we initially set out to determine if Bmi1 labeled rare OEPCs at other oral mucosal sites by using RNAscope, a sensitive and specific ISH method. Surprisingly, we found that Bmi1 was expressed at low levels in almost all basal and some suprabasal layer keratinocytes at various oral mucosal sites, including the dorsal tongue (Figures 1a-b and S1d-i). We next used Bmi1CreER;R26tdTomato mice to verify that Bmi1-expressing keratinocytes were located primarily within the basal layer and to determine if Bmi1 also labeled OEPCs. Following a single dose of tamoxifen and 24-hour chase, labeled keratinocytes were found almost exclusively in the basal layer throughout the oral mucosa (Figure 1c), confirming our Bmi1 ISH assay. Furthermore, in contrast to the previous report of solitary Bmi1-expressing keratinocytes within the tongue (Tanaka et al., 2013), multiple Bmi1-expressing keratinocytes were identified, often in close proximity to one another (Figure 1c). Labeling throughout the oral mucosa persisted for up to 13 months, confirming that at least some of the Bmi1expressing cells were long-lived OEPCs. Immunofluorescence showed BMI1 protein expression in most basal (90.4% of cells, standard deviation 4.1%) and many suprabasal layer cells (Figure 1d). We also induced other CreER mouse lines driven by Krt14, Gli1, Sox2, and Lrig1 and found that, similar to Bmi1, these drivers labeled OEPCs in the basal layer and showed labeling that persisted for at least 3 to 6 months (Figure S3a-f). These findings strongly suggest that OEPCs are located within the basal layer of the oral mucosa, and not in the suprabasal layer, as had been previously proposed (Tanaka et al., 2013). Additionally, in contrast to other tissues, Bmi1 does not appear to be a specific marker of progenitors in the oral mucosa given its broad expression in most basal layer cells.
Figure 1.

Bmi1 labels progenitor cells within the rapidly dividing basal layer of the oral mucosa. (a,b) Bmi1 RNAscope in situ hybridization experiments (individual transcripts are represented by red dots). (c) Bmi1CreER;R26tdTomato mice following administration of a single low dose of tamoxifen. Dashed white line represents epithelial/connective tissue interface. (d) BMI1 protein expression. (e) Various oral mucosal sites in mice injected with BrdU and euthanized 1.5 hours, 4 days or 28 days later. Scale bars, 30μm.
Oral Mucosal Basal Layer Cells Actively Proliferate, Leading to Rapid Tissue Turnover
We next determined the division kinetics of basal layer keratinocytes by injecting wild-type mice with BrdU and euthanizing them at various time points (Figure 1e). 1.5 hours post-injection, BrdU-labeled keratinocytes were detected predominantly in the basal layer, confirming this layer as the primary site of cell division within the oral mucosa. By day 4, BrdU-labeled keratinocytes were present in the stratum corneum, consistent with rapid turnover of the oral mucosa. By day 28, only a few rare cells with BrdU label remained in the tissue, indicating that those basal layer keratinocytes that were labeled one month prior had divided multiple times and/or left the basal layer (Figure S1c). In light of the similar rates of turnover in the various regions of the oral mucosa (Figure 1e), we focused our analysis on the buccal epithelium, which provides a large expanse of tissue. Consistent with the rapid loss of BrdU, approximately 95% of basal layer keratinocytes in the buccal mucosal epithelium of wild-type mice expressed Ki67, a marker of proliferating cells that is also retained in newly post-mitotic cells. These data are consistent with the notion that many basal layer cells are proliferating, and that post-mitotic cells do not remain in the basal layer for more than a few days after cell cycle exit (Figures 2a,b; S1k-m; Mendeley Figure S1a-S1b).
Figure 2.

The buccal mucosa does not contain label retaining cells and exhibits rapid cell division rates. (a,b) Ki-67 protein expression using whole-mount imaging in 10-week-old C57BL/6 mice. CD45+ immune cells were excluded from the analysis. Scale bars, 30μm. (c) Whole-mount imaging of buccal epithelium from K5tTa; tetO-H2B-EGFP mice following administration of doxycycline to shut off H2B-EGFP expression using the same imaging parameters for each sample. (d) Optimized imaging parameters to maximize the detectable EGFP signal within the same samples from (c). Scale bars, 30μm. (e,f) Temporally spaced pulses of EdU and BrdU for calculation of average S-phase and total cell cycle times. Keratinocytes that exit S-phase prior to euthanasia will only label with EdU (pink arrow heads), whereas keratinocytes still within S-phase will be labeled with both EdU and BrdU (white arrow heads); see Methods for further details. Scale bar, 30μm. (g,h) The total relative fluorescence of individual keratinocytes from the samples imaged in (c) were measured and the fluorescence decay rates calculated. Bar graphs represent average cell fluorescence values ± SD at each chase time point (g) and the overall average decay rate ± SD (h). (i) Wholemount imaging of buccal epithelium after a 48-hour pulse with BrdU followed by a three-hour pulse with EdU shows BrdU/EdU dual labeled keratinocytes (white arrowheads) along with keratinocytes that are labeled with only BrdU (green arrowheads) or EdU (red arrowheads). Scale bars, 10μm. SD, standard deviation.
Label Retaining Cells Are Not Present Within the Basal Layer of the Oral Mucosa
Classically, label retention was considered a hallmark of adult stem cells, and Bmi1-positive keratinocytes in the dorsal tongue epithelium have been reported to be slow cycling (Tanaka et al., 2013). However, it is now clear that many adult stem cell populations are proliferative as opposed to quiescent (Doupe et al., 2012; Li and Clevers, 2010). We therefore assessed whether label-retaining cells (LRCs) reside in the buccal mucosal epithelium using the K5tTa;tetO-H2B-EGFP system (Tumbar et al., 2004). Mice were euthanized at various time points following doxycycline treatment, and using the same imaging parameters for each sample we found a near complete loss of EGFP signal by day 21 in the buccal mucosa (Figure 2c). When imaging parameters were optimized to detect EGFP, extremely rare EGFP-positive keratinocytes were present at the 6-week and 3-month chases (Figure 2d). These cells were not arranged in any regular pattern, in contrast to what would be expected with the EPU hypothesis (Figure S1a). Furthermore, the fluorescence intensity for these cells fell below the 1st percentile values measured in baseline keratinocytes (i.e. no doxycycline treatment), indicating that they had divided multiple times and were not true LRCs (Table S1). Consistent with the BrdU and Ki-67 data, these results indicate that OEPCs rapidly proliferate and that post-mitotic cells within the basal layer remain there for only a brief period.
Division Kinetics of Oral Mucosal Basal Layer Cells
To analyze the division kinetics further, we used dual BrdU/EdU labeling (Martynoga et al., 2005) to calculate the average lengths of the S-phase and cell cycle in basal layer keratinocytes, which were 2.5 and 49 hours, respectively (Figures 2e,f and S2a-c); S-phase lengths as brief as 1.8 hours have been reported in mammalian cells (Arai et al., 2011). To measure the average doubling time of OEPCs within the basal layer, we calculated fluorescence decay rates between the baseline, 3-day, and 7-day K5tTa;tetO-H2B-EGFP samples (Figures 2g,h and S2d). The average decay rate correlated with a doubling time of approximately 45 hours, similar to the cell cycle length of 49 hours. To confirm this, wild-type mice were injected with BrdU at baseline, with EdU at 48 hours, and then euthanized 3 hours later (Figure 2i). Approximately 20% of cells (standard deviation 2.5%, n=447 cells) in the buccal mucosal epithelium showed dual staining for both BrdU and EdU, confirming their reentry into the cell cycle within 48 hours. These findings indicate that proliferating basal layer keratinocytes continually and rapidly enter the cell cycle, on average about once every 2 days. This rapid turnover results in a lack of LRCs, arguing against the invariant asymmetry model.
Oral Epithelial Progenitor Cells Undergo Population Asymmetric Self-Renewal with Neutral Drift Dynamics
We next used quantitative clonal analysis to determine if OEPCs divided via invariant or population asymmetry. 3 month old Bmi1CreER;R26tdTomato mice were injected with low-dose tamoxifen to induce sparse single cell labeling and clones analyzed at various time points via whole-mount imaging (Figures 3a-h, S3g, and Mendeley Figure S1c). The number of labeled clones as well as the total number of labeled basal layer keratinocytes within each clone were quantified. We found that the overall number of clones in both the buccal and dorsal tongue epithelia decreased over time, while the number of labeled basal layer keratinocytes within surviving clones increased linearly with time, consistent with the population asymmetry model (Figure S1b). Further, a quantitative fit to a model of neutral drift previously used to model epidermal keratinocytes (Clayton et al., 2007; Klein et al., 2007) predicted that half of the cells in the basal layer were dividing and the other half post-mitotic, with a short residence time comparable in duration to the cell cycle of OEPCs (see Methods).
Figure 3.

Bmi1-labeled OEPCs in the buccal mucosa and dorsal tongue divide via population asymmetry with neutral drift dynamics. (a) 2–3 month old Bmi1CreER;R26tdTomato mice were given a single dose of tamoxifen and chased up to 14 months. (b,c) Whole-mount imaging of buccal mucosal epithelial sheets; the number of clones containing at least one labeled basal layer keratinocyte were quantified along with the number of labeled basal layer keratinocytes present within each clone. Scale bars, 20μm. (d,e) As predicted by the population asymmetry model with neutral drift dynamics, the number of labeled basal layer keratinocytes per clone increased over time (d, 1.7 cells/week ± 0.08 SE) while the overall number of clones decreased (e, 0.22 clones/tile/week ± 0.03 SE). Data points represent mean values ± SD. Solid curves show neutral drift predictions of linear growth of the average (d) and inverse-linear decay of the labeling density (e). (f) Similar clonal labeling patterns were observed in the dorsal tongue epithelium of Bmi1CreER;R26tdTomato mice. Many clones at early chase time points were associated with up to three dorsal tongue papillae (numbered 1–3) while at later time points they were associated with as many as 5 papillae (numbered 1–5). Scale bars, 20μm. (g,h) Dorsal tongue clone size (g, increase of 2.8 cells/week ± 0.20 SE) and clone survival patterns over time (h, loss of 0.03 clones/tile/week ± 0.0009 SE) were similar to those found in the buccal mucosa. Data points represent mean values ± SD. Solid curves show neutral drift predictions for growth within clones and clone survival over time. (i) Clonal analysis of the buccal mucosa from 15 month old Bmi1CreER;R26tdTomato mice showed similar clonal growth patterns over time as seen in the 2–3 month old mice; however, the OEPC competition rate in the older mice was halved compared with the younger mice (increase of 0.85 cells/week ± 0.06 SE vs. 1.7 cells/week ± 0.08 SE). Data points represent mean values ± SD. Solid lines represent the neutral drift predictions for clonal growth. (j, k) Whole-mount imaging of buccal mucosa revealed that old mice had significantly fewer Ki-67+ cells (Wilcoxon rank-sum test, p<0.00001). Bar graphs represent the average percent of basal layer keratinocytes that were Ki-67 positive ± SD. Scale bars, 30μm. OEPC, oral epithelial progenitor cell; SE, standard error; SD, standard deviation.
Aged Oral Epithelial Progenitor Cells Show Decreased Proliferative Capacity
Damaged oral mucosa regenerates more rapidly in younger versus older individuals (Engeland et al., 2006). To understand what role OEPCs might have in this process, we performed quantitative clonal analysis in the buccal mucosa of 15 to 19 month old Bmi1CreER;R26tdTomato mice (Figure S3h-j). Interestingly, while we found clonal labeling patterns similar to those in younger mice, the older mice showed an approximately 50% reduction in the average number of labeled basal layer keratinocytes per clone (although this was not statistically significant; p=0.24, Figure 3i). Further, in the buccal epithelium of 18–19 month old mice only 63% of basal layer keratinocytes expressed Ki-67, compared with 95% in younger mice (p<0.00001, Figures 3j,k and S3k). These results indicate that, as mice age, the fraction of OEPCs within the basal layer and/or their proliferative capacity decreases, which could explain why oral mucosal damage in older human patients takes longer to heal, analogous to age-related changes seen in other tissues (Keyes et al., 2013).
5-Fluorouracil Induced Cytotoxic Damage Causes Oral Epithelial Progenitor Cells to Alter Their Daughter Cell Fates
With an understanding of how OEPCs behave under normal steady state conditions, we next addressed their response to cytotoxic damage. We injected mice with 5-fluorouracil (5FU), a pyrimidine analogue used to treat cancer that induces oral mucositis in humans and acts primarily by inhibiting thymidylate synthase, leading to cell cycle arrest and/or apoptosis (Mustafa Baydar, 2005). Bmi1CreER;R26tdTomato mice were first injected with tamoxifen to label OEPCs, treated with either saline or 5FU once daily for 3 consecutive days, and clones analyzed at various time points (Figure 4a). Within the buccal mucosa, at 1 day post-5FU we detected a significant decrease in basal layer cell density (p=0.0002) and mitotic activity (p=0.03; Figure 4c,d) as well as an increase in p53 protein levels over several days, confirming that 5FU had damaged basal layer cells (Figure S4a). Surprisingly, basal layer keratinocytes never switched to a hyper-proliferative state following 5FU-induced damage, but instead slowly returned to normal mitotic activity between 14 and 21 days after treatment (Figure 4d). Despite their slow mitotic recovery, by 3 days post-5FU, treated mice showed significantly larger average clone sizes compared with controls, which persisted through day 21 of the experiment (p<0.001; Figure 4e,f).
Figure 4.

5FU has long-lasting effects on buccal mucosal OEPCs, and scRNAseq reveals the population structure of the basal layer. (a) 5FU treatment scheme. (b,c) 5FU caused a significant decrease in basal layer nuclear density within the buccal mucosa of treated mice (Wilcoxon rank-sum test, p=0.0002). Bar graphs represent the average number of nuclei per 100μm2 ± SD in mice treated with saline or 5FU following a 1 day chase. Scale bars, 20μm. (d) Average number of mitotic figures following treatment with 5FU. Bar graphs represent the average number of mitotic figures per area imaged ± SD (1 day: p=0.03; 3 days: p=0.01; 7 days: p=0.01; 14 days: p=0.04; 21 days: not significant). (e) 3 days after the last dose of 5FU, treated mice showed a significant expansion in clone size distribution (Chi-Square test, p<0.001). (f) Overall average clone sizes ± SD in mice treated with 5FU are larger. The competition rate of basal layer progenitor cells in 5FU treated mice is approximately double (increase of 1.01 cells/week ± 0.12 SE vs. 0.47 cells/week ± 0.08 SE, respectively). Multivariable linear regression analysis showed that both the treatment type (control vs. 5FU, p<0.001) and time post-treatment (p<0.001) correlated strongly with clone size and together accounted for 80% (R2=0.80) of the variance observed in the clone size distribution. Solid lines represent the neutral drift predictions for clonal growth. (g) 5FU treated mice show a significant decrease in the percentage of labeled suprabasal layer keratinocytes. Bar graphs represent the percentage of labeled basal and suprabasal layer keratinocytes at 1 and 3 days post-5FU treatment (error bars represent the 95% confidence interval; Fisher’s exact test, p<0.001). (h) scRNAseq analysis of sorted oral epithelial basal layer cells, shown using a SPRING plot visualization, with clusters indicated. (i) mRNA expression levels for selected genes associated with keratinocyte differentiation within each of the clusters. (j) Proposed model depicting keratinocyte cell states present within the basal cell layer of the buccal mucosa. (k) scRNAseq SPRING plots overlaid with Krt14 and Krtdap gene expression (greatest area of overlap circled in red). (l) Basal layer keratinocytes at various stages of maturation show a continuum of dual Krtdap and Krt14 co-expression, exemplified by cells that are Krtdaphigh/Krt14low, Krtdapmoderate/Krt14moderate, and Krtdaplow/Krt14high (see figure insets). Dashed line represents basement membrane; scale bars, 20μm. (m) Positively correlated gene modules identified in OEPCs (clusters 1–2). (n) scRNAseq SPRING plots overlaid with Ki-67, Mcm2, and Gmnn gene expression. OEPC, oral epithelial progenitor cell; SD, standard deviation; SE, standard error.
We next addressed the seemingly paradoxical observation that 5FU-treated mice had a decreased mitotic index yet still produced clones with increased numbers of labeled basal layer keratinocytes. One potential scenario consistent with this observation would be that 5FU damage caused OEPCs to preferentially selfre-new and replace damaged basal layer keratinocytes instead of creating daughter cells fated for differentiation. To test this, we measured the percentage of labeled basal and suprabasal keratinocytes in control and 5FU-treated mice and found that, by 3 days post-5FU, treated mice had significantly fewer labeled suprabasal cells (p<0.001, Figure 4g). 5FU-treated mice also exhibited a small but significant increase in the number of parallel oriented mitotic figures (i.e. both daughter cells remained in the basal layer) (p=0.01, Figure S4b-d). These results demonstrate that OEPCs compensate for tissue damage within the basal layer by altering their daughter cell fates.
Single Cell RNAseq Establishes the Population Structure of Oral Epithelial Basal Layer Cells
Finally, we used an unbiased single cell RNAseq (scRNAseq) approach to determine the overall diversity of cells residing within the oral mucosal basal layer and to infer lineage relationships. We sorted buccal mucosal basal layer keratinocytes (in two technical replicates) and following data filtering identified 16,572 cells, which formed a continuum of cell states that we partitioned into 8 distinct cell clusters, which were visualized using SPRING (Weinreb et al., 2017). To explore the phenotype of each cluster, we performed a gene enrichment analysis with emphasis on transcription factors (Tables S2, S3 and Figure S4e-j). We found that clusters 1 and 2 represented OEPCs (enriched for basal/progenitor markers), cluster 3 represented cells in G1/S or G2/M (enriched for cell cycle genes), and cells from clusters 4–8 were at various stages of differentiation (enriched for keratinocyte differentiation markers; Figure 4h).
Cluster 1 comprised the majority of OEPCs identified from the ~16,500 cells analyzed (4712 cells, 28%) while cluster 2 was much smaller (140 cells, 0.8%). Both clusters showed high expression of basal/progenitor markers (Krt5, Krt14,Krt15), enrichment of factors required for stem cell maintenance (Ascl2, Tfcp2l1,Procr, Patz1), and enrichment of members of the Wnt and Notch pathways (Tables S2 and S3). Several other Wnt genes were also expressed at high levels (Figures 4i and S4h).
We further evaluated the expression patterns of Sox2, Lrig1, Bmi1, Krt14, and Gli1, genes we had previously shown labeled OEPCs (Figure S4g). While only Krt14 and Gli1 were enriched within specific clusters, all five genes were expressed broadly amongst both OEPCs and post-mitotic differentiating cells. Thus, these genes are not unique to OEPCs and are expressed broadly within the basal layer. For practical purposes, because droplet scRNAseq has an mRNA detection efficiency of under 10% per molecule in several protocols (Klein et al., 2015; Liu and Trapnell, 2016; Macosko et al., 2015), the expression of these genes at the individual cell level may be underestimated in this analysis. This likely explains why Bmi1 is not identified in all cells, as would be predicted based on the ISH results.
Cluster 3 cycling cells (5259 cells, 32%) expressed numerous transcription factors associated with G1/S and G2/M phases of the cell cycle. Cells from clusters 5 (3726 cells, 22%), 4 (2195 cells, 13%), and 7 (76 cells, 0.4%) showed a stepwise increase in the expression of Krt4, Krt13, Lor, Krtdap, and other genes associated with epidermal differentiation as well as a stepwise decrease in OEPC markers such as Krt14 and Krt5 (Figure 4i). Interestingly, cluster 6 cells (414 cells, 2.5%) also expressed differentiation markers, but had a strong inflammatory gene signature, specifically interferon induced genes secondary to viral infection, thus likely representing virally infected oral epithelial cells. Cluster 8 cells (50 cells, 0.3%) expressed keratinocyte differentiation genes as well as high levels of Krt14, which is normally only enriched within OEPCs, as well as markers of wound healing, inflammation, and keratinocyte migration (Tables S2 and S3). When pooled together, differentiating cells in clusters 4–8 were enriched for transcription factors important for keratinocyte maturation. Thus, cells from these clusters appear to represent a continuum of maturing keratinocytes within the basal layer, which is supported by their sequential organization on the SPRING plot. Based on our earlier kinetic analysis, we predicted that up to 50% of the cells would appear post-mitotic, and indeed the five putatively post-mitotic clusters comprised about 40% of the cells.
ISH Confirms the Presence of Multiple Basal Layer Cell States Predicted by scRNAseq
The structure of the scRNAseq data suggested that collectively, the clusters represented a continuum of cell states at various stages of maturation, ranging from OEPCs to post-mitotic cells preparing to leave the basal layer. This was supported by the co-expression patterns of genes identified in the enrichment analysis that were associated with OEPCs and differentiating keratinocytes. For example, Krt14 (associated with OEPCs) and Krtdap (associated with differentiating keratinocytes) showed overlapping mRNA expression patterns despite being enriched within different clusters (Figure 4i,k; see Mendeley Figure S2 for other examples). Further supporting this, we found that cells in each cluster showed overlapping expression of many other genes associated with OEPCs (e.g. Krt5/14, Itga6, Itgb4, hemidesmosome genes) and early differentiating keratinocytes (e.g. Krt4/13, Krtdap, and multiple genes from the epidermal differentiation complex; Mendeley Table S1). Importantly, none of the clusters showed expression of late cornified envelope genes such as Lce1 and Lce3, indicating that the post-mitotic basal layer cells fated for differentiation had not yet begun to express the transcripts found in terminally mature keratinocytes. Lastly, modules of co-expressed genes enriched within OEPCs, cycling cells, and differentiating cells were expressed in several clusters and overlapped with one another (Figures 4m; S2e,f; Table S4).
To confirm these findings, we performed dual-labeled RNAscope ISH to analyze expression of Krt14 and Krtdap within individual basal layer cells. Similar to the SPRING plot, we identified three main patterns: cells with high levels of Krtdap and little expression of Krt14, cells with moderate levels of both Krtdap and Krt14, and cells with low levels of Krtdap and high levels of Krt14 (Figure 4l). ISH for Wnt4, Wnt10a, and Krt15 similarly showed cells with high, intermediate, and low expression (Figure S1j). Additionally, we found that Krtdap+/Krt14- cells comprised an average of 10.7 ± 1.0% of basal layer cells (n=391 cells scored, mean ± sampling error, Mendeley Figure S3), which is consistent with the percentage of cells (14%) represented by clusters 4 and 7 that have such a gene expression pattern. These results are in line with our scRNAseq and gene enrichment analyses, and they show that the cell clusters represent a continuum of cell states within the basal layer, as cells transition from OEPCs to post-mitotic cells (Figure 4j).
Cell Cycle Analysis of Basal Layer Cells Reveals Their Highly Proliferative State
We next explored the cycling dynamics of cells within each of the clusters. To do this, we first looked at Ki-67 gene expression overlaid on the SPRING plot (Figure 4n), which showed the highest level of expression in cluster 3 and lower levels in several other clusters (e.g. 1, 2, 5, and 4). We hypothesized that low levels of Ki-67 present in OEPCs in clusters 1 and 2 could indicate that these cells were preparing to enter or had recently entered G1/S. Supporting this, Mcm2, one of several proteins that bind DNA origins of replication and form prereplicative complexes, was expressed in many of the OEPCs at high levels, indicating that these cells were actively cycling (Figure 4n; Shreeram and Blow, 2003). Interestingly, cells from clusters 1–3 together represent 61% of all cells in the scRNAseq analysis, which is comparable to the estimated proportion of progenitor cells reported in the esophageal epithelial basal layer of 65% (Doupe et al., 2012). In contrast, post-mitotic cells in clusters 4 and 5 with low levels of Ki-67 also expressed low levels of Gmnn, a negative regulator of DNA synthesis whose levels rapidly decline following cell cycle exit (Xouri et al., 2004). This could indicate that these cells recently exited the cell cycle (Figure 4n). These results show that the Ki-67 gene is expressed widely amongst basal layer cells. Given the rapid turnover rate of the oral epithelium and the fact that the Ki-67 protein can persist in cells that have recently exited the cell cycle (Pacal and Bremner, 2012; Sobecki et al., 2017), it is not surprising that up to 95% of basal layer cells showed positive Ki-67 immunofluorescence at some level (Figures 2b and S1k-m).
DISCUSSION
Our data show that Bmi1 is expressed in most oral epithelial basal layer cells and labels long-lived OEPCs, which are distributed throughout the oral mucosal basal layer. Throughout the buccal and dorsal tongue epithelia, OEPCs rapidly divide and follow the population asymmetry model with neutral drift dynamics. Although these results differ substantially from the current oral mucosa stem cell paradigm, they are in line with work in the interfollicular epidermis and esophageal epithelium, showing that epithelia from distinct developmental lineages use similar progenitor cell organization strategies to maintain tissue homeostasis (Clayton et al., 2007; Doupé et al., 2012; 2010). The differences between our findings and an earlier report in the tongue (Tanaka et al., 2013) are likely due in part to differences in labeling efficiency of the reporter lines as well as to the high sensitivity and specificity of the RNAscope ISH technique.
We also demonstrate that the effects of 5FU on OEPCs are unexpectedly longlasting. Mice in our study were given 3 large boluses of 5FU, so it is possible that levels remained elevated within the plasma for an extended period of time, which could explain why mitotic levels within the buccal mucosa slowly increased back to normal instead of transitioning rapidly to a hyperproliferative state. Additionally, 5FU could lead to continued cell cycle arrest even after levels significantly drop in the plasma. These extended effects on OEPCs, in addition to the complex milieu of signaling factors at the sites of mucosal damage, could help explain why oral mucositis, a common side-effect of chemotherapy, can take as long as 2–4 weeks to resolve following the last dose of chemotherapy (Lalla et al., 2008).
Lastly, the scRNAseq results show that the oral epithelial basal layer is comprised of both OEPCs and post-mitotic cells that have begun the process of differentiating prior to leaving the basal layer, as seen by the expression of differentiation genes in clusters 4–8. We cannot entirely exclude the possibility that a few suprabasal layer cells were included in these clusters, despite sorting only cells with the highest levels of β4-integrin (Figure S4e). One should therefore consider that some of the latest transcriptional events seen in our data, associated with just a few percent of the cells, could have been due to the presence of suprabasal layer cells in the analysis. Any differentiated suprabasal layer keratinocytes present would most likely have been assigned to cluster 7, or less likely cluster 4, which expressed the highest levels of Krtdap and lowest levels of Krt14, and together represented only 14% of the total cells sampled. Although a comparable percentage of Krtdap+/Krt14- cells (10.7%) are present in the basal layer via ISH (Mendeley Figure S3), it is nonetheless possible that some of the cells in these clusters were suprabasal. Even if we excluded clusters 4 and 7 from the analysis, cluster 5 cells still express moderate to high levels of genes associated with both OEPCs and differentiating keratinocytes (Fig. 4k, Mendeley Table S1) and clearly represent an abundant, intermediate, transitional cell state. Therefore, the presence of a few suprabasal layer cells in the analysis would not alter our conclusion that post-mitotic cells begin expressing differentiation associated genes prior to leaving the basal layer.
The conclusion that differentiation begins in the basal layer is consistent with both the clonal analysis, which predicts that up to half of basal cells are postmitotic, and the mitotic figure orientation analysis, which shows that most OEPCs divide parallel to the basement membrane resulting in two daughter cells that initially remain within the basal layer. These post-mitotic basal layer cells presumably undergo a decision to exit the basal layer, during which time they may start to downregulate expression of basal layer genes and start to express differentiation associated genes. Through currently unknown signals following cell division, each daughter cell within the basal layer either retains its identity as an OEPC or begins to terminally differentiate and eventually delaminate. It is not clear at what point during cell division that commitment to differentiation occurs or if post-mitotic cells still retain the ability to return to an OEPC state, possibly in response to damage within the basal layer. Interestingly, the expression of gene module 1 in cluster 3 cycling cells (Figure S2e,f; Table S4), which includes differentiation associated genes, hints at the possibilities that either commitment to a differentiated state may begin during cell division or that post-mitotic cells can re-enter the cell cycle. The spatial and transcriptional transitions that cells undergo as they differentiate and exit the basal layer on their path to becoming mature keratinocytes will be important to explore in the future. Identifying the signals that drive OEPC daughter cell fate behavior will be crucial to understanding how tissue homeostasis is maintained and how OEPCs contribute to oral disease.
STAR METHODS
CONTACT FOR REAGENT AND RESOURCE SHARING
Further information and requests for reagents may be directed to and will be fulfilled by lead contact, Ophir Klein (ophir.klein@ucsf.edu)
EXPERIMENTAL MODEL AND SUBJECT DETAILS
Mouse Lines
Mice were housed in accordance with University of California San Francisco Institutional Animal Care and Use Committee (IACUC) guidelines. The UCSF Institutional Animal Care Use Committee approved all mouse experiments. The following mouse lines were obtained from The Jackson Laboratory: Bmi1tm1(cre/ESR1)Mrc (referred to as Bmi1CreER), Sox2tm1(cre/ERT2)Hoch (referred to as Sox2CreER), Gli1tm3(cre/ERT2)Alj (referred to as Gli1CreER), Lrig1tm1.1(cre/ERT2)Rjc (referred to as Lrig1CreER), Tg(KRT14-cre/ERT)20Efu (referred to as K14CreER), Gt(ROSA)26Sortm14(CAG-tdTomato)Hze (referred to as R26tdTomato), and Tg(tetOHIST1H2BJ/GFP)47Efu (referred to as H2BGFP). Tg(KRT5-tTA)1216Glk/Nci mice (referred to as K5tTa) were obtained from the National Cancer Institute Mouse Repository. Bmi1CreER, Sox2CreER, Gli1CreER, Lrig1CreER, and K14CreER mice were crossed with R26tdTomato mice to generate heterozygotes for each allele, which were then used for lineage tracing and clonal analysis experiments. K5tTa heterozygous mice were crossed with H2BGFP heterozygous mice to generate K5tTa; H2BGFP heterozygotes, which were used in label retaining experiments.
METHOD DETAILS
In situ hybridization
RNAscope 2.0 and 2.5 HD Red (ACD, 310036, 322350) and RNAscope 2.5 HD Duplex (ACD, 322430) detection kits were used following the manufacturer’s instructions. 2–3 month old C57BL/6J male and female mice (n = 6 mice, repeated 3 times) were euthanized and their oral mucosa/tongue tissues removed and placed into 10% neutral buffered formalin solution at room temperature for ~20 hours. Tissues were then washed 3×5 minutes in phosphate buffered saline (PBS), submitted for paraffin processing, and embedded in paraffin blocks. 5 μm sections were used for all experiments. Sections were boiled in the target retrieval solution at ~100°C for 15 minutes and incubated in the protease plus solution at 40°C for 15 minutes. Bmi1, Krt14, Krtdap, Krt15, Wnt4 and Wnt10a probes specific for Mus musculus were purchased from ACD. DapB (purchased from ACD) was used as a negative control along with appropriate positive controls in each experiment. Negative controls consistently showed little to no background staining. RNA in situ hybridization was performed in 2–3 month old C57BL/6J male and female mice (n = 3 mice, repeated 3 times) using an anti-Sox2 digoxigenin-labeled probe on frozen tissue sections using standard protocols. Anti-Sox2 probes were generated by amplifying a 750 bp Sox2 gene fragment cloned within a pBluescript SK+ vector using the DIG RNA Labeling Kit (Roche, 11175025910) according to the manufacturer’s instructions. Prior to probe generation, the vector was linearized with a XhoI restriction enzyme and transcribed using a T3 RNA polymerase.
Lineage Tracing
Adult male and female mice (n≥2 for each time point) greater than 2 months old were given a single intraperitoneal injection of tamoxifen or corn oil (for negative controls) and then euthanized at various times post-treatment (see main text for exact chase time points). Mice were dosed as follows:
| Genotype | Tamoxifen Dose Range |
|---|---|
| Bmi1CreER;R26tdTomato | 1–5mg/25g |
| Gli1CreER;R26tdTomato | 3mg/25g |
| Lrig1CreER;R26tdTomato | 3mg/25g |
| Sox2CreER;R26tdTomato | 0.3–1mg/25g |
| K14CreER;R26tdTomato | 0.04mg/25g |
Following euthanization, each mouse was perfused with cold 4% paraformaldehyde (PFA) dissolved in PBS. Oral mucosa, tongue, and skin were then removed and incubated in 4% PFA at 4°C on a shaker for about 2–3 hours. The tissues were then washed 3×5 minutes in PBS and incubated overnight in a 30% (w/v) sucrose-PBS solution at 4°C. The following day, the tissues were embedded and frozen in optimal cutting temperature (OCT) medium. 7 μm cryosections were cut and air-dried onto glass slides, washed 3×5 minutes in PBS with 0.1% (v/v) Tween 20 (PBS-T) to remove residual OCT medium, blocked in an animal-free blocking solution (Vector Laboratories, SP-5030) for 1 hour at room temperature, incubated overnight at 4°C with β4-integrin primary antibody, washed 3×10 minutes with PBS-T, incubated with a secondary antibody at room temperature for one hour, washed 2×5 minutes with PBS, stained with 4,6-diamidino-2-phenylindole (DAPI) dissolved in PBS for 30 minutes at room temperature (5 μg/mL, Sigma, D9564-10MG), washed with PBS, mounted with Vectashield Antifade Mounting Medium (Vector Laboratories, H-1000), and sealed with clear nail polish.
BMI1 Immunofluorescence
5μm sections were cut from formalin-fixed, paraffin-embedded oral mucosal tissues collected from C57BL/6J male and female mice. Sections were rehydrated and antigen retrieval performed by incubating tissues in antigen retrieval buffer (pH 6.0) containing 10 mM citric acid, 2 mM ethylenediaminetetraacetic acid (EDTA), and 0.05% (v/v) Tween 20 just below 100°C for 20 min followed by a 30 minute cool-down to room temperature. Sections were then incubated with animal-free blocking solution for 30 min at room temperature followed by overnight incubation with anti-BMI1 primary antibody at 4°C. Samples were washed 3×5 minutes in wash buffer (PBS with 0.1% (v/v) Triton-X) followed by incubation with biotin-conjugated secondary antibody (Vector Laboratories, BA-1000) for one hour at room temperature. Sections were then incubated with ABC Elite reagent (Vector Laboratories, PK-6100) for 30 min at room temperature, washed 3×5 minutes in wash buffer, incubated with the TSA Plus Cyanine 3 System kit (Perkin Elmer Life Sciences, NEL744001Kt) for 10 minutes, and washed 3×5 minutes in wash buffer. Sections were then stained with DAPI dissolved in PBS for 30 minutes at room temperature, washed 3×5 minutes with PBS, mounted with Vectashield Antifade Mounting Medium, and sealed with clear nail polish.
BrdU Pulse-Chase Experiment
3 month old wildtype C57BL/6 male and female mice (n≥2 for each time point) were given an intraperitoneal injection of 1mg of 5-bromo-2’-deoxyuridine (BrdU) dissolved in PBS and then euthanized at various time points post-treatment (see main text for exact chase time points). After being euthanized, each mouse was perfused with cold 4% PFA dissolved in PBS. The oral mucosa and tongue were then removed and incubated in 4% PFA overnight at 4°C. The next day, the tissues were washed 3×5 minutes in PBS, submitted for paraffin processing, and then embedded in paraffin blocks. 5μm sections were used for the subsequent BrdU immunohistochemistry experiments following standard protocols. Briefly, slides were deparaffinized, an antigen retrieval step was performed using a citrate buffer (Vector Unmasking Solution, Vector Laboratories, H-3300) in a pressure cooker for 15 minutes, washed 4×5 minutes in distilled water, washed in PBS for 5 minutes, incubated in 3% (v/v) hydrogen peroxide diluted in PBS for 30 minutes at room temperature, washed in PBS for 5 minutes, incubated in 0.2N hydrochloric acid for 45 minutes at 37°C, washed ag ain in PBS for 5 minutes, washed for 5 minutes in PBS-T, blocked in blocking buffer (5% bovine serum albumin, 5% bovine serum, 0.1% Triton-X dissolved in PBS) for 1 hour at room temperature, incubated with an anti-BrdU primary antibody overnight at 4°C, washed 3×10 minutes in PBS-T, incubated with a biotinylated rabbit anti-rat secondary antibody at room temperature, and washed 3×10 minutes in PBS. The Vectastain Elite ABC HRP Kit (Vector Laboratories, PK-6100) was used to develop the slides following the manufacturer’s protocol. Appropriate positive and negative controls were run during each experiment.
Whole-Mount Immunofluorescence
Mice were euthanized and the buccal mucosa and tongue quickly removed, rinsed in PBS without magnesium or calcium, and placed in a pre-warmed (37°C) solution of 20mM ethylenediaminetetraacetic acid (EDTA) dissolved in PBS without magnesium or calcium. The buccal mucosa was incubated for 2 hours and the tongue for 4 hours at 37°C. Following incub ation, the epithelium was peeled and separated from the underlying connective tissue, rinsed in PBS, fixed for one hour at room temperature or overnight at 4°C in 4% PFA, washed 3×5 minutes in PBS, and stored in PBS with 0.02% sodium azide at 4°C. For immunofluorescence staining, the separated epithelial sheets were incubated in whole-mount blocking/permeabilization buffer (1% bovine serum albumin, 5% horse serum, 0.8% Triton-X) for 1–3 hours at room temperature, incubated with a primary antibody diluted in the blocking buffer overnight at 4°C, washed 3×15 minutes in PBS-T, incubated with a secondary antibody for one hour at room temperature or overnight at 4°C, washed 2×15 minute s in PBS-T, stained with DAPI dissolved in PBS for 30 minutes at room temperature, washed 2×5 minutes in PBS, and mounted basal layer side up (i.e. touching the coverslip) onto a glass slide using Vectashield Antifade Mounting Medium (Vector Laboratories, H1000), and sealed with clear nail polish. Multiple sections of tissue from each mouse described in the main text/methods were used in each staining experiment.
Dual BrdU and EdU Pulse/Chase Labeling
To assess cell cycle duration, 8 week old female mice (n=4 mice) were used to calculate the average lengths of both the S-phase (3121 cells) and overall cell cycle times (40726 cells) using a dual BrdU/EdU labeling technique described comprehensively previously (Martynoga et al., 2005). Briefly, mice were first given an intraperitoneal injection with 0.75 mg/25g of 5-ethynyl-2’-deoxyuridine (EdU), followed 1.5 hours later by an intraperitoneal injection with 0.75mg/25 of BrdU. Mice were then euthanized 30 minutes later, 2 hours from the first injection with EdU (see Figure 2c). Epithelial sheets were prepared from the buccal mucosa of each mouse as already described. Buccal mucosal epithelium was then blocked for 3 hours in whole-mount blocking/permeabilization buffer, incubated in 1N hydrochloric acid diluted in water for 20 minutes at 37°C, washed 4×5 minutes in PBS-T, and stained for EdU using the Click-iT EdU Alexa Fluor 647 kit following the manufacturer’s instructions (ThermoFisher, C10340). Following staining, the samples were washed 3×10 minutes in PBS-T, incubated overnight at 4°C in a specific anti-BrdU antibody t hat does not cross-react with EdU, washed 3×15 minutes in PBS-T, incubated with a secondary antibody for one hour at room temperature, washed 3×15 minutes in PBS-T, stained with DAPI for 30 minutes at room temperature, washed 1×5 minutes in PBS, mounted onto glass slides as already described, and sealed with clear nail polish. To assess reentry of cells into the cell cycle, 3 month old male and female C57BL/6 mice (n=3 mice) were given a single injection of BrdU, a second injection of EdU after 48 hours, and then euthanized 3 hours later (51 hours following the BrdU injection). The buccal mucosa was isolated, epithelium separated from the underlying connective tissue, and probed for BrdU and EdU expression as already described.
K5tTa;H2BGFP Label Retention Experiments
2 to 4 month old male and female K5tTa;H2BGFP mice were used (n≥3 mice per chase time point). To inhibit expression of the H2BGFP allele, mice were initially given an intraperitoneal injection of doxycycline (0.4mg, Enzo Life Sciences, ALX-380–273-G005) and were then maintained on mouse chow that contained doxycycline (200mg/kg, BioServ, S3888). Mice were subsequently euthanized at 0 days (baseline), 3 days, 7 days, 21 days, 6 weeks, and 3 months after doxycycline treatment. The buccal mucosa in each mouse was removed, the epithelium separated from the underlying connective tissue, stained with DAPI in PBS for 30 minutes at room temperature, rinsed 2×5 minutes in PBS, and mounted onto glass slides as already described. Tissues were imaged in two ways. First, confocal microscope settings (e.g. laser power, exposure time, binning, gain, etc.) were adjusted to maximize the EGFP signal in the baseline K5tTa;H2BGFP samples (i.e. did not receive any doxycycline), without overexposing them and over-saturating the microscope camera. These same microscopic imaging parameters were then used to image the remaining K5tTa;H2BGFP samples in order to determine the relative differences in fluorescence between them. Next, optimized confocal settings were adjusted for each sample to maximize EGFP expression in order to detect any rare, label retaining cells at later chase time points.
Measuring Individual Cell Fluorescence Values in K5tTa;H2BGFP Samples
Using the confocal images taken with identical imaging parameters for each K5tTa;H2BGFP sample, the total relative fluorescence values for individual basal layer keratinocytes were calculated in FIJI (baseline: n=2 mice, 2173 cells; 3 day chase: n=6 mice, 4797 cells; 7 day chase: n=3 mice, 3030 cells). Relative fluorescence values were calculated by manually tracing individual cell nuclei (the location of the GFP signal) and then measuring the IntDen output under the analyze menu in FIJI. The IntDen function multiplies the mean fluorescence (i.e. mean pixel intensity) within a specified region of interest by its area (i.e. number of pixels). In this way, the total relative fluorescence takes into account both nuclear size and mean pixel intensity. Background subtraction was also applied to each sample to control for low levels of background fluorescence.
Buccal Mucosa Single Cell Dissociation and FACS Sorting
Freshly dissected buccal mucosae from 12 week old female C57BL/6 mice (n=10 mice) were incubated in EDTA (20mM) and PBS without calcium or magnesium for 90 min at 37°C, and the epithelium peeled away from the connective tissues. The epithelial sheets were minced into small pieces and incubated in DMEM/F12 (Gibco, 11039–021) with 1% penicillin/streptomycin (Gibco, 15140–122), 30ug/ml DNase I (Worthington, LS002007), 3 mg/ml collagenase P (Sigma,11213857001) for 30 min at 37°C with intermittent s haking to help dissociate the cells. Cells were then filtered through a 40μm filter (Falcon, 352340) into FACS buffer (DMEM/F12 medium with 5% fetal bovine serum, 10mM HEPES, and 2.5mM EDTA), spun down at 4°C, and resuspended in F ACS buffer with Fluorescein isothiocyanate (FITC) labeled anti-mouse CD104 (β4-integrin) antibodies (as previously described in (DeWard et al., 2014) and incubated for 30 minutes on ice in the dark. Cells were then spun down at 4°C, resuspended in FACS buffer, and sorted on a FACSAria II cell sorter (Becton Dickinson). Prior to sorting, dead cells and debris were stained with DAPI (0.5ug/mL) and excluded. An appropriate antibody isotype control was also used.
Single Cell RNAseq
Sorted, individual cells positive for high levels of β4-integrin expression were run in two lanes (i.e. two technical replicates) at different loading concentrations on the Chromium Controller (10X Genomics) using the Chromium Single Cell 3’ Reagent Kit v2 (10X Genomics, PN-120237) according to the manufacturer’s instructions. The resulting cDNA library was then sequenced on an Illumina HiSeq 2500 (Illumina) using the HiSeq 2500 Rapid Run with SBS Kit v2 (Illumina, FC-402–4021).
Imaging Equipment and Software
Whole-mount tissues and cryosections were imaged at room temperature on one of two microscopes: an inverted Zeiss confocal microscope with a Yokogawa CSU-10 spinning disc and Andor iXon EMCCD camera using a Zeiss Plan-NeoFluar 40x (NA: 1.3) 1022–818 oil immersion objective or with an inverted Zeiss Spinning Disc with a Yokogawa CSU-X1 spinning disc and Axiocam 506 CCD camera using a Zeiss 40x (NA: 1.1) LD C-Apochromat water immersion objective. FFPE sections were imaged on an upright Leica DM5000B microscope with a Leica DFC 500 camera and using 40x (NA: 0.75) HCX PL S-APO air objective or a 63x (NA: 1.3) HCX PL APO oil objective. All image analysis was performed using FIJI (Schindelin et al., 2015). Figures were created using Adobe Illustrator CS6.
QUANTIFICATION AND STATISTICAL ANALYSIS
Ki-67 Quantification
10 week old male and female C57BL/6 mice (n=5 mice, 6123 cells) referred to as “young mice” in main text) were used to quantify the percentage of Ki-67 positive basal layer keratinocytes in the buccal mucosal epithelium for the experiments described in Figure 2. 18–19 month old male Bmi1CreER;R26tdTomato mice (n=3 mice, 5154 cells) referred to as “old mice” in the main text) were used to quantify the percentage of Ki-67 positive basal layer keratinocytes in the buccal mucosal epithelium for the experiments described in Figure 3. In both instances, separated epithelial sheets were stained for CD45 and Ki-67 and mounted as already described. In order to accurately count the number of keratinocytes present, CD45 (expressed on all mature hematopoietic cells except for mature erythrocytes), was used to highlight resident immune cells so that they would be excluded from the analysis. The number of Ki-67 positive cells as a percentage of the total number of cells was quantified manually using FIJI. A nonparametric Wilcoxon rank-sum two-tailed test with a significance level of 0.05 was used to compare the percentages of Ki-67 positive basal layer keratinocytes found in the “young mouse” (10 week old) samples with the percentages obtained from the “old mouse” (18–19 month old) samples. Multiple imaged areas from each sample were evaluated for this analysis.
Cell Cycle Calculations Using BrdU and EdU Dual Labeling
Following injection with EdU and BrdU, cells that have exited the S-phase prior to euthanasia will only label with EdU whereas cells still within the S-phase when the mouse is euthanized will be labeled with both EdU and BrdU (see Figure 2f). For the calculations, it was assumed that EdU and BrdU did not reach detectable levels within tissues for 30 minutes following injection into the mouse. Using the formulas below as previously described by Martynoga et al., the average length of S-phase was calculated first, which was then used to calculate the average overall cell cycle length. The average percent of Ki-67 positive keratinocytes calculated in Figure 3J (95.05%) was used to estimate the number of cycling cells in each area (Pcells) imaged/analyzed when calculating the average cell cycle time.

Clonal Analysis of Buccal Mucosa and Tongue Epithelium
2 to 3 month old (“young”) or 15 to 19 month old (“old”) male and female Bmi1CreER;R26tdTomato mice (n≥3 mice per chase time point) were given a single intraperitoneal injection of tamoxifen (1mg/25g for clonal analyses in the buccal mucosa and 2mg/25g for clonal analyses in the tongue) to label single basal layer keratinocytes sufficiently far enough apart so that clonal collisions would be avoided. “Young” mice analyzed for clones within the buccal mucosa were euthanized at 3 days, 5 days, 14 days, 21 days, 28 days, 6 weeks, 3 months, 6 months, and 9.8 months following injection with tamoxifen. “Old” mice analyzed for clones within the buccal mucosa were euthanized at 3 days, 7 days, 14 days, 21 days, 6 weeks, and 3 months following injection with tamoxifen. “Young” mice analyzed for clones within the dorsal tongue epithelium were euthanized at 3 days, 7 days, 21 days, 6 weeks, and 4 months following tamoxifen injection. The buccal mucosa and tongue were then removed and epithelial sheets separated, incubated with an anti-β4-integrin primary antibody and appropriate secondary antibody, and mounted on glass slides as already described. A large grid of overlapping confocal stack tiles (each measuring either 512×512 pixels or 996×996 pixels) was then imaged for each sample with z-stack spacing of 1μm. Tiles were stitched together using the Imaris MicroMagellan Compiler plugin for FIJI (freely available at http://biomicroscopy.ucsf.edu/mediawiki/index.php?title=Analysis_Software_Repository) and clones analyzed in FIJI. Representative groups of tiles from each sample were then selected and the total number of clones as well as the total number of basal layer keratinocytes per clone quantified. For Figs. 3d,e,g,h, asymptotic fits of a neutral drift model were performed as described previously (Klein et al., 2007; Lim et al., 2013). In brief, the average clone size, 〈n(t)〉, is predicted to grow linearly, 〈n(t)〉=1/ρ +(rλ/ρ)*t, where ρ is the fraction of basal cells that divide, λ is the cell cycle rate, and 2r is the fraction of divisions that give rise to daughter cells with a symmetric fate (both dividing or both differentiating). The density of clones in the basal layer, NC(t), is predicted to drop in a reciprocal manner, NC(t) = NC(0)/(1 + rλ*t). Numerical fits of the data to these curves were carried out in Microsoft Excel. Statistical significance of the fits is given in the main text. Parameter values are not important to establish the general signature of neutral drift, but are provided for completeness: for the younger adult Bmi1CreER;R26tdTomato mouse labeled clones in the buccal mucosa, we found rλ/ρ=1.7cells/week (Figure 3d), and rλ/NC(0)=0.22clones/tile/week (Figure 3e). With NC(0)=3.9±0.6 clones/tile (mean±SEM), and λ=2 days (estimated from H2BGFP dilution and from EdU/BrdU double-labeling), this gives an estimate of r≈0.23, ρ≈0.47. Thus, approximately half of the basal layer is predicted to be post-mitotic, in agreement with results of scRNA-Seq. From these quantities, the exit rate Γ of post-mitotic cells can be shown to be comparable to the cell cycle, because Γ = ρλ/(1-ρ) ≈ λ. For the aged Bmi1CreER;R26tdTomato mice (Figure 3i), the slope values for the average basal layer footprint were rλ/ρ=0.85 cells/week. Finally, for dorsal tongue basal layer keratinocytes in the Bmi1CreER;R26tdTomato mice, the slope values for the average basal layer footprint were rλ/ρ=2.8 cells/week.
Nuclear Density and Clonal Analysis of 5-Fluorouracil Treated Mice
5-Fluorouracil (5FU) powder (Sigma, F6627–5G) was dissolved in sterile 0.85% saline at a concentration of 6.25mg/mL, incubated at 60°C for 45 minutes with intermittent vortexing in order to ensure complete dissolution of the powder into solution, and pH adjusted to 9.2. Aliquots were then frozen at −20°C and thawed only once prior to injection into mice. 8–9 month old male and female Bmi1CreER;R26tdTomato mice (n=3 mice per chase time point) were first given an intraperitoneal injection with tamoxifen (1mg/25g) on day 0, and then given 3 sequential intraperitoneal injections of either 0.85% normal saline or 5FU (50mg/kg) on days 1, 2, and 3. Mice were euthanized at days 1, 3, 7, 14, and 21 days following the last dose of saline or 5FU (see Figure 4a). Buccal mucosa was removed, epithelial sheets separated, incubated with anti-β4integrin/secondary antibodies, and mounted on glass slides as described above. Samples were then imaged and clones analyzed as already described. Additionally, clone size distributions were analyzed in mice at the 1 day chase (control: n=2 mice, 203 clones; 5FU-treated: n=3 mice, 507 clones) and at the 3 day chase (control: n=3 mice, 367 clones; 5FU-treated: n=3 mice, 292 clones) time points. The number of RFP-labeled suprabasal layer keratinocytes was also quantified at the 1 day chase (control: n=2 mice, 691 cells; 5FU-treated: n=3 mice, 1458 cells) and 3 day chase (control: n=3 mice, 1465 cells; 5FU-treated: n=3 mice, 1281 cells) time points. Finally, the number of nuclei in the basal layer was quantified at the 1 day chase in control (n=3 mice, 4021 nuclei) and 5FUtreated mice (n=3 mice, 3551 nuclei). A two-tailed Fisher’s exact test with a significance level of 0.05 was used for statistical analyses.
Mitotic Figure Quantification and Orientation Analysis
Using the whole-mount clonal analysis imaging data collected from the saline or 5FU treated Bmi1CreER;R26tdTomato mice, mitotic figures were identified via histomorphology and their overall number quantified and orientation assessed. Only a portion of the total mitotic figures identified were at a suitable stage of division such that their mitotic orientations could be reliably evaluated. To do this, orthogonal views were created in FIJI for images containing mitotic figures, which permitted the evaluation of each mitotic figure in multiple planes of section in order to establish its proper orientation. Mitotic figures were grouped into one of 5 categories based on the relationship of the dividing cells to the underlying basement membrane (BM), represented by β4-integrin staining, as well as to one another. The categories were as follows: parallel (both mitotic figures touch the BM), oblique (one mitotic figure touches the BM while the other has lifted off at an approximately 45° angle to the remaining mitotic figure), perpendicular (one mitotic figure touches the BM while the other is directly above the underlying mitotic figure), intermediate (one mitotic figure touches the BM while the second is barely touching the BM and appears to be in the process of lifting off), and suprabasal (both mitotic figures have simultaneously lifted off the BM and are no longer touching it). See Figure S4 for examples. Mitotic figures whose orientations could be accurately determined were analyzed in control mice (n=11 mice, 533 mitotic figures) and 5FU-treated mice (n=14 mice, 440 mitotic figures). A twotailed Fisher’s exact test with a significance level of 0.05 was used to compare the number of parallel-orientated mitotic figures in the saline treated mice with those in the 5FU treated mice. In order to maximize the sample size for the 5FU treated mice, the mitotic orientation counts from each chase time point were pooled. A nonparametric two-tailed Wilcoxon rank-sum test with a significance level of 0.05 was used to compare the overall number of mitotic figures per field (tile) imaged in the saline treated Bmi1CreER;R26tdTomato mice (n=11 mice, 1224 mitotic figures [MFs]) with the total number of mitotic figures identified at each of the chase time points in the 5FU treated mice (1 day chase: n=2 mice, 89 MFs; 3 day chase: n=3 mice, 159 MFs; 7 day chase: n=3 mice, 257 MFs; 14 day chase: n=3 mice, 238 MFs; 21 day chase: n=3 mice, 383 MFs).
Single Cell RNAseq Data Cleanup and Normalization
Cells with less than 1000 total counts or more than 10% of counts coming from mitochondrial genes were considered low quality and filtered out. The surviving 17,296 transcriptomes had 8,261 total counts on average, and were total-count normalized as described in (Klein et al., 2015). Upon initial visualization and clustering of the data (see below) we identified a small fraction of cells (n=237) forming well separated clusters and characterized by distinct expression of either immune genes (Nkg7, Csf1r) or salivary duct markers (Krt7). These cells were excluded from further analysis. We applied an additional clean up step to remove doublets (n=497), which represent rare events of two cells occasionally entering the same droplet during microfluidic barcoding. Briefly, single cell transcriptomes from the data set are randomly combined to generate in silico doublets, which serve as a decoy training set used to train a k-nearest neighbor classifier. Observed cells classified as doublets are removed from further analysis. The detailed method will be published elsewhere. Following clean up and removal of unwanted cell populations, 16,572 cells remained for analysis.
Single Cell RNAseq Data Visualization and Clustering
The high dimensional single cell RNAseq data was visualized in 2D as a force directed layout of a k nearest neighbors (kNN) graph using SPRING (Weinreb et al., 2017), a method that preserves topological relationships between cells and is therefore well suited to visualize continuous data such as that described here. The plot was divided into clusters using the spectral clustering on the same kNN graph as used for SPRING [implementation in python,sklearn.cluster.SpectralClustering(affinity=‘precomputed’, assign_labels=‘discretize’)]. First, the graph was divided into 20 clusters. Clusters with high Ki-67 expression were merged together and labeled as cycling cells. Next, we merged clusters that had less than 2 differentially expressed genes (DEGs). At this step, DEGs were defined as having an absolute fold-change of 5 (after the addition of a pseudo value of 1 count), and statistically significantly different between the two clusters compared (FDR<0.05, two-tailed MannWhitney U test p<0.05). Interactive explorers of the resulting SPRING plots can be accessed here:
Before cleanup (including potential doublets, immune, and salivary duct cells): https://kleintools.hms.harvard.edu/tools/springViewer_1_6_dev.html?datasets/OphirKlein_buccal_mucosa/6_all_cells
After cleanup:
Cell Cluster-Specific Gene Identification
Gene (g) was considered specific to cluster (i) if (g) was:
Detected in at least 3 cells with at least 3 counts (after normalization) across all cells.
Statistically significantly higher in cluster (i) compared to all other cells (FDR<0.05; two-tailed Mann-Whitney U test p<0.05).
Expressed 1.5x higher in cluster (i) compared to any other cluster. Before calculating fold-changes, a pseudo value of 0.1 count was added to buffer against low expression and avoid division by zero.
The criteria described above select for genes enriched in a specific population but excludes genes specific for more than one cluster. For example, no exclusive genes were identified for cluster 5, which likely represent less differentiated states in the continuum formed by Dmknhi cells. Therefore, we repeated the selection described above treating clusters 4/5/6/7/8 collectively to identify genes specific to more than one of these clusters. Heat maps in Figure 4m and Figure S2e,f show genes specific to two or more populations from 4/5/6/7/8, followed by genes exclusive to each of the beta4-integrin positive populations identified. Hits are ordered by decreasing max-to-second-max ratio of average expression within clusters. Up to 50 hits are shown per population. A complete enriched gene list with expression levels and p-values from statistical testing are provided in Supplementary Table S2. Transcription factor lists were obtained from animaltfDB (Zhang et al., 2015).
Correlated Gene Module Identification
While dividing the kNN graph into clusters provides a convenient summary of distinct transcriptomic states observed in single cell data, it is less suited to capture heterogeneity that manifests as partially overlapping gene expression programs. To address this heterogeneity within continua formed by Ki-67hi cells (cluster 3), Ccnd2hiKi-67low cells (clusters 1 and 2), and differentiating Dmknhi cells (clusters 4/5/6/7/8), we identified modules of correlated genes as follows:
Select only cells of interest, e.g. clusters 4/5/6/7/8 for differentiating basal cells.
Identify 2000–3000 of the most variables genes across all selected cells (variability statistic v above mode, as described in (Klein et al., 2015) expressed in at least 5 counts in at least 5 cells, and excluding mitochondrial and ribosomal protein genes.
Calculate gene-gene Pearson correlation.
Keep gene (g) if correlation coefficient r>0.2 for the nth most correlated gene to (g), with n=5,10,10 for Ccnd2hiKi-67low, Dmknhi, and Ki-67hi cells, respectively.
Hierarchically cluster (correlation distance metric, Ward linkage) surviving genes to reveal discrete blocks of correlated genes (Fig 4m; Figure S2e,f).
Each block of correlated genes was collapsed into a single “signature” by taking the mean rank (dense ranking).
Statistical Analysis
All statistical analyses were run using Stata/SE, version 11.2 (StatCorp). Nonparametric two-tailed Wilcoxon rank sum, Chi-Square, and Fisher’s exact tests were used with a significance level set at α=0.05. For the clone survival analyses, the clone size distributions were transformed via an inverse function in order to achieve linearity for the subsequent linear regression analyses. Error bars represent either the standard deviation, standard error, or 95% confidence interval, as detailed within the text.
DATA AND SOFTWARE AVAILABILITY
Data Availability
The data that support the findings of this study are available from the corresponding author upon reasonable request. Supplemental Mendeley figures have been deposited online and can be accessed using the following link http://dx.doi.org/10.17632/52fxfdcb5z.1#file-cc3ea306-c20e-4e87-ac73b63b960e2635. Single cell RNAseq data is fully available as GEO project GSE120654.
Software Availability
The Imaris MicroMagellan Compiler plugin for FIJI used to analyze the clonal analysis whole-mount images is freely available at http://biomicroscopy.ucsf.edu/mediawiki/index.php?title=Analysis_Software_Repository
Supplementary Material
Highlights.
Oral mucosal progenitor cells are located in the basal layer and proliferate rapidly
Bmi1 is expressed by nearly all basal layer cells, including oral mucosal progenitors
Progenitors undergo population asymmetric self-renewal with neutral drift dynamics
Single-cell RNAseq reveals a continuum of cell maturation states in the basal layer
Acknowledgments
We thank members of the Klein laboratory and Drs. Jeff Bush and Kristin Harter for helpful suggestions. We also thank Kaitlin Corbin from the UCSF Biological Imaging Development Center for help with imaging. This research was funded by NIH R35-DE026602 and U01-DK103147 and Tobacco-Related Disease Research Program (University of California) 587629 to O.D.K. K.B.J. was funded by NIH F30-DE022509 and KL2-TR001870. A.M.K was funded by a Burroughs-Wellcome Fund CASI award and an Edward J Mallinckrodt Fellowship.
Footnotes
Declaration of Interests
AMK is a founder of 1CellBio, Inc.
Publisher's Disclaimer: This is a PDF file of an unedited manuscript that has been accepted for publication. As a service to our customers we are providing this early version of the manuscript. The manuscript will undergo copyediting, typesetting, and review of the resulting proof before it is published in its final citable form. Please note that during the production process errors may be discovered which could affect the content, and all legal disclaimers that apply to the journal pertain.
REFERENCES
- Arai Y, Pulvers JN, Haffner C, Schilling B, Nüsslein I, Calegari F, and Huttner WB (2011). Neural stem and progenitor cells shorten S-phase on commitment to neuron production. Nat Commun 2, 154. [DOI] [PMC free article] [PubMed] [Google Scholar]
- Clayton E, Doupé DP, Klein AM, Winton DJ, Simons BD, and Jones PH (2007). A single type of progenitor cell maintains normal epidermis. Nature 446, 185–189. [DOI] [PubMed] [Google Scholar]
- DeWard AD, Cramer J, and Lagasse E (2014). Cellular heterogeneity in the mouse esophagus implicates the presence of a nonquiescent epithelial stem cell population. Cell Rep 9, 701–711. [DOI] [PMC free article] [PubMed] [Google Scholar]
- Doupe DP, Alcolea MP, Roshan A, Zhang G, Klein AM, Simons BD, and Jones PH (2012). A Single Progenitor Population Switches Behavior to Maintain and Repair Esophageal Epithelium. Science 337, 1091–1093. [DOI] [PMC free article] [PubMed] [Google Scholar]
- Doupé DP, Alcolea MP, Roshan A, Zhang G, Klein AM, Simons BD, and Jones PH (2012). A Single Progenitor Population Switches Behavior to Maintain and Repair Esophageal Epithelium. Science. [DOI] [PMC free article] [PubMed] [Google Scholar]
- Doupé DP, Klein AM, Simons BD, and Jones PH (2010). The ordered architecture of murine ear epidermis is maintained by progenitor cells with random fate. Developmental Cell 18, 317–323. [DOI] [PubMed] [Google Scholar]
- Engeland CG, Bosch JA, Cacioppo JT, and Marucha PT (2006). Mucosal wound healing: the roles of age and sex. Arch Surg 141, 1193–7– discussion1198. [DOI] [PubMed] [Google Scholar]
- Keyes BE, Segal JP, Heller E, Lien W-H, Chang C-Y, Guo X, Oristian DS, Zheng D, and Fuchs E (2013). Nfatc1 orchestrates aging in hair follicle stem cells. Proceedings of the National Academy of Sciences 110, E4950–E4959. [DOI] [PMC free article] [PubMed] [Google Scholar]
- Klein AM, Doupé DP, Jones PH, and Simons BD (2007). Kinetics of cell division in epidermal maintenance. Phys Rev E Stat Nonlin Soft Matter Phys 76, 021910. [DOI] [PubMed] [Google Scholar]
- Klein AM, Mazutis L, Akartuna I, Tallapragada N, Veres A, Li V, Peshkin L, Weitz DA, and Kirschner MW (2015). Droplet barcoding for single-cell transcriptomics applied to embryonic stem cells. Cell 161, 1187–1201. [DOI] [PMC free article] [PubMed] [Google Scholar]
- Lalla RV, Sonis ST, and Peterson DE (2008). Management of oral mucositis in patients who have cancer. Dent. Clin. North Am 52, 61–77–viii. [DOI] [PMC free article] [PubMed] [Google Scholar]
- Li L, and Clevers H (2010). Coexistence of quiescent and active adult stem cells in mammals. Science 327, 542–545. [DOI] [PMC free article] [PubMed] [Google Scholar]
- Lim X, Tan SH, Koh WLC, Chau RMW, Yan KS, Kuo CJ, van Amerongen R, Klein AM, and Nusse R (2013). Interfollicular epidermal stem cells self-renew via autocrine Wnt signaling. Science 342, 1226–1230. [DOI] [PMC free article] [PubMed] [Google Scholar]
- Liu S, and Trapnell C (2016). Single-cell transcriptome sequencing: recent advances and remaining challenges. F1000Res 5. [DOI] [PMC free article] [PubMed] [Google Scholar]
- Mackenzie IC (1997). Retroviral Transduction of Murine Epidermal Stem Cells Demonstrates Clonal Units of Epidermal Structure. J. Invest. Dermatol 109, 377–383. [DOI] [PubMed] [Google Scholar]
- Macosko EZ, Basu A, Satija R, Nemesh J, Shekhar K, Goldman M, Tirosh I, Bialas AR, Kamitaki N, Martersteck EM, et al. (2015). Highly Parallel Genome-wide Expression Profiling of Individual Cells Using Nanoliter Droplets. Cell 161, 1202–1214. [DOI] [PMC free article] [PubMed] [Google Scholar]
- Martynoga B, Morrison H, Price DJ, and Mason JO (2005). Foxg1 is required for specification of ventral telencephalon and region-specific regulation of dorsal telencephalic precursor proliferation and apoptosis. Developmental Biology 283, 113–127. [DOI] [PubMed] [Google Scholar]
- Mustafa Baydar MDASIA (2005). Prevention of oral mucositis due to 5fluorouracil treatment with oral cryotherapy. Journal of the National Medical Association 97, 1161. [PMC free article] [PubMed] [Google Scholar]
- Pacal M, and Bremner R (2012). Mapping differentiation kinetics in the mouse retina reveals an extensive period of cell cycle protein expression in post-mitotic newborn neurons. Dev. Dyn 241, 1525–1544. [DOI] [PubMed] [Google Scholar]
- Potten CS (1974). The Epidermal Proliferative Unit: The Possible Role Of The Central Basal Cell. Cell Prolif 7, 77–88. [DOI] [PubMed] [Google Scholar]
- Schindelin J, Rueden CT, Hiner MC, and Eliceiri KW (2015). The ImageJ ecosystem: An open platform for biomedical image analysis. Mol. Reprod. Dev 82, 518–529. [DOI] [PMC free article] [PubMed] [Google Scholar]
- Shreeram S, and Blow JJ (2003). The role of the replication licensing system in cell proliferation and cancer. Prog Cell Cycle Res 5, 287–293. [PMC free article] [PubMed] [Google Scholar]
- Sobecki M, Mrouj K, Colinge J, Gerbe F, Jay P, Krasinska L, Dulic V, and Fisher D (2017). Cell-Cycle Regulation Accounts for Variability in Ki-67 Expression Levels. Cancer Research 77, 2722–2734. [DOI] [PubMed] [Google Scholar]
- Tanaka T, Komai Y, Tokuyama Y, Yanai H, Ohe S, Okazaki K, and Ueno H (2013). Identification of stem cells that maintain and regenerate lingual keratinized epithelial cells. Nat Cell Biol 15, 511–518. [DOI] [PubMed] [Google Scholar]
- Tumbar T, Guasch G, Greco V, Blanpain C, Lowry WE, Rendl M, and Fuchs E (2004). Defining the epithelial stem cell niche in skin. Science 303, 359–363. [DOI] [PMC free article] [PubMed] [Google Scholar]
- Weinreb C, Wolock S, and Klein A (2017). SPRING: a kinetic interface for visualizing high dimensional single-cell expression data. Bioinformatics. [DOI] [PMC free article] [PubMed] [Google Scholar]
- Xouri G, Lygerou Z, Nishitani H, Pachnis V, Nurse P, and Taraviras S (2004). Cdt1 and geminin are down-regulated upon cell cycle exit and are overexpressed in cancer-derived cell lines. Eur. J. Biochem 271, 3368–3378. [DOI] [PubMed] [Google Scholar]
- Zhang H-M, Liu T, Liu C-J, Song S, Zhang X, Liu W, Jia H, Xue Y, and Guo A-Y (2015). AnimalTFDB 2.0: a resource for expression, prediction and functional study of animal transcription factors. Nucl Acids Res 43, D76–D81. [DOI] [PMC free article] [PubMed] [Google Scholar]
Associated Data
This section collects any data citations, data availability statements, or supplementary materials included in this article.
Supplementary Materials
Data Availability Statement
The data that support the findings of this study are available from the corresponding author upon reasonable request. Supplemental Mendeley figures have been deposited online and can be accessed using the following link http://dx.doi.org/10.17632/52fxfdcb5z.1#file-cc3ea306-c20e-4e87-ac73b63b960e2635. Single cell RNAseq data is fully available as GEO project GSE120654.