Abstract
Objective. Hemostasis is a complex physiological process that stops bleeding at the site of a vascular injury. Although the majority of vascular accidents are ischemic, the role of hypercoagulable state and stroke needs further investigation. Materials and Methods. Fresh whole blood was taken from 61 acute ischemic stroke patients and compared to 18 healthy subjects and investigated with optical coherence tomography imaging after initiating coagulation. We used an OCT1300SS system (Thorlabs) and did 3D scans. We then processed the images with ImageJ. For each image mean, integrated density, skewness and kurtosis of gray values were analyzed. Results. Mean gray value and integrated intensity of sampled data showed an intrinsic difference detected with OCT. This difference was further confirmed by the data distribution analysis. Conclusions. Results suggest, that normal blood coagulation, is not a random reaction while in the case of stroke patients, the relatively symmetrical distribution of gray values brings coagulation closer randomized process.
Keywords: cerebral ischemia, coagulation, optical coherence tomography
Introduction
Hemostasis is a complex physiological process that stops bleeding at the site of a vascular injury [1, 2]. It comprises of several steps: (1) primary hemostasis with vasoconstriction and platelet plug formation, (2) secondary hemostasis with the activation of the coagulation cascade and deposition of fibrin, and finally (3) tertiary hemostasis with dissolution of fibrin clot [2, 3]. At its very core, blood coagulation represents a defense mechanism through which blood clots are formed when needed. In most cases this mechanism is helpful, but there are pathological situations it can lead to severe conditions, even potentially life-threatening. During blood coagulation a successively ordered cascade of events occurs, starting with thrombin activation. Thrombin is the enzyme that splits fibrinogen and generates the insoluble fibrin, later to become a mesh in the clot [3, 4].
Local hypercoagulability is one of the leading cause of acute ischemic stroke in adults [5]. Accumulating evidence showed that patients with cerebral thrombosis have a hypercoagulable state before the onset of symptoms [1]. Therefore, it is very important to be able to evaluate patients at risk before stroke onset. Although a lot of tests have been applied to evaluate patients coagulation status, including prothrombin time, partial thromboplastin, and activated clotting time tests, additional methods are required to evaluate hypercoagulability [6]. Most of the tests were performed on plasma as it contains all coagulation factors. Though, to better understand the complex coagulation interactions in whole blood, efforts must be invested towards developing in vitro coagulation tests using whole blood samples instead [7].
Red blood cells are the most numerous cells in blood, but using routine coagulation tests their role in the coagulation process cannot be directly evaluated. Some studies have shown the importance of hematocrit in coagulation times [8, 9]. Red blood cells are trapped by fibrin strands inside the clot, and some researchers believe they may play a role in the blood coagulation process [7].
Recent evidence has suggested that optical coherence tomography (OCT) can be used to evaluate the optical properties of blood. OCT has high sensitivity and micrometer-scale spatial resolution [6]. It is a real time and noninvasive cross-sectional imaging modality that can evaluate soft biological tissues by detecting photons backscattered from the tissue. OCT enables non-invasive visualization of structures and functional analysis of cells in eyes, brain, limbs, reproductive organs and heart [7, 10]. OCT uses low coherence interferometry to enhance an optical signal that is transmitted through or reflected from a biological tissue. Coagulation determines changes in the optical reflections of blood components and OCT signal slope. These changes can be caused by the increasing density of the blood during coagulation once fibrin is formed [7]. OCT assesses the optical density, light transmission or light scattering using the refractive index as an important parameter [6]. The refractive index determines the way light propagates through a medium. The refractive index of plasma is lower when blood is not coagulated, increases with coagulation to become similar to the refractive index of red blood cells. This leads to a decrease in blood scattering and an increase of penetration depth during OCT [7].
In this respect, the aim of our study was to evaluate the coagulation status using OCT in acute ischemic stroke patients.
Material and method
Fresh whole blood was taken, after informing and getting a written consent, from 61 acute ischemic stroke patients (72.75±8.48 years old) and compared to 18 healthy subjects (67.89±11.21 years old). The blood sample was stabilized by 3.2% sodium citrate solution with the volume ratio of 9:1 for anticoagulation purpose.
The coagulation process was initiated by adding calcium chloride (2.5 M with a 1:1 the volume ratio). All measurements were carried out within 7 h after the blood collection.
Optical coherence tomography imaging
OCT imaging was done after adding 200µl of 2.5M CaCl2 to 200µl of blood. We used an OCT system (OCT1300SS, Thorlabs) powered by a swept laser source with central wavelength of 1325nm and a spectral bandwidth of 100nm with an average power of 12mW. The device permits 2D and 3D scan (with an axial-scan rate of 16kHz). Axial and lateral resolutions for air of this system are 12µm and respectively 15µm. The power on sample is 5mW. The signal detection of the OCT device is due to a CCD camera. Images were sampled with a width of 0.5mm, and a depth of 0.5mm. 3D scans were performed over a length of 0.5mm. This is producing a volume image of 512x512x512 pixels (width x depth x length). Final images were obtained by a 8 times averaging. Each OCT imaging procedure was realized using the same set-up parameters for all investigated probes. OCT acquisition was made discontinuously, for 30 seconds at the following time-points: start of the experiment, minutes 4, 9 and 14 after adding CaCl2.
Image analysis
All acquired images were analyzed using ImageJ free software. Sets of consecutive images were converted into stacks, with no other adjustment previously done. After subtracting background by using a 50 pixel “rolling ball diameter” [12] we manually selected regions of interest for each image. Mean gray value, integrated density, skewness (measure of the asymmetry of the probability distribution of a real-valued random variable around its mean) and kurtosis (measure of the "peakedness" of the probability distribution of a real-valued random variable) [13] were calculated for the selected regions of interest. Data generated in this manner were used in our statistical analysis.
Statistical analysis
After aberrant data was deleted, appropriate statistical tests were applied. Repeated ANOVA measurements were used to analyze the results of OCT parameters. Independent data sets were analyzed with Mann-Whitney U-test. Statistical significance was accepted for p<0.05 thus ensuring a level of confidence of 95%. Results are expressed as mean±standard deviation. This study was approved by the ethics committee of the University of Medicine and Pharmacy of Craiova
Results
First we investigated the laser penetration of the sample. This was done manually by measuring the depth of signal. Although in absolute values otherwise unimpressive, the differences were statistically relevant (p<0.01), with a lower penetration in the case of stroke patients (Fig. 1).
Figure 1.
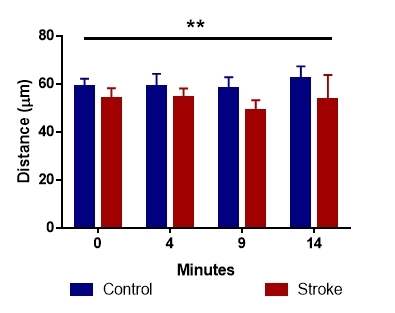
Light beam penetration of blood sample differed significantly in the two analyzed groups
We followed the trend for the mean of the gray values by sampling data every 4-5 minutes, for 15 minutes after the start of the coagulation reaction. We found changes in the reflectivity of blood samples, even at the start of the recording. This difference only got bigger as the reaction continued (Fig. 2), showing an intrinsic difference between the two groups.
Figure 2.
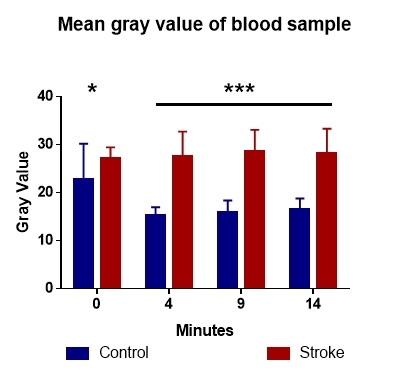
Analysis of gray values identifies a steady decrease of this value in control and an increase in stroke patients
The analysis of the integrated density (the sum of mean gray values of all analyzed pixels) showed the same trend as the mean gray value, but only for the 4, 9 and 14 minutes of sampling, and not at the beginning of the experiment (Fig. 3).
Figure 3.
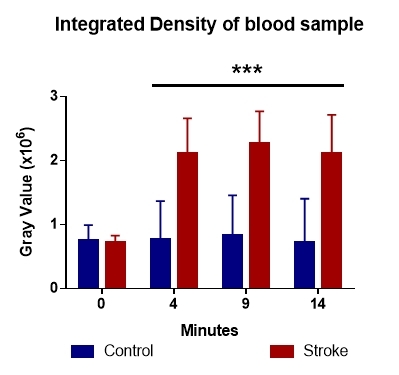
The integrated density of gray values shows differences in blood clotting dynamics
Symmetry of the sampled data
Because of the increased number of measurements in our dataset, we have decided to investigate their distribution. To this end, skewness and kurtosis of the gray values of the pixels forming each acquired image were analyzed.
The skewness analysis revealed an asymmetric distribution of blood reflectivity in the control group, whereas the stroke group recorded symmetrical distribution. (Fig. 4). Both groups showed positive values, with a left skewness of the gray intensity values.
Figure 4.
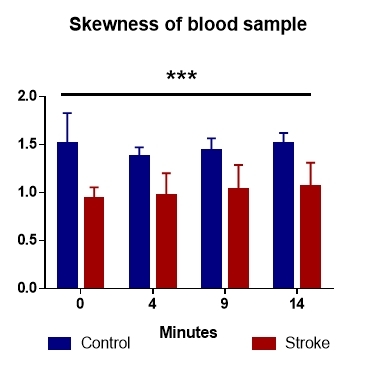
The distribution of gray values revealed an asymmetry in controls, compared with stroke patients
Kurtosis of the gray values in the analyzed sample identifies a wider distribution in the control group compared to the stroke patients (Fig. 5). Statistical analysis of these values revealed differences between the two lots, with p values well below the significance limit, starting at 0.1x10⁻⁶.
Figure 5.
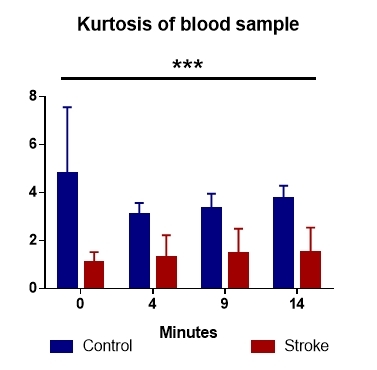
The kurtosis of the two data sets highlights a random coagulation process in patients with stroke compared to the control group
Normal blood coagulation seems not to be random, unlike stroke, where the relatively symmetrical distribution. This may suggest a randomized clotting points (Fig. 5).
Although the majority of vascular accidents are ischemic, and 25% of these are purely embolic, the link between a potential hypercoagulable state and stroke needs further investigation [10, 14]. Moreover, only 5% to 10% of stroke cases were identified as been caused by a primary coagulopathy [15].
Discussion
The link between stroke and coagulation has long been investigated, with limited and unspecific results [10, 14]. Although between 5% to 10% of stroke cases were identified as been caused by a primary coagulopathy [15]. This is backed by global testes as prothrombin time, thromboplastin time or thrombin time that failed to provide differences between stroke patients and controls. Even detailed analysis of clothing factors did not show global differences [10], suggesting that hypercoagulopathy or coagulability changes could occur locally without involving the entire system. The fact that fibrinogen has been showed to be elevated in stroke patients [14], is an indication that certain coagulability changes may be taking place, but elude testing options. The implication of fibrinogen level in altered coagulation is backed by reports that looked at blood coagulation with different amounts of fibrinogen, showing that both low [16] and high [17] levels are detrimental to the physiology of clothing.
Due to the non-invasive and real-time identification of cellular structures in soft or liquid tissues, optical coherence tomography (OCT) has been increasingly used for this type of investigation [18, 19, 20]. Changes in clothing has been reported in normal blood with different hematocrit levels and different anticoagulation substances [6, 7], but to our knowledge OCT has not been used to investigate blood clothing in stroke before. Because of its high sensitivity and micrometer-scale spatial resolution [6], combined with a real time and noninvasive cross-sectional imaging modality that can evaluate soft biological tissues OCT enables non-invasive visualization of structures and functional analysis.
The changes detected with OCT can be caused by the increasing density of the blood during coagulation once fibrin is formed [7, 11]. During blood coagulation a successively ordered cascade of events occurs, that in normal patients, seems to be a targeted process and not a random one. In the case of stroke, maybe due to an increased level of fibrinogen, this targeted process is breaking down, and a more randomized clotting process is happening.
Conclusions
The mean gray value and integrated intensity of sampled data showed an intrinsic difference detected by OCT. This difference was further confirmed by the distribution analysis. It suggests that normal blood coagulation is not due to a random reaction. The same phenomenon does not seem to apply to patients with stroke, where the relatively symmetrical distribution of gray values masks coagulation, in these individuals, a relatively symmetrical process, perhaps due to randomized clotting points.
Acknowledgments
Mirela Diana Sfredel and Emilia Burada had equal contributions to the paper.
References
- 1.Tanaka KA, Key NS, Levy JH. Blood coagulation: hemostasis and thrombin regulation. Anesthesia and analgesia. 2009;108(5):1433–1446. doi: 10.1213/ane.0b013e31819bcc9c. [DOI] [PubMed] [Google Scholar]
- 2.Periayah MH, Halim AS, Mat Saad. Mechanism Action of Platelets and Crucial Blood Coagulation Pathways in Hemostasis. International journal of hematology-oncology and stem cell research. 2017;11(4):319–327. [PMC free article] [PubMed] [Google Scholar]
- 3.Gale AJ. Continuing education course #2: current understanding of hemostasis. Toxicol Pathol. 2011;39(1):273–280. doi: 10.1177/0192623310389474. [DOI] [PMC free article] [PubMed] [Google Scholar]
- 4.Maino A, Rosendaal FR, Algra A, Peyvandi F, Siegerink B. Hypercoagulability Is a Stronger Risk Factor for Ischaemic Stroke than for Myocardial Infarction: A Systematic Review. PLoS One. 2015;10(8):e0133523–e0133523. doi: 10.1371/journal.pone.0133523. [DOI] [PMC free article] [PubMed] [Google Scholar]
- 5.de Lau, Leebeek FW, de Maat, Koudstaal PJ, Dippel DW. Screening for coagulation disorders in patients with ischemic stroke. Expert review of neurotherapeutics. 2010;10(8):1321–1329. doi: 10.1586/ern.10.104. [DOI] [PubMed] [Google Scholar]
- 6.Xu X, Lin J, Fu F. Optical coherence tomography to investigate optical properties of blood during coagulation. Journal of biomedical optics. 2011;16(9):096002–096002. doi: 10.1117/1.3615667. [DOI] [PubMed] [Google Scholar]
- 7.Xu X, Geng J, Liu G, Chen Z. Evaluation of optical coherence tomography for the measurement of the effects of activators and anticoagulants on the blood coagulation in vitro. IEEE Trans Biomed Eng. 2013;60(8):2100–2106. doi: 10.1109/TBME.2013.2245329. [DOI] [PMC free article] [PubMed] [Google Scholar]
- 8.Marlar RA, Potts RM, Marlar AA. Effect on routine and special coagulation testing values of citrate anticoagulant adjustment in patients with high hematocrit values. American journal of clinical pathology. 2006;126(3):400–405. doi: 10.1309/RRQKT2JEYV33D19D. [DOI] [PubMed] [Google Scholar]
- 9.Ujiie H, Kawasaki M, Suzuki Y, Kaibara M. Influence of age and hematocrit on the coagulation of blood. Journal of Biorheology. 2009;23(2):111–114. [Google Scholar]
- 10.Todd M, McDevitt E, McDowell F. Stroke and blood coagulation. Stroke. 1973;4(3):400–405. doi: 10.1161/01.str.4.3.400. [DOI] [PubMed] [Google Scholar]
- 11.Bouma BE, Villiger M, Otsuka K, Oh WY. Intravascular optical coherence tomography [Invited] Biomedical optics express. 2017;8(5):2660–2686. doi: 10.1364/BOE.8.002660. [DOI] [PMC free article] [PubMed] [Google Scholar]
- 12.Sternberg SR. Biomedical Image Processing. Computer. 1983;16(1):22–34. [Google Scholar]
- 13.Westfall PH. Kurtosis as Peakedness, 1905-2014. R.I.P. Am Stat. 2014;68(3):191–195. doi: 10.1080/00031305.2014.917055. [DOI] [PMC free article] [PubMed] [Google Scholar]
- 14.Gaston LW, Brooks JE, Blumenthal HJ, Miller CE. A study of blood coagulation following an acute stroke. Stroke. 1971;2(1):81–87. doi: 10.1161/01.str.2.1.81. [DOI] [PubMed] [Google Scholar]
- 15.Levine S. Hypercoagulable states and stroke: a selective review. CNS Spectrums. 2005;10(7):567–578. doi: 10.1017/s109285290001021x. [DOI] [PubMed] [Google Scholar]
- 16.Grottke O, Braunschweig T, Henzler D, Coburn M, Tolba R, Rossaint R. Effects of different fibrinogen concentrations on blood loss and coagulation parameters in a pig model of coagulopathy with blunt liver injury. Crit Care. 2010;14(2):R62–R62. doi: 10.1186/cc8960. [DOI] [PMC free article] [PubMed] [Google Scholar]
- 17.Wada H, Mori Y, Okabayashi K, Gabazza EC, Kushiya F, Watanabe M, Nishikawa M, Shiku H, Nobori T. High plasma fibrinogen level is associated with poor clinical outcome in DIC patients. American journal of hematology. 2003;72(1):1–7. doi: 10.1002/ajh.10249. [DOI] [PubMed] [Google Scholar]
- 18.Osiac E, Balseanu T-A, Catalin B, Mogoanta L, Gheonea C, Dinescu SN, Albu CV, Cotoi BV, Tica O-S, Sfredel V. Optical coherence tomography as a promising imaging tool for brain investigations. Romanian Journal of Morphology and Embryology. 2014;55(2):507–512. [PubMed] [Google Scholar]
- 19.Osiac E, Balseanu T-A, Mogoanta L, Gheonea DI, Pirici I, Iancau M, Mitran SI, Albu CV, Catalin B, Sfredel V. Optical coherence tomography investigation of ischemic stroke inside a rodent model. Romanian Journal of Morphology and Embryology. 2014;55(3):767–772. [PubMed] [Google Scholar]
- 20.Osiac E, Saftoiu A, Gheonea DI, Mandrila I, Angelescu R. Optical coherence tomography and Doppler optical coherence tomography in the gastrointestinal tract. World journal of gastroenterology. 2011;17(1):15–20. doi: 10.3748/wjg.v17.i1.15. [DOI] [PMC free article] [PubMed] [Google Scholar]


