Abstract
Background
This study aimed to compare superb microvascular imaging (SMI) with grayscale ultrasound (US) and color Doppler flow imaging (CDFI) to evaluate vascular distribution and morphology to distinguish between benign and malignant thyroid nodules.
Material/Methods
Seventy-one patients with 76 thyroid nodules underwent grayscale US, CDFI, and SMI thyroid imaging. CDFI and SMI assessed vascular quantity, morphology, and distribution, and was graded according to Adler’s method, as absent (grade 0), minimal (grade 1), moderate (grade 2), or marked (grade 3). The detection of malignancy was compared between the following imaging groups, grayscale US alone, US combined with CDFI, and US combined with SMI.
Results
SMI was significantly more accurate in identifying malignant thyroid nodules (79.3%) compared with CDFI (55.2%) (P<0.001). In malignant thyroid nodules, penetrating blood vessels were identified by SMI in 62.1% and by CDFI in 41.4%; there was no significant difference in vascular distribution between SMI (P=0.835) and CDFI (P=0.806). Grayscale US with SMI resulted in the greatest diagnostic sensitivity, accuracy, and specificity (86.21%, 85.53%, and 85.11%) compared with grayscale US with CDFI (75.86%, 82.89%, and 87.23%). Receiver operating characteristic (ROC) area under the curve (AUC) values of US with SMI, US with CDFI, and US alone were 0.918 (95% CI, 0.856–0.979), 0.911 (95% CI, 0.849–0.973), and 0.847 (95% CI, 0.762–0.932), respectively (P<0.001).
Conclusions
SMI as an adjunct to grayscale US provided significantly more information on vascularity associated with malignancy in thyroid nodules, when compared with grayscale US or with US and CDFI.
MeSH Keywords: Microvessels; Thyroid Neoplasms; Ultrasonography, Doppler, Color
Background
Thyroid disease is the most common type of endocrine disorder in clinical practice and includes benign and malignant thyroid tumors. The incidence of thyroid cancer has been rapidly increasing during the past few decades [1]. The reasons for the increase in malignant thyroid tumors may be associated with increasing life expectancy and with improved detection methods. Both benign and malignant thyroid tumors can present as thyroid nodules, and these are usually initially investigated by ultrasound [2]. Ultrasonography findings that are associated with malignancy include microcalcification and intra-nodular hypervascularity [3]. Angiogenesis occurs in malignant tumors, including thyroid cancer, with an increase in the number of new vessels within the tumor and perforating the tumor, and abnormal vascular morphology [4]. The formation of new blood vessels is important for local tumor growth, invasion, and distant metastasis of thyroid carcinoma [4].
However, studies on the detection of intra-nodular vascularity in thyroid nodules by color Doppler flow imaging (CDFI) on intra-nodular vascularity in thyroid nodules have shown conflicting results. In a review of the literature, Yang and Fried reviewed 18 studies that included a total of 698 thyroid neoplasms and found that 55.56% of the studies showed increased tumor vascularity in malignancy, while the remaining 44.44% of studies either showed no difference or even reduced vascularity in thyroid carcinoma [5]. These varied findings on the sensitivity of Doppler ultrasonography in identifying tumor microvascularity require further investigation. Identification of the microvasculature on imaging is dependent mainly on the mean Doppler frequency shift which occurs with low-velocity blood flow information. In contrast, the imaging method of superb microvascular imaging (SMI), which is an emerging Doppler ultrasonography method, delineates a broader range of blood flow signals with higher resolution. Therefore, SMI is capable of detecting both low-velocity and high-velocity blood flow, while CDFI cannot image very low flow states due to the different blood flow extraction principles.
To the best of our knowledge, there have been few previously reported studies on the performance of SMI in discriminating between benign and malignant thyroid nodules, based on vessel morphology, blood flow, and distribution. Therefore, a prospective study was undertaken that aimed to compare SMI with grayscale US and CDFI to evaluate vascular distribution and morphology and to distinguish between benign and malignant thyroid nodules.
Material and Methods
Patients and nodules
This prospective clinical study was approved by the Ethics Committee of Shanghai Pudong New Area Peoples’ Hospital. All participants in the study were provided with information about all examinations and procedures and provided informed consent to participate in the study.
From January 2017 to October 2017, 81 patients were identified who had thyroid nodules detected by conventional grayscale ultrasound (US) in our hospital. In total, 76 thyroid nodules in 71 patients (age range, 19–78 years; mean age, 49.62±13.19 years) were recruited for this study. Figure 1 shows the patient selection process. Patients were excluded from the study if they had a history of treatment before the US examination (n=7), or if they had incomplete ultrasound data (n=3). For patients with multiple thyroid nodules, the lesion with the most features of malignancy, or the largest nodule, was selected. The mean diameter of the thyroid nodules was 14.92±3.92 mm (range, 6.7–25.9 mm). All the thyroid nodules were examined histologically following ultrasound-guided fine needle biopsy or following surgical resection, according to standard diagnostic clinical protocols.
Figure 1.
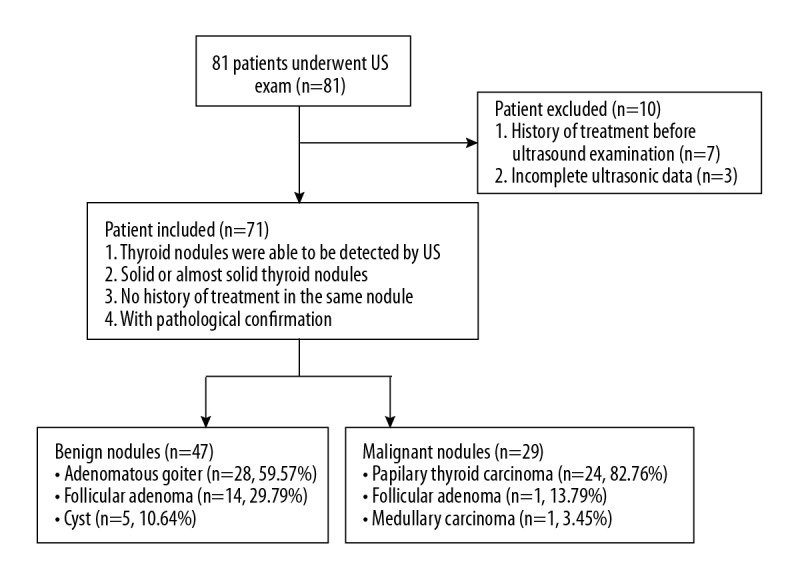
Flowchart of patient selection.
Ultrasound examinations and image interpretation
All patients in the study initially underwent a grayscale US exam. When a thyroid nodule was detected, the nodule size, depth, shape, and other ultrasonic features, including the margin, the presence of a halo sign, echogenicity, and posterior acoustic elements were recorded. Grayscale US was followed by color Doppler flow imaging (CDFI) (frame rate, 10–15 Hz) and superb microvascular imaging (SMI) (frame rate, >50 Hz) to evaluate vascular distribution and morphology. The velocity of SMI was modified to <2.5 centimeters per second. Minimal pressure was applied through the transducer to reduce the risk of vascular compression during imaging. The Toshiba Aplio 500 ultrasound machine (Toshiba Medical System Corporation, Tokyo, Japan) with high frequency (14 Mhz) line array transducers was used in all imaging procedures.
Ultrasound imaging was performed by the same radiologist, who had more than three years of experience in thyroid ultrasonography and one year of experience in SMI. The operator adjusted the focal zone of each lesion to optimize the same imaging area for CDFI and SMI vascular blood flow images so that an imaging area was acquired as a reference area for the thyroid nodule. All the images were recorded and transferred to an internal online hospital database. The images were then evaluated by two radiologists who had ten years and five years of experience in thyroid imaging and two years of experience in SMI. If any disagreement occurred, a third senior radiologist was consulted who had more than 15 years of experience in thyroid ultrasonography and two years of experience in SMI, until a consensus was reached. All three radiologists were unaware of the pathological diagnosis of the thyroid nodule.
Grading used to evaluate malignancy and to evaluate vascularity on imaging of the thyroid nodules
A two-stage grading process was applied to the imaging of the thyroid nodules in each case. The risk of malignancy was determined from the basic ultrasonic features, and was graded as 0 (0–5% risk of malignancy), 1 (6–25% risk of malignancy), 2 (26–50% risk of malignancy), 3 (51–75% risk of malignancy) and 4 (76–100% risk of malignancy).
Secondly, CDFI and SMI assessed vascular quantity, morphology, and distribution, and was graded according to Adler’s method, as absent (grade 0), minimal (grade 1), moderate (grade 2), or marked (grade 3), depending on the amount of blood flow in the region of interest (ROI) [6]. For grade 0, no blood flow was detected; minimal (grade 1) flow included one or two pixels containing flow (<0.1 cm in diameter); moderate (grade 2) flow included a number of small vessels or a main vessel; marked (grade 3) vascularity included the visualization of four or more vessels [6].
Morphological features were evaluated using a five-category descriptive classification, that included not applicable (N/A), linear, dot-like, branching, and penetrating. Vessel distribution was further divided into three categories, peripheral, central, and both peripheral and central. When combined with traditional ultrasound features, two readers were able to calculate the risk of malignancy of each thyroid nodule using both CDFI and SMI examination.
Statistical analysis
The chi-squared (χ2) test or Fisher’s exact test was applied to categorical variables, while an independent t-test was used to compare continuous variables. The findings on new vessel formation from CDFI and SMI were compared between the benign and malignant thyroid nodules using a Wilcoxon rank-sum test. A receiver operating characteristic (ROC) curve was formulated to determine the diagnostic value of CDFI and SMI. The area under the curves (AUCs) of different diagnostic modalities was compared using the chi-squared (χ2) test. The statistical analysis was performed with the histopathology results as the diagnostic gold standard. P-values <0.05 were considered to be statistically significant. Data analysis was performed using the SPSS version 25.0 software package.
Results
Pathological results and basic ultrasound (US) findings
Of the 76 thyroid nodules included in this study, 29 (38.16%) tumors were confirmed to be malignant on histopathology (Figure 1). The malignant lesions were further categorized as papillary thyroid carcinoma (n=24), follicular thyroid carcinoma (n=4), and a medullary carcinoma (n=1). The remaining 47 (61.84%) thyroid nodules were benign lesions that included focal adenomatous goiter (n=28), follicular adenoma (n=14), and benign thyroid cysts (n=5). Conventional ultrasound features such as hypo-echogenicity and microcalcification were significantly more commonly found in malignant thyroid nodules when compared with benign thyroid nodules (p<0.05) (Table 1).
Table 1.
Basic ultrasound (US) findings in study participants with thyroid nodules.
| Characteristics | Malignant | Benign | Total | P-value |
|---|---|---|---|---|
| Gender | 0.521 | |||
| Female | 17 (58.6%) | 24 (51.1%) | 41 (53.9%) | |
| Male | 12 (41.4%) | 23 (48.9%) | 35 (46.1%) | |
| Age | 51.69±11.99 | 48.34±13.84 | 49.62±13.19 | 0.285 |
| Size (mm) | 15.84±4.2 | 14.35±3.67 | 14.92±3.92 | 0.108 |
| Depth (mm) | 0.007* | |||
| Median | 16.90 | 14.30 | 15.20 | |
| Interquartile range (IQR) | 14.05–18.50 | 12.80–17.20 | 12.90–17.30 | |
| Shape | 0.004* | |||
| Taller than wide | 9 (31.0%) | 3 (6.4%) | 12 (15.8%) | |
| Wider than tall | 20 (69.0%) | 44 (93.6%) | 64 (84.2%) | |
| Margin | <0.001* | |||
| Well-defined | 8 (27.6%) | 36 (76.6%) | 44 (57.9%) | |
| Ill-defined | 21 (72.4%) | 11 (23.4%) | 32 (42.1%) | |
| Halo sign | 0.111 | |||
| Absent | 25 (86.2%) | 33 (70.2%) | 58 (76.3%) | |
| Present | 4 (13.8%) | 14 (29.8%) | 18 (23.7%) | |
| Echogenicity | <0.001* | |||
| Markedly hypoechoic | 17 (58.6%) | 7 (14.9%) | 24 (31.6%) | |
| Hypoechoic | 8 (27.6%) | 22 (46.8%) | 30 (39.5%) | |
| Isoechoic | 4 (13.8%) | 10 (21.3%) | 14 (18.4%) | |
| Hyperechoic | 0 (0.0%) | 8 (17.0%) | 8 (10.5%) | |
| Posterior acoustic feature | 0.278 | |||
| Enhancement | 2 (6.9%) | 9 (19.1%) | 11 (14.5%) | |
| Shadowing | 9 (31.0%) | 10 (21.3%) | 19 (25.0%) | |
| None | 18 (62.1%) | 28 (59.6%) | 46 (60.5%) | |
| Composition | 0.134 | |||
| Solid | 27 (93.1%) | 36 (76.6%) | 63 (82.9%) | |
| Cystic portion 0–50% | 2 (6.9%) | 7 (14.9%) | 9 (11.8%) | |
| Cystic portion ≥50% | 0 (0.0%) | 4 (8.5%) | 4 (5.3%) | |
| Calcification | 0.014* | |||
| Microcalcification | 17 (58.6%) | 12 (25.5%) | 29 (38.2%) | |
| Macrocalcification | 4 (13.8%) | 15 (31.9%) | 19 (25.0%) | |
| No | 8 (27.6%) | 20 (42.6%) | 28 (36.8%) |
The microvasculature in thyroid nodules using grayscale ultrasound (US), color Doppler flow imaging (CDFI), and superb microvascular imaging (SMI)
The vascularity of the thyroid nodules was evaluated using Adler’s classification, as shown in Table 2. Both color Doppler flow imaging (CDFI) and superb microvascular imaging (SMI) showed significant differences between the benign and malignant thyroid nodules (p<0.001). CDFI identified vessels in 67.1% (51/76) of thyroid nodules and SMI detected vessels with blood flow in 80.3% (61/76) of thyroid nodules. These findings support that SMI was a superior imaging method for identifying both high-velocity and low-velocity blood flow in new vessels. Based on the identification of the microvasculature, SMI detected 79.3% of malignant thyroid nodules, which contained four or more vessels, while CDFI detected 55.2% of malignant thyroid nodules with increased blood flow signals. The majority of benign nodules were avascular (CDFI: 34.0%; SMI: 29.8%) and hypo-vascular (CDFI: 27.7%; SMI: 17.0%). Also, the morphology of the microvasculature was significantly different between the CDFI and SMI techniques (P<0.05). Penetrating vessels were detected in malignant thyroid nodules using both CDFI and SMI (41.4% and 62.1%, respectively). Benign thyroid nodules were associated with dot-like and linear blood flow patterns. In terms of vessel distribution, malignant thyroid nodules were more frequently found to have central blood flow patterns, and benign thyroid nodules were more frequently found to have both central and peripheral vessels. However, there was no significant difference between benign and malignant thyroid nodules in terms of blood flow patterns using either CDFI (P=0.806) or SMI (P=0.835) imaging.
Table 2.
Vascularity of thyroid nodules using color Doppler flow imaging (CDFI) and superb microvascular imaging (SMI).
| CDFI | SMI | |||||||
|---|---|---|---|---|---|---|---|---|
| Malignant | Benign | z | P | Malignant | Benign | z | P | |
| Vessel number | 3.195 | 0.001* | 4.176 | <0.001* | ||||
| Grade 0 | 4 (13.8%) | 16 (34.0%) | 1 (3.4%) | 14 (29.8%) | ||||
| Grade 1 | 4 (13.8%) | 13 (27.7%) | 2 (6.9%) | 8 (17.0%) | ||||
| Grade 2 | 5 (17.2%) | 9 (19.1%) | 3 (10.3%) | 11 (23.4%) | ||||
| Grade 3 | 16 (55.2%) | 9 (19.1%) | 23 (79.3%) | 14 (29.8%) | ||||
| Vessel morphology | 3.378 | 0.001* | 4.898 | <0.001* | ||||
| Linear | 8 (27.6%) | 21 (44.7%) | 4 (13.8%) | 20 (42.6%) | ||||
| Dot-like | 7 (24.1%) | 25 (53.2%) | 6 (20.7%) | 24 (51.1%) | ||||
| Branching | 2 (6.9%) | 1 (2.1%) | 1 (3.4%) | 2 (4.3%) | ||||
| Penetrating | 12 (41.4%) | 0 (0.0%) | 18 (62.1%) | 1 (2.1%) | ||||
| Vessel distribution | 0.245 | 0.806 | 0.209 | 0.835 | ||||
| Peripheral | 4 (13.8%) | 16 (34.0%) | 1 (3.4%) | 14 (29.8%) | ||||
| Central | 18 (62.1%) | 13 (27.7%) | 23 (79.3%) | 13 (27.7%) | ||||
| Both | 7 (24.1%) | 18 (38.3%) | 5 (17.2%) | 20 (42.6%) | ||||
Grading the risk of malignancy by imaging thyroid nodules and the diagnostic sensitivity of grayscale US, CDFI, and SMI
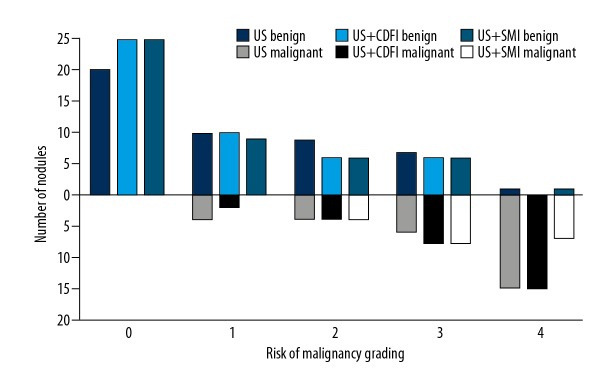
The risk of malignancy in the thyroid nodules was assessed using grayscale US, CDFI, and SMI and compared (Figure 2). On imaging, the features of malignancy were graded as graded from 0–4. Using all three imaging methods, more than half of the nodules that were histologically diagnosed as malignant had a score of 4 using all three ultrasound techniques (US: 51.7%; CDFI: 51.7%; SMI: 58.6%). However, one thyroid nodule that was considered to show features of malignancy by both grayscale US and SMI was histologically confirmed to be a benign adenomatous goiter. When thyroid nodules with a score of 1 or 2 were considered to show benign imaging features, and nodules with a score of 3 or 4 showed features that were associated with malignancy, the sensitivity and specificity for SMI were 86.21%, and 85.53%, respectively; the sensitivity and specificity for CDFI were 75.86%, and 82.89%, respectively; and the sensitivity and specificity for grayscale US alone were 72.41%, and 78.95%, respectively (Figure 3). The receiver operating characteristic (ROC) area under the curve (AUC) values for SMI, CDFI, and grayscale US were 0.918 (95% CI, 0.856–0.979), 0.911 (95% CI, 0.849–0.973), and 0.847 (95% CI, 0.762–0.932), respectively (Table 3). There was a significant difference in the AUC for grayscale US and CDFI compared with grayscale US and SMI (χ2=18.461; P<0.001).
Figure 2.
Risk of malignancy in thyroid nodules, graded by grayscale ultrasound (US), color Doppler flow imaging (CDFI), and superb microvascular imaging (SMI), using the combination of US, US + CDFI, and US + SMI.
Figure 3.
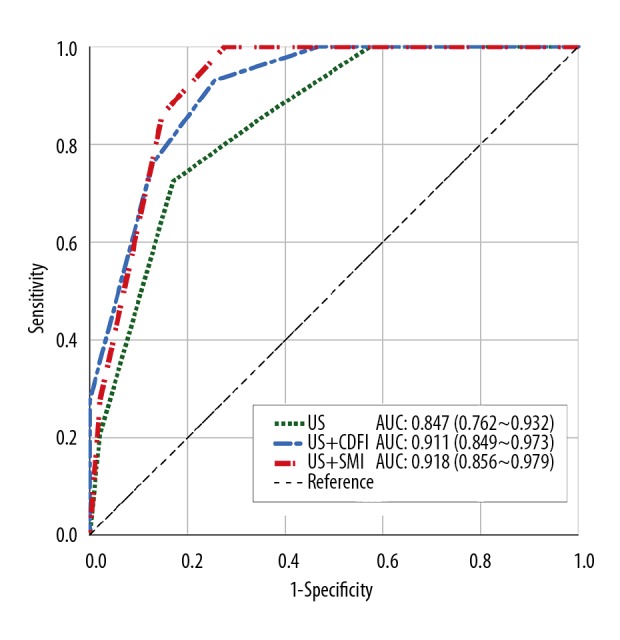
The receiver operating characteristic (ROC) and area under the curve (AUC) for the three diagnostic modalities of grayscale ultrasound (US), color Doppler flow imaging (CDFI), and superb microvascular imaging (SMI).
Table 3.
Comparison of the diagnostic performance of the three imaging modalities, superb microvascular imaging (SMI), grayscale ultrasound (US), and color Doppler flow imaging (CDFI) of thyroid nodules.
| Sensitivity | Specificity | Accuracy | AUC | 95% CI | P-value | |
|---|---|---|---|---|---|---|
| US | 72.41% | 82.98% | 78.95% | 0.847 | 0.762~0.932 | <0.001 |
| US+CDFI | 75.86% | 87.23% | 82.89% | 0.911 | 0.849~0.973 | <0.001 |
| US+SMI | 86.21% | 85.11% | 85.53% | 0.918 | 0.856~0.979 | <0.001 |
US – ultrasound; CDFI – color Doppler flow imaging; SMI – superb microvascular imaging; AUC – area under the curve; CI – confidence interval.
Discussion
Angiogenesis and the growth of irregular vascular structures have been identified as a distinguishing feature in malignancy. Several previously published studies have shown that peri-nodular blood flow was more commonly associated with benign thyroid nodules, whereas intra-nodular blood flow tended to be present in malignancy [7–9]. Therefore, evaluation of the variation in vascularity signatures may offer valuable diagnostic criteria for the diagnosis of malignancy in thyroid nodules. Clinically, grayscale ultrasound (US) is often used as a first-line diagnostic examination. Compared with magnetic resonance imaging (MRI) and contrast-enhanced ultrasonography, Doppler ultrasound has the advantage of convenience of use, lower cost, and it is a non-invasive technique.
Color Doppler flow imaging (CDFI) is widely available and is a non-invasive imaging technique that provides valuable data for evaluating bloodstream signals, but with the limitation in identifying blood vessels that are less than 0.1 mm in diameter. Therefore, CDFI is generally associated with data loss due to movement artifacts from the single-dimension filter. Following recent developments in ultrasound imaging technology, superb microvascular imaging (SMI) is a technique that can visualize low-flow blood vessels without motion artifact. These advantages of SMI have recently been demonstrated in studies that have examined microvascular blood flow in breast tumors [10], testicular tumors [11], and endoleaks following endovascular aneurysm repair (EVAR) [12].
Previously published studies have confirmed the value of superb microvascular imaging (SMI) in visualizing very small blood vessels and low flow with high resolution as well as fewer movement artifacts. Machado et al. evaluated microvascular blood flow in 25 thyroid nodules in 22 patients and showed that SMI resulted in improved visualization of the microvasculature, including with low flow, when compared with both CDFI and power Doppler imaging techniques [13]. Lu et al. examined 52 thyroid nodules, including 39 malignant and 13 benign nodules, and found that SMI was capable of identifying more small microvascular branches when compared with CDFI [14]. These previous findings support the findings of the present study, which showed that SMI detected the presence of vessels in 61 thyroid nodules (80.26%) while CDFI identified microvascular blood flow in 56 nodules (73.68%), among non-vascular thyroid nodules, only one was shown to be malignant on histology.
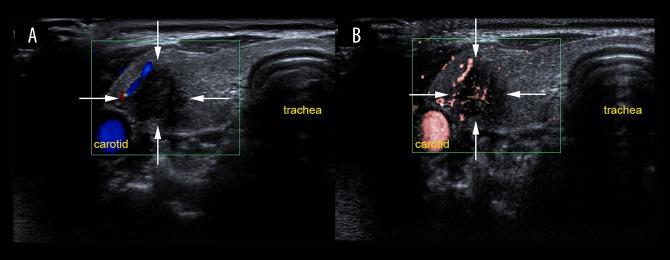
The enhanced ability to visualize the microvasculature in thyroid nodules has been attributed to the different vessel imaging extraction methods. CDFI is dependent on the wall filter to decrease clutter and motion artifacts, and as a result, low-flow components are lost. However, SMI applies an updated adaptive algorithm to analyze and suppress clutter motion and can identify both high-velocity and low-velocity blood flow due to the reduction in movement artifacts. According to the grading of vascular quantity, morphology, and distribution using Adler’s method, the findings of the present study showed that malignant thyroid neoplasms had more than four vessels. Specifically, 79.3% of the malignant thyroid nodules were rated as grade 3 using SMI, whereas CDFI classified 55.2% of the malignant thyroid nodules as grade 3. Malignant thyroid nodules possessed enriched blood flow signals of neoplastic angiogenesis (Figure 4). Malignant and benign lesions have previously been shown to have distinctive degrees of neovasculature in breast tumors [15]. Angiogenesis has a close relationship with neoplastic proliferation, and the thyroid has been considered as a model for the integrated control of angiogenesis [16]. Previous studies have also been conducted to investigate vascular morphology and distribution using SMI to distinguish between malignant and benign breast lesions. Zhan et al. showed that SMI identified an increase in the median number of penetrating vessels when compared with CDFI [17]. Xiao et al. showed that penetrating, spiculated, or radial vessels were associated with the risk of malignancy on imaging [18].
Figure 4.
Evaluation of vascularity in a lesion located in the right thyroid lobe on color Doppler flow imaging (CDFI) and superb microvascular imaging (SMI) in a 31-year-old woman. (A) Color Doppler flow imaging (CDFI) shows peripheral vascularization on the top left of the thyroid nodule (grade 1). (B) Superb microvascular imaging (SMI) shows both peripheral and central vascularity (grade 2) with some linear and branching small vessels. The thyroid nodule was diagnosed histologically as a papillary thyroid carcinoma.
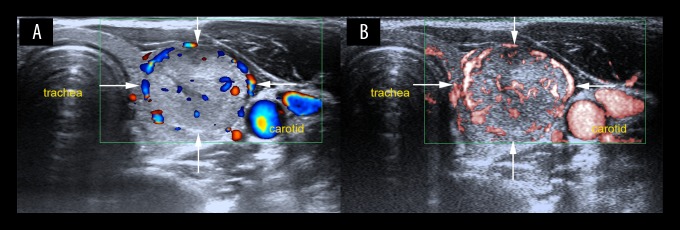
In the present study, there was a significant difference between benign and malignant thyroid nodules using both CDFI and SMI (Figure 5). Penetrating vessels were mainly detected in malignant nodules by SMI (62.1%) with increased sensitivity in identifying penetrating vessels when compared with CDFI (41.4%). However, one benign nodule also had enriched and penetrating vessels using SMI, which was a follicular adenoma with the diameter of 6.7 mm and was hyperechoic due to fibrosis, which was misinterpreted as a blood flow signal. In this study, there was no statistical difference between CDFI and SMI in identifying the distribution of vascularity in thyroid nodules. Therefore, the findings of the present study re-confirmed that both the number and morphology of vessels are important parameters for differentiating between benign and malignant thyroid nodules. In malignancy, there is an overgrowth of immature capillaries from the surrounding vessels to the inside of the lesions.
Figure 5.
Color Doppler flow imaging (CDFI) and superb microvascular Imaging (SMI) show increased vascularity in a lesion located in the left thyroid lobe in a 25-year-old woman. (A) Color Doppler flow imaging (CDFI) shows peripheral and central vascularization (Grade 2) with linear and dot-like vessels. (B) Superb microvascular imaging (SMI) shows peripheral and central vascularity (Grade 3) with more linear and branching small vessels. The thyroid nodule was diagnosed histologically as a follicular adenoma.
In this study, the imaging specialists graded all 76 thyroid nodules using a grading system for the risk of malignancy, which showed that SMI was showed good diagnostic sensitivity (86.21%, 25/29), diagnostic accuracy (85.53%, 65/76) as an adjunct to grayscale US while retaining high diagnostic specificity (85.11%, 40/47) (Table 3). The ability of SMI to extract microvascular information might lead to an increase in false-positive cases. For example, using SMI, one adenomatous goiter was identified that had rich blood flow signals, including penetrating vessels, and together with other imaging features, the nodule was upgraded from score of 2 in the US and CDFI group to a score of 3 in the US and SMI group, making this a false-positive case on imaging alone.
This study had several limitations. First, all the imaging examinations were conducted by the same radiologist, which did not allow for inter-observer analysis and which could have introduced interpretation bias. Second, the study was conducted in a single center with a limited study size and limited thyroid pathology types. Third, other vascular features that have been shown to be highly correlated with tumor growth and metastasis, such as microvascular density the expression of the vascular endothelial growth factor (VEGF) receptor in tumor tissue was not examined in our study. Therefore, future large-scale, controlled, multicenter studies are recommended with the inclusion of tissue-based studies on angiogenesis in thyroid nodules.
Conclusions
This study compared superb microvascular imaging (SMI) with grayscale ultrasound (US) and color Doppler flow imaging (CDFI) to evaluate vascular distribution and morphology to distinguish between benign and malignant thyroid nodules in 71 patients with 76 thyroid nodules. The findings showed that when compared with conventional grayscale ultrasonography US, SMI was superior for identifying and characterizing tumor angiogenesis. Compared with CDFI, SMI was able to identify low-velocity blood flow without being affected by motion artifacts. As an adjunct to grayscale US, SMI showed a significantly improved diagnostic performance in differentiating between benign and malignant thyroid nodules than either US alone or US with CDFI.
Footnotes
Source of support: This study was supported by Pu Dong New Area Health and Family Planning Commission Subject Leader Course Project (No. PWRd 2017-06) and Pu Dong New Area Health and Family Planning Commission Important Vulnerable Course Project (No. PWzbr 2017-10)
Conflict of interest
None.
References
- 1.Sadrzadeh H, Kline G. Thyroid. 1st edition. Vol. 2. Elsevier; The Netherlands: 2017. Endocrine biomarkers; pp. 41–93. Chapter 2. [Google Scholar]
- 2.Haugen BR, Alexander EK, Bible KC, et al. 2015 American Thyroid Association management guidelines for adult patients with thyroid nodules and differentiated thyroid cancer: the American Thyroid Association guidelines task force on thyroid nodules and differentiated thyroid cancer. Thyroid. 2016;26:1–133. doi: 10.1089/thy.2015.0020. [DOI] [PMC free article] [PubMed] [Google Scholar]
- 3.Chomsky-Higgins KH, Nydam TL, McIntyre RC, Palmer BJA. Chapter 62. Thyroid nodules and cancer. In: Harken AH, Moore E, editors. Abernathy’s Surgical Secrets. 7th Edition. Vol. 62. Elsevier; The Netherlands: 2018. pp. 271–76. [Google Scholar]
- 4.Weidner N, Semple JP, Welch WR, Folkman J. Tumor angiogenesis and metastasis – correlation in invasive breast carcinoma. N Engl J Med. 1991;324:1–8. doi: 10.1056/NEJM199101033240101. [DOI] [PubMed] [Google Scholar]
- 5.Yang GC, Fried KO. Most thyroid cancers detected by sonography lack intranodular vascularity on color doppler imaging: Review of the literature and sonographic-pathologic correlations for 698 thyroid neoplasms. J Ultrasound Med. 2017;36(1):89–94. doi: 10.7863/ultra.16.03043. [DOI] [PubMed] [Google Scholar]
- 6.Adler DD, Carson PL, Rubin JM, Quinn-Reid D. Doppler ultrasound color flow imaging in the study of breast cancer: Preliminary findings. Ultrasound Med Biol. 1990;16:553–59. doi: 10.1016/0301-5629(90)90020-d. [DOI] [PubMed] [Google Scholar]
- 7.Kim DW, Jung SJ, Eom JW, Kang T. Color Doppler features of solid, round, isoechoic thyroid nodules without malignant sonographic features: A prospective cytopathological study. Thyroid. 2013;23:472–76. doi: 10.1089/thy.2012.0238. [DOI] [PubMed] [Google Scholar]
- 8.Kim DW, In HS, Choo HJ, et al. Solid and isoechoic thyroid nodules without malignant sonographic features: Comparison of malignancy rate according to nodule size, shape and color Doppler pattern. Ultrasound Med Biol. 2013;39:269–74. doi: 10.1016/j.ultrasmedbio.2012.09.018. [DOI] [PubMed] [Google Scholar]
- 9.Papini E, Guglielmi R, Bianchini A, et al. Risk of malignancy in nonpalpable thyroid nodules: Predictive value of ultrasound and color-Doppler features. J Clin Endocrinol Metab. 2002;87:1941–46. doi: 10.1210/jcem.87.5.8504. [DOI] [PubMed] [Google Scholar]
- 10.Ma Y, Li G, Li J, Ren WD. The diagnostic value of superb microvascular imaging (SMI) in detecting blood flow signals of breast lesions: A preliminary study comparing SMI to color Doppler flow imaging. Medicine (Baltimore) 2015;94(36):e1502. doi: 10.1097/MD.0000000000001502. [DOI] [PMC free article] [PubMed] [Google Scholar]
- 11.Durmaz MS, Sivri M. Comparison of superb micro-vascular imaging (SMI) and conventional Doppler imaging techniques for evaluating testicular blood flow. J Med Ultrason. 2018;45(3):443–52. doi: 10.1007/s10396-017-0847-9. [DOI] [PubMed] [Google Scholar]
- 12.Gabriel M, Tomczak J, Snoch-Ziółkiewicz M, et al. Comparison of superb micro-vascular ultrasound imaging (SMI) and contrast-enhanced ultrasound (CEUS) for detection of endoleaks after endovascular aneurysm repair (EVAR) Am J Case Rep. 2016;17:43–46. doi: 10.12659/AJCR.895415. [DOI] [PMC free article] [PubMed] [Google Scholar]
- 13.Machado P, Segal S, Lyshchik A, Forsberg F. A novel microvascular flow technique: Initial results in thyroids. Ultrasound Q. 2016;32:67–74. doi: 10.1097/RUQ.0000000000000156. [DOI] [PubMed] [Google Scholar]
- 14.Lu R, Meng Y, Zhang Y, et al. Superb microvascular imaging (SMI) compared with conventional ultrasound for evaluating thyroid nodules. BMC Med Imaging. 2017;17:65. doi: 10.1186/s12880-017-0241-5. [DOI] [PMC free article] [PubMed] [Google Scholar]
- 15.Less JR, Skalak TC, Sevick EM, Jain RK. Microvascular architecture in a mammary carcinoma: Branching patterns and vessel dimensions. Cancer Res. 1991;51:265–73. [PubMed] [Google Scholar]
- 16.Ramsden JD. Angiogenesis in the thyroid gland. J Endocrinol. 2000;166:475–80. doi: 10.1677/joe.0.1660475. [DOI] [PubMed] [Google Scholar]
- 17.Zhan J, Diao XH, Jin JM, et al. Superb microvascular imaging. A new vascular detecting ultrasonographic technique for avascular breast masses: A preliminary study. Eur J Radiol. 2016;85:915–21. doi: 10.1016/j.ejrad.2015.12.011. [DOI] [PubMed] [Google Scholar]
- 18.Xiao XY, Chen X, Guan XF, et al. Superb microvascular imaging in diagnosis of breast lesions: A comparative study with contrast-enhanced ultrasonographic microvascular imaging. Br J Radiol. 2016;89(1066):20160546. doi: 10.1259/bjr.20160546. [DOI] [PMC free article] [PubMed] [Google Scholar]


