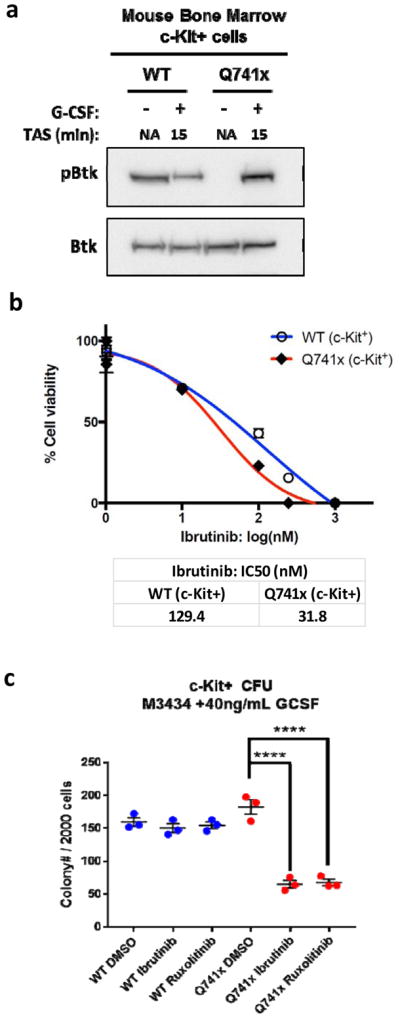
Figure 5. Activation of Btk in the primary bone marrow cells of Q741x mutant mice.

(a) Representative immunoblots using lysates of c-Kit+ bone marrow cells after 2 hour serum starvation and G-CSF stimulation (TAS: Time after Stimulation). The experiment was performed twice (n=2). (b) Ibrutinib dose curves of c-Kit+ bone marrow cell viability. IC50 values were calculated in Prism statistical analysis software using the three-parameter logistic method. The experiment was performed in three independent biological replicates (n=3). (c) Graphical representation of the colony forming units (CFU) of murine c-Kit+ bone marrow cells. The results represent three independent biological replicates (n=3) (**** = p value < 0.0001, student t-test).
