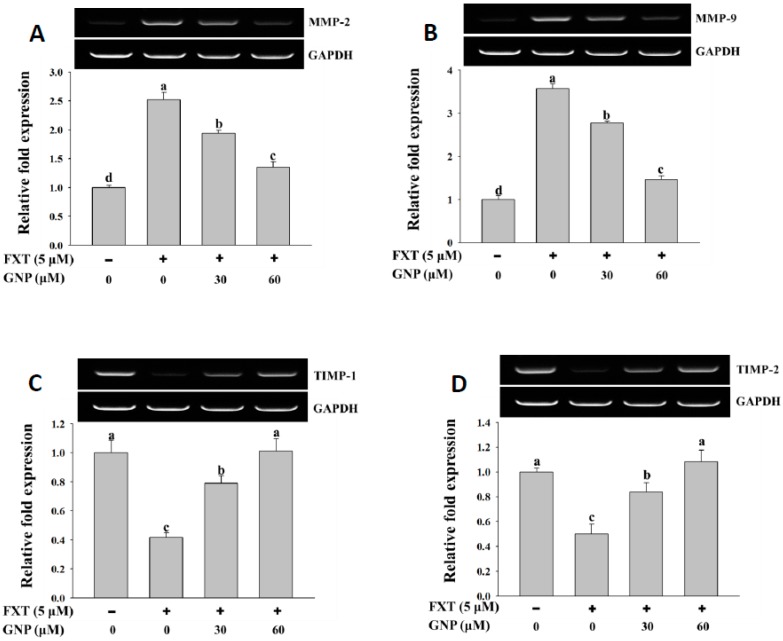
Figure 4.
RT-PCR analysis of MMP-2 (A), MMP-9 (B), TIMP-1 (C) and TIMP-2 (D) gene expression in HepG2 cells after treatment with FXT and the attenuating effect of GNP. HepG2 cells were seeded onto a 6-well plate and incubated overnight, treated with FXT and GNP at dose as indicated and further incubated for 72 h. DMSO (1%) was used as vehicle control. Values are expressed as mean ± SD (n = 3). Different letters indicate statistical significance (p < 0.05).

