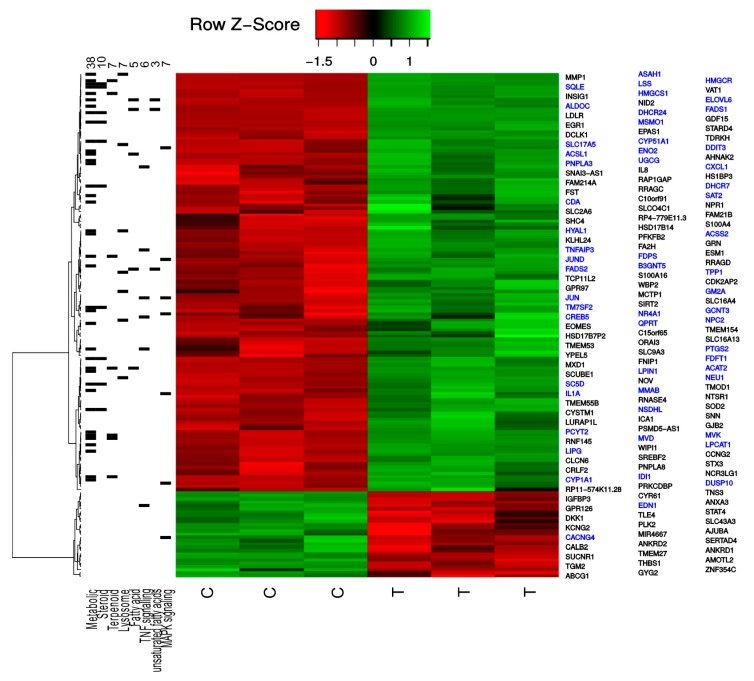
Figure 4.
Heatmap depicting the normalized expression values for the significant regulated proteins with more than 1.5-fold, including the most enriched KEGG pathways. The left side indicates the expressed genes for each of the most enriched KEGG pathways. The left top numbers indicate the number of significantly altered mRNAs that was identified from each of the KEGG pathways. The genes highlighted in blue belong to at least one of the indicated KEGG pathways.

