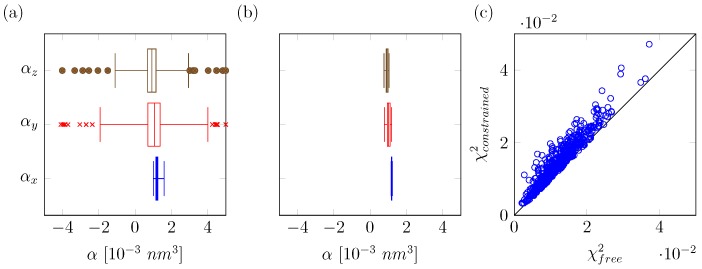
Figure 2.
(a) box plots of the calculated polarizabilities in either x-, y- or z-dimension using the original fitting method per solvent configuration; (b) box plots of the calculated polarizabilities in either x-, y- or z-dimension using the new consensus fitting approach for polarizabilities. In panels (a,b), data are partitioned after sorting into four quartiles, and boxes depict the inter-quartile-range (irq) with a middle line that denotes the median. The whiskers are placed at the minimum and maximum values considered, with a maximum deviation of 4.0 times the irq. Outliers are denoted by circles (for ) and crosses (for ); (c) error in fit () as obtained from the free unconstrained original fit (free) and compared to the constrained consensus-fit error in fit.

