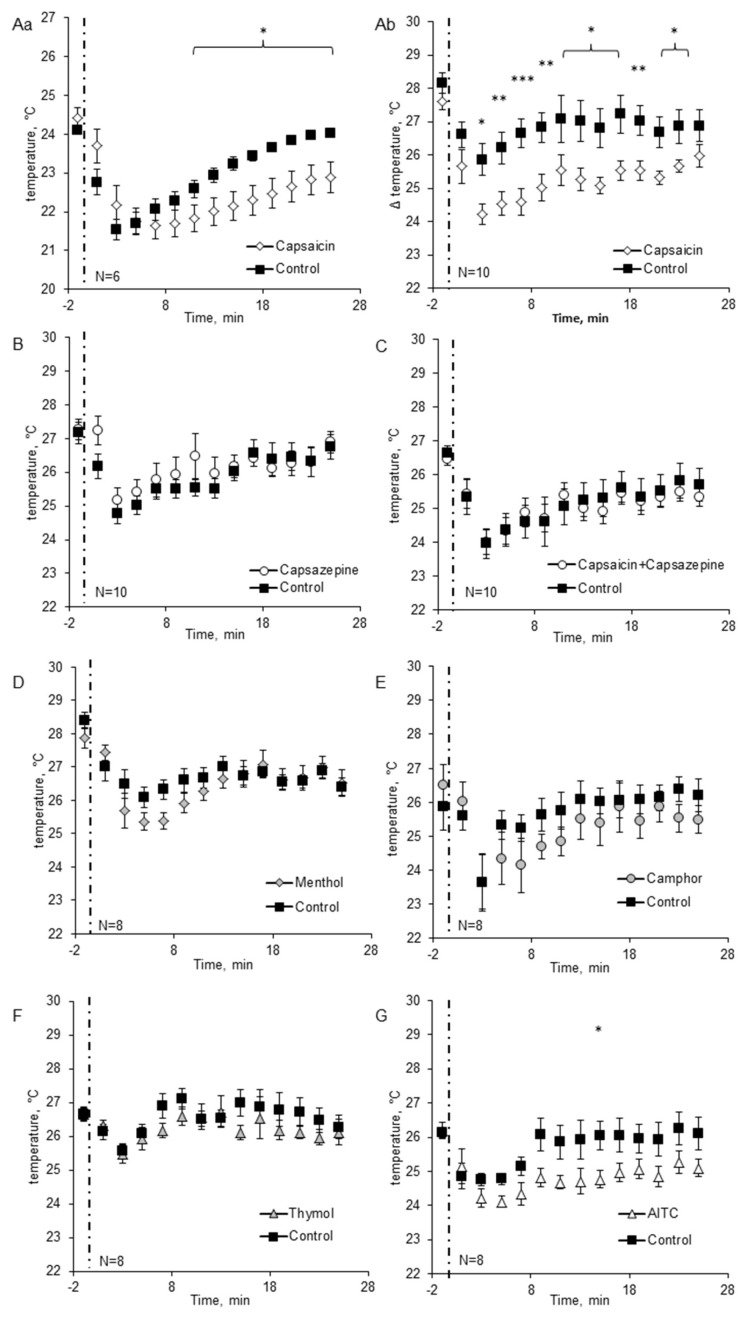
Figure 2.
The temperature of the head of the cockroaches treated with TRP ligands (A). Changes of head temperature induced by 1 µM capsaicin measured using (a) thermocouple system and (b) thermal camera. Changes of the head temperature induced by 1 µM capsazepine (B), 1 µM capsazepine + 1 µM capsaicin (C), 0.1 mM menthol (D), 10 mM camphor (E), 1 mM thymol (F) and 0.1 mM AITC (G) measured with thermal camera. Time of application of tested substances is marked by dashed line. Data are presented as mean ± standard error of the mean (SEM). Note that the first data points on each graph refer to the moment just before the application. * indicates values significantly different vs. control group: * p < 0.05; ** p < 0.01; *** p < 0.001; least significant difference (LSD) test. The group sizes are indicated on the figure.

