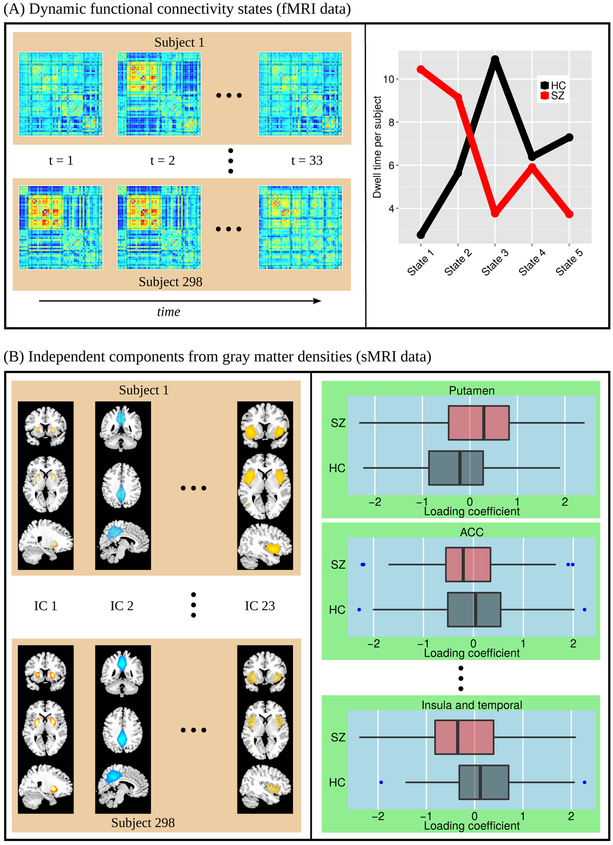
Figure 3:
sMRI and dynamic fMRI features used as input and output of the translation model. (A) Dynamic functional connectivity (dFNC) features as dFNC state sequence. Left panel shows examples of time sequences of dFNC states transitioned by each subject. Right panel shows group-average dwell time per subject for each of the five transient states. (B) Loading coefficients as sMRI features (left panel: each subject has a set of 23 values for the corresponding loading coefficients and right panel: box-plot of loading coefficients between HCs and patients with SZ.

