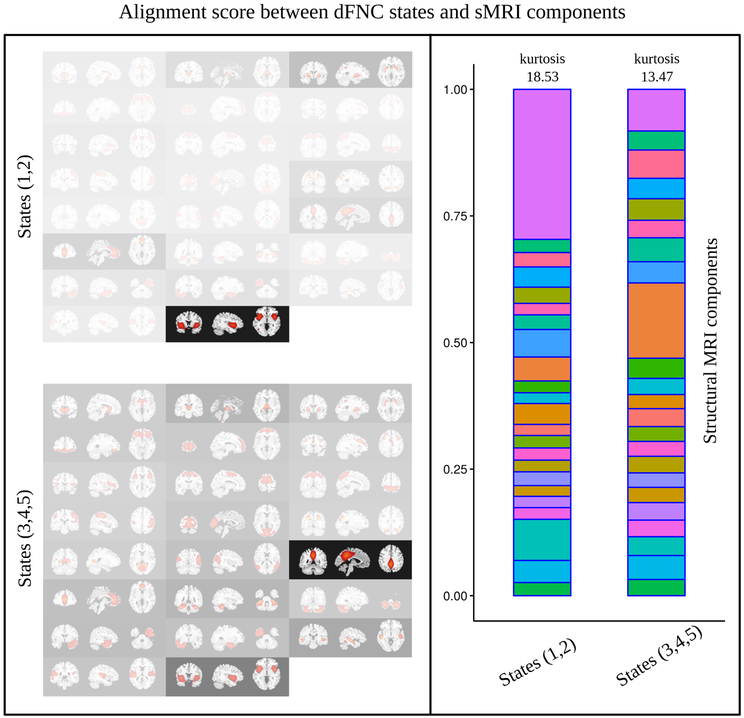
Figure 4:
Left panel: alignment scores between dFNC states and structural components depicted as over-layed transparency masks. The higher the alignment score higher the transparency. Top diagram shows alignments averaged over dFNC states 1 and 2 (wherein patients with SZ made more transitions). Bottom diagram presents alignments averaged over dFNC states 3, 4, and 5 (wherein the HCs made more transitions). Right panel: Same alignment scores (of left panel) shown as stacked plots. In each stack, alignment scores sum to 1.0 over 23 structural components (colors are provided to match each structural component in both of the stacks as a visual aid. From bottom to top: caudate, thalamus, putamen, orbitofrontal, medial frontal, middle frontal, inferior frontal, SMA, superior parietal, right post central, cuneus and visual, middle occipital, calcarine, middle temporal and occipital, precuneus and posterior cingulate cortex, anterior cingulate cortex, upper cerebellum, lower cerebellum, right inferior temporal, left inferior temporal, middle temporal, superior temporal, and insula and temporal, respectively.

