

Abstract
Background:
The objective of this study was to develop and validate a short form of the Patient Health Questionnaire-9 (PHQ-9), a self-report questionnaire for assessing depressive symptomatology, using objective criteria.
Methods:
Responses on the PHQ-9 were obtained from 7,850 English-speaking participants enrolled in 20 primary diagnostic test accuracy studies. PHQ unidimensionality was verified using confirmatory factor analysis, and an item response theory model was fit. Optimal test assembly (OTA) methods identified a maximally precise short form for each possible length between 1 and 8 items, including and excluding the 9th item. The final short form was selected based on pre-specified validity, reliability, and diagnostic accuracy criteria.
Results:
A 4-item short form of the PHQ (PHQ-Dep-4) was selected. The PHQ-Dep-4 had a Cronbach’s alpha of 0.805. Sensitivity and specificity of the PHQ-Dep-4 were 0.788 and 0.837, respectively, and were statistically equivalent to the PHQ-9 (sensitivity = 0.761, specificity = 0.866). The correlation of total scores with the full PHQ-9 was high (r = 0.919).
Conclusion:
The PHQ-Dep-4 is a valid short form with minimal loss of information of scores when compared to the full-length PHQ-9. Although OTA methods have been used to shorten patient-reported outcome measures based on objective, pre-specified criteria, further studies are required to validate this general procedure for broader use in health research. Furthermore, due to unexamined heterogeneity, there is a need to replicate the results of this study in different patient populations.
Keywords: Depression, Patient Health Questionnaire, Psychometrics, Patient outcome assessment
Introduction
In mental health research and clinical practice, self-report symptom measures are used to assess patient symptoms and identify patients with undetected mental disorders. Completing these measures is demanding, especially when people are asked to respond to multiple measures that each contain multiple items (Coste et al., 1997; Goetz, Lemetayer, & Rat, 2013; Kruyen, Emons, & Sijtsma, 2013; Stanton, Sinar, Balzer., & Smith, 2002). Therefore, researchers attempt to create shortened versions with scores that perform comparably well with original full-length versions (Coste et al., 1997; Goetz et al., 2013; Kruyen et al., 2013; Stanton, Sinar, Balzer, & Smith, 2002). (Goetz et al., 2013)
The Patient Health Questionnaire-9 (PHQ-9) is a 9-item, self-report questionnaire that measures depressive symptomatology (Kroenke et al., 2009; Kroenke & Spitzer, 2002; Kroenke, Spitzer, & Williams, 2001). A recent meta-analysis of the PHQ-9 found that at the standard cutoff of 10, based on 34 studies, the sensitivity and specificity were 0.78 and 0.87, respectively (Moriarty, Gilbody, McMillan, & Manea, 2015).
The PHQ-8 is similar to the PHQ-9 and is increasingly used because it eliminates one item that asks about patients’ thoughts of either self-harm or being “better off dead” (Kroenke & Spitzer, 2002), but it identifies large numbers of patients not at risk of suicide (Dube, Kroenke, Bair, Theobald, & Williams, 2010; Razykov, Hudson, Baron, & Thombs, 2013). Many studies have reported that the PHQ-8 performs nearly identically to the PHQ-9 (Corson, Gerrity, & Dobscha, 2004; Kroenke & Spitzer, 2002; Leadbeater, Carruthers, Green, Rosser, & Field, 2011; Razykov et al., 2013).
The PHQ-2 is another short-form, designed to include the two core items in a Diagnostic and Statistical Manual of Mental Disorders (DSM) Major Depressive Disorder (MDD) diagnosis: depressed mood and anhedonia (Kroenke, Spitzer, & Williams, 2003). A recent meta-analysis of the PHQ-2 found that at a cutoff of 2, based on 17 studies, the sensitivity and specificity were 0.91 and 0.70, respectively, while at a cutoff of 3, based on 19 studies, the sensitivity and specificity were 0.76 and 0.87, respectively (Manea et al., 2016).
Conventionally, short forms of patient-report measures are created through an expert-based analysis of item content, as with the PHQ-2, or by removing items with minimal factor loadings (Goetz et al., 2013). These methods are not typically applied in a systematic way, and multiple shortened versions of the same measure may exist (Coste et al., 1997; Goetz et al., 2013; Kruyen et al., 2013; Smith, McCarthy, & Anderson, 2000; Stanton, Sinar, Balzer, & Smith, 2002). Methods such as item response theory (IRT; van der Linden & Hambleton, 1997) have been used to evaluate and identify problematic items, but have not incorporated objective and reproducible criteria for item selection.
Optimal test assembly (OTA) is a mixed-integer programming procedures that uses an estimated IRT model to select the subset of items that best satisfies pre-specified constraints (van der Linden, 2006). Although more commonly used in the development of high-stakes educational tests (Holling, Kuhn, & Kiefer, 2013), a recent study demonstrated that OTA can be used to develop shortened versions of patient-reported outcome measures (A. W. Levis et al., 2016). This procedure was also shown to be replicable, reproducible, and produce shortened forms of minimal length as compared with leading alternative methods (Harel & Baron, 2018).
The objective of the present study was to apply OTA to develop a shortened version of the PHQ-9. We (1) used confirmatory factor analysis to verify the unidimensionality of the underlying construct; (2) applied OTA methods to obtain candidate forms of each possible length; and (3) selected the shortest possible form that showed similar performance to the full form in terms of pre-specified validity, reliability, and diagnostic accuracy criteria, compared to the PHQ-9 as the full-form standard.
MATERIALS AND METHODS
This study used a subset of data accrued for an individual participant data meta-analysis (IPDMA) on the diagnostic accuracy of the PHQ-9 depression screening tool to detect major depression (in progress). The IPDMA was registered in PROSPERO (CRD42014010673), and a protocol was published (Thombs et al., 2014).
Search Strategy
A medical librarian searched Medline, Medline In-Process & Other Non-Indexed Citations via Ovid, PsycINFO, and Web of Science (January 2000 - December 2014) on February 7, 2015, using a peer-reviewed search strategy (Supplementary Methods 1). We also reviewed reference lists of relevant reviews and queried contributing authors about non-published studies. Search results were uploaded into RefWorks (RefWorks-COS, Bethesda, MD, USA). After de-duplication, unique citations were uploaded into DistillerSR (Evidence Partners, Ottawa, Canada), for storing and tracking search results.
Identification of Eligible Studies for Full IPDMA
Datasets from articles in any language were eligible for inclusion if they included diagnostic classifications for current MDD or Major Depressive Episode (MDE) based on a validated semi-structured or fully structured interview conducted within two weeks of PHQ-9 administration, among participants ≥18 years and not recruited from youth or psychiatric settings. Datasets where not all participants were eligible were included if primary data allowed selection of eligible participants. For defining major depression, we considered MDD or MDE based on the DSM or MDE based on the International Classification of Diseases (ICD). If more than one was reported, we prioritized DSM over ICD and DSM MDE over DSM MDD. Across all studies, there were 23 discordant diagnoses depending on classification prioritization (0.1% of participants).
Two investigators independently reviewed titles and abstracts for eligibility. If either deemed a study potentially eligible, full-text review was completed by two investigators, independently, with disagreements resolved by consensus, consulting a third investigator when necessary. Translators were consulted to evaluate titles, abstracts and full-text articles.
Data Contribution and Synthesis
Authors of eligible datasets were invited to contribute de-identified primary data. We compared published participant characteristics and diagnostic accuracy results with results from raw datasets and resolved any discrepancies in consultation with the original investigators.
Data Selection for Present Study
We restricted our dataset to participants who completed the PHQ-9 in English, due to the potential for heterogeneity across studies conducted in different languages. We excluded studies that classified major depression using the Mini International Neuropsychiatric Interview (MINI), because it is structurally different from other fully structured interviews and classifies approximately twice as many participants as cases compared to the most commonly used fully-structured interview, the Composite International Diagnostic Interview (CIDI) (B. Levis et al., Br. J. Psychiatry 2018).
Measure
Scores on each PHQ-9 item reflect frequency of symptoms in the last two weeks and range from 0 (“not at all”) to 3 (“nearly every day”). Higher scores indicate greater depressive symptomatology. Total scores range from 0 to 27 (Kroenke et al., 2001).
Statistical Analyses
Verification of Unidimensionality of the PHQ-9
Robust weighted least squares estimation in Mplus was used to fit a single-factor confirmatory factor analysis model of PHQ-9 items (Muthén & Muthén, 2012). The model was first fit without allowing for any residual correlations among the items. Then modification indices were used to identify item pairs that would improve model fit if their residuals were allowed to correlate, if there was theoretical justification (McDonald & Ho, 2002). Model fit was evaluated concurrently, using: the χ2 statistic, Comparative Fit Index (CFI), Tucker-Lewis Index (TLI), and Root Mean Square Error of Approximation (RMSEA) (Feinian Chen, Curran, Bollen, Kirby, & Paxton, 2008). Priority was given to CFI, TLI, and RMSEA, because the χ2 test may reject well-fitting models when sample size is large (Reise, Widaman, & Pugh, 1993). Model fit was considered adequate if CFI and TLI ≥ 0.95 and RMSEA ≤0.08 (Hu & Bentler, 1999).
Item Response Theory Model and Optimal Test Assembly
A generalized partial credit model (GPCM) was fit to PHQ-9 (Muraki, 1992). The GPCM is an IRT model that relates a latent trait, representing severity of depressive symptomatology, to the distribution of observed item-level responses. The GPCM estimates two types of item-specific parameters: a discrimination parameter and threshold parameters. From these item-level parameter estimates, item information functions for each item were calculated from the GPCM, as well as a test information function (TIF), obtained by summing item information functions. Because the TIF is inversely related to the standard error of measurement of the latent trait, high amounts of information represent greater precision for measuring depressive symptomatology.
Next, we used OTA, a mixed-integer programming technique to systematically search for the short form that maximized the TIF, subject to the constraint of fixing the number of items included in each short form, optimizing the precision of the short form in estimating participants’ level of depressive symptomatology (Boekkooi-Timminga, 1989; van der Linden, 2006). The shape of the TIF was anchored at five points (van der Linden, 2006). Thus, for each short form of lengths 1 to 8 items, OTA selected items from the full set of the nine PHQ-9 items that maximized test information. Due to concerns about the use of the ninth item of the PHQ (Corson et al., 2004; Dube et al., 2010; Lee, Schulberg, Raue, & Kroenke, 2007; Razykov et al., 2013; Rief, Nanke, Klaiberg, & Braehler, 2004), the same procedure was used to generate 8 additional short forms that were forced to exclude the ninth item. In total, the OTA procedure yielded 16 candidate short forms.
For each of the 16 candidate short forms and the full-length form, two scoring procedures were used to obtain estimates of each participant’s level of depressive symptomatology. First, the summed scores across all items included in the short form were calculated. Second, factor scores were estimated for each participant. Although summed scores are typically relied upon for clinical use, the factor scores were considered to provide a better estimate of the latent trait due to well-known limitations of the summed score under the GPCM (Harel, 2014; van der Ark, 2005).
Selection of Final Short Form
The selection of the final short form was based on the following five criteria: reliability, concurrent validity of summed scores, concurrent validity of factor scores, and non-inferior sensitivity and specificity, since the elimination of items necessarily reduces information compared to a full-length form.
Reliability of each candidate short form was assessed with Cronbach’s alpha (Cronbach, 1951). The final selected form was required a priori to have a Cronbach’s alpha coefficient ≥ 0.80. Concurrent validity of the summed scores and factor scores was measured with the Pearson’s correlation coefficient between the full-length form and candidate short form scores, and were required a priori to be ≥ 0.90.
Diagnostic accuracy of each candidate short form was assessed through a three-step process. First, the sensitivity and specificity of each candidate short form for each of its possible cutoff summed score values was estimated with a bivariate random-effects model. Second, for each candidate short form, an optimal cutoff score was selected using Youden’s J statistic (Youden, 1950). For the full-length form, the conventionally used cutoff score of 10 was selected (Gilbody, Richards, Brealey, & Hewitt, 2007; Kroenke et al., 2001; Kroenke & Spitzer, 2002; Spitzer et al., 2000; Wittkampf, Naeije, Schene, Huyser, & van Weert, 2007). Third, two non-inferiority tests were conducted for each of the 16 candidate forms to compare sensitivity and specificity, separately, to the full-length form. Non-inferiority tests assess whether the sensitivity or specificity of the short form is not lower than that of the full-length form, up to a pre-specified clinically-significant tolerance (Counsell & Cribbie, 2015), such as . To conduct the non-inferiority test, the sampling distribution of the test statistic was generated through the bootstrap method (Liu, Ma, Wu, & Tai, 2006). Bootstrapping resamples the original dataset, with replacement, to generate new, artificial, datasets (Efron & Tibshirani, 1994). For each non-inferiority test, 2000 bootstrap iterations were conducted, controlling in each for the number of respondents with and without major depression. For each bootstrap iteration, the bivariate random-effects model was fit to each of the 16 candidate short forms and the full-length form, and the sensitivities and specificities were computed based on their cutoff scores. To account for the multiple testing in the 32 total non-inferiority tests, the Benjamini-Hochberg adjusted p-value was used to determine the significance of the test at the 0.05 signficance level (Benjamini & Hochberg, 1995).
The factor analysis was conducted using Mplus 7 (Muthén & Muthén, 2012). All other analyses were conducted using R version 3.3.3 (R Core Team, 2017). The GPCM was fit using the ltm package (Rizopoulos, 2006). The OTA analysis was conducted using the lpSolveAPI package (Diao & van der Linden, 2011). The bivariate random-effects model was fit using the lme4 package (Bates, Mächler, Bolker, & Walker, 2015).
RESULTS
Search Results and Inclusion of Primary Data
Of 5,248 unique titles and abstracts identified from the database search, 5,039 were excluded after title and abstract review and 113 after full-text review, leaving 96 eligible articles with data from 69 unique participant samples, of which 55 (80%) contributed datasets (Supplementary Figure 1). Authors of included studies contributed data from three unpublished studies, for a total of 58 datasets. Of these, we excluded 32 studies that administered the PHQ-9 in a language other than English and 6 more that used the MINI. In total, 7,850 participants (863 major depression cases) from 20 primary studies were included. These studies were conducted in the USA, New Zealand, Australia, Canada, the UK, and Cameroon. The mean age of the sample was 33.9 years, and 55.3% of participants were women. See Table 1 for descriptive sample statistics, and Supplementary Table 1 for characteristics of each included study.
Table 1.
Patient demographic and diagnostic characteristics (N = 7850)
| Sociodemographic variables | Summary |
|---|---|
| Age, years, mean [median] ± SD (range) | 52.0 [54] ± 18.1 (18, 102) |
| Women, n (%) | 4335 (55.2) |
| PHQ-9 score, mean [median] ± SD (range) | 5.2 [3] ± 5.4 (0, 27) |
| Country, n (%) | |
| USA | 2781 (35.4) |
| New Zealand | 2528 (32.2) |
| Australia | 1092 (13.9) |
| Canada | 573 (7.3) |
| UK | 478 (6.1) |
| Cameroon | 398 (5.1) |
| Care Setting, n (%) | |
| Primary care | 2928 (37.3) |
| Non-medical setting | 1389 (17.7) |
| Perinatal care | 665 (8.5) |
| Neurology | 607 (7.7) |
| HIV/AIDS care | 398 (5.1) |
| Oncology | 273 (3.5) |
| Medical rehabilitation | 211 (2.7) |
| Rheumatology | 201 (2.6) |
| Cardiology | 100 (1.3) |
| Stroke care | 72 (0.9) |
| Outpatients with coronary artery disease | 1006 (12.8) |
| Diagnostic Interview, n (%) | |
| CIDI | 3949 (50.3) |
| SCID | 2443 (31.1) |
| DIS | 1006 (12.8) |
| SCAN | 352 (4.5) |
| DISH | 100 (1.3) |
| Classification system, n (%) | |
| DSM-IV | 6859 (87.4) |
| ICD-10 | 822 (10.5) |
| DSM-V | 169 (2.2) |
Unidimensionality of PHQ-9
A single factor model was fit to the PHQ-9 items with no specification of residual correlations (χ2[df = 36] = 1578.7, p <0.0001, TLI = 0.966, CFI = 0.966, RMSEA = 0.086) Modification indices indicated improvement of model fit if residuals of items that measure physical symptoms (items 3, 4, and 5) were correlated. The model was refitted with specification of three correlated residuals, and fit improved Factor loadings for items were all moderately high, with a median of 0.763 and a range of 0.665 to 0.877.
Item Response Theory Model and Optimal Test Assembly
Table 2 presents discrimination parameters for each item based on the GPCM. The item with the greatest discrimination parameter was item 2. Other items with high values were items 1 and 6. Figure 1 shows the information function of each of the 9 items, as well as the total TIF.
Table 2.
PHQ-9 items and discrimination parameters from the generalized partial credit model
| Item Number |
Description | Discrimination Parameter |
|---|---|---|
| 1 | Little interest or pleasure in doing things | 1.95 |
| 2 | Feeling down, depressed, or hopeless | 2.40 |
| 3 | Trouble falling or staying asleep, or sleeping too much | 0.93 |
| 4 | Feeling tired or having little energy | 1.37 |
| 5 | Poor appetite or overeating | 1.08 |
| 6 | Feeling bad about yourself - or that you are a failure or have let yourself or your family down | 1.90 |
| 7 | Trouble concentrating on things, such as reading newspaper or watching television | 1.41 |
| 8 | Moving or speaking so slowly that other people could have noticed? Or the opposite - being so fidgety or restless that you have been moving around a lot more than usual | 1.29 |
| 9 | Thoughts that you would be better off dead or of hurting yourself in some way | 1.77 |
Figure 1.
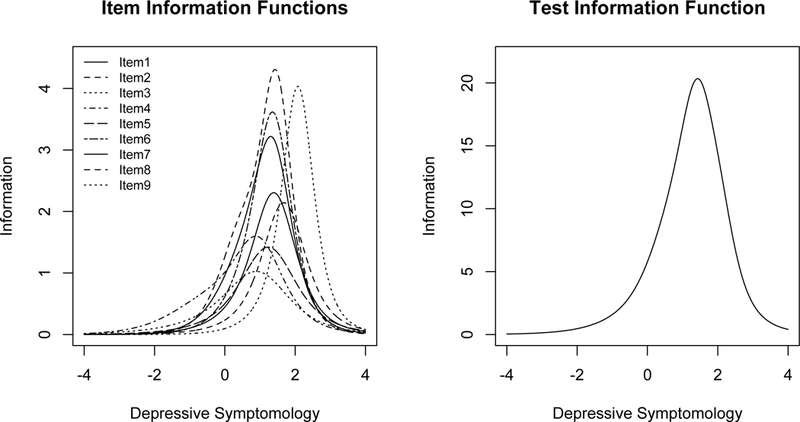
The left hand plot shows the item information functions for each of the 9 items. The right hand plot shows the test information function of the PHQ-9.
Table 3 shows the items that were included in each of the 16 candidate short forms from the OTA analysis. For the candidate forms generated both with the inclusion of item 9 and without, items 3, 4, and 5 were only selected in the longest short forms, and quickly dropped thereafter. Items 1, 2, and 6 were included in all forms of at least 4 items. For the short forms generated from the full set of nine items, item 9 was included in all candidate short forms.
Table 3.
Items included in optimal short forms of each length with item 9 included and item 9 excluded
| Item Number (X indicates inclusion) | |||||||||
|---|---|---|---|---|---|---|---|---|---|
| Short Form Length |
1 Little interest |
2 Feeling down |
3 Sleep problem |
4 Feeling Tired |
5 Appetite |
6 Feeling failure |
7 Concentration |
8 Physical Movement |
9 Thoughts of Death or Self- Harm |
| Item 9 Eligible for Inclusion in Short Forms | |||||||||
| 1 | X | ||||||||
| 2 | X | X | |||||||
| 3 | X | X | X | ||||||
| 4 | X | X | X | X | |||||
| 5 | X | X | X | X | X | ||||
| 6 | X | X | X | X | X | X | |||
| 7 | X | X | X | X | X | X | X | ||
| 8 | X | X | X | X | X | X | X | X | |
| Item 9 Ineligible for Inclusion in Short Forms | |||||||||
| 1 | X | ||||||||
| 2 | X | X | |||||||
| 3 | X | X | X | ||||||
| 4 | X | X | X | X | |||||
| 5 | X | X | X | X | X | ||||
| 6 | X | X | X | X | X | X | |||
| 7 | X | X | X | X | X | X | X | ||
| 8 | X | X | X | X | X | X | X | X | |
Selection of final short form
Table 4 presents Cronbach’s alpha values and concurrent validity correlations for the 16 candidate short forms. Table 5 presents results of the non-inferiority tests for both sensitivity and specificity. There were four short forms that satisfied our pre-specified criteria in terms of reliability, concurrent validity, and diagnostic accuracy. The four such forms were: 6-item and 7-item short forms that included item 9 and 4-item and 5-item short forms that excluded item 9.
Table 4.
Reliability and validity results of the candidate short forms
| Form Length |
Cronbach’s alpha (95% CI) | Correlation of summed scores (95% CI) |
Correlation of factor scores (95% CI) |
|---|---|---|---|
|
Item 9 Eligible for Inclusion in Short Forms | |||
| 1 | NA | 0.527 (0.511, 0.543) | NA |
| 2 | 0.533 (0.504, 0.563) | 0.804 (0.796, 0.811) | 0.800 (0.792, 0.808) |
| 3 | 0.727 (0.712, 0.741) | 0.863 (0.857, 0.868) | 0.869 (0.863, 0.874) |
| 4 | 0.801 (0.790, 0.810) | 0.892 (0.887, 0.896) | 0.895 (0.890, 0.899) |
| 5 | 0.809 (0.799, 0.819) | 0.920 (0.916, 0.923) | 0.912 (0.909, 0.916) |
| 6 | 0.835 (0.826, 0.843) | 0.939 (0.937, 0.942) | 0.931 (0.928, 0.934) |
| 7 | 0.846 (0.839, 0.854) | 0.971 (0.970, 0.973) | 0.980 (0.979, 0.980) |
| 8 | 0.858 (0.851, 0.865) | 0.986 (0.986, 0.987) | 0.989 (0.989, 0.990) |
| 9 | 0.866 (0.860, 0.873) | 1.000 (1.000, 1.000) | 1.000 (1.000, 1.000) |
| Item 9 Ineligible for Inclusion in Short Forms | |||
| 1 | NA | 0.781 (0.772, 0.79) | NA |
| 2 | 0.779 (0.763, 0.794) | 0.849 (0.842, 0.855) | 0.860 (0.855, 0.866) |
| 3 | 0.816 (0.806, 0.826) | 0.887 (0.882, 0.892) | 0.891 (0.886, 0.895) |
| 4 | 0.805 (0.795, 0.814) | 0.919 (0.916, 0.923) | 0.910 (0.907, 0.914) |
| 5 | 0.832 (0.824, 0.840) | 0.940 (0.936, 0.941) | 0.930 (0.927, 0.933) |
| 6 | 0.845 (0.838, 0.852) | 0.970 (0.969, 0.971) | 0.978 (0.977, 0.979) |
| 7 | 0.857 (0.850, 0.863) | 0.984 (0.984, 0.985) | 0.988 (0.987, 0.988) |
| 8 | 0.866 (0.860, 0.872) | 0.997 (0.997, 0.997) | 0.998 (0.998, 0.998) |
Bold values represent those of the final selected form.
Table 5.
Diagnostic accuracy results of the candidate short forms and their non-inferiority test results
| Form Length |
Optimal Cutoff |
Sensitivity (95% CI) | P-value | Specificity (95% CI) | P-value |
|---|---|---|---|---|---|
|
Item 9 Eligible for Inclusion in Short Forms | |||||
| 1 | 1 | 0.420 (0.369, 0.437) | 0.976 | 0.943 (0.930, 0.954) | 0.000 |
| 2 | 1 | 0.929 (0.900, 0.950) | 0.000 | 0.650 (0.592, 0.685) | 0.976 |
| 3 | 2 | 0.892 (0.843, 0.927) | 0.000 | 0.717 (0.680, 0.751) | 0.976 |
| 4 | 3 | 0.858 (0.810, 0.895) | 0.000 | 0.776 (0.744, 0.805) | 0.976 |
| 5 | 4 | 0.806 (0.749, 0.853) | 0.000 | 0.826 (0.798, 0.851) | 0.066 |
| 6 | 5 | 0.837 (0.808, 0.863) | 0.000 | 0.837 (0.808, 0.863) | 0.000 |
| 7 | 7 | 0.814 (0.715, 0.884) | 0.000 | 0.849 (0.820, 0.873) | 0.000 |
| 8 | 7 | 0.856 (0.855, 0.857) | 0.000 | 0.802 (0.801, 0.804) | 0.976 |
| 9 | 10 | 0.761 (0.679, 0.787) | NA | 0.866 (0.836, 0.892) | NA |
| Item 9 Ineligible for Inclusion in Short Forms | |||||
| 1 | 1 | 0.916 (0.877, 0.944) | 0.000 | 0.650 (0.599, 0.698) | 0.976 |
| 2 | 2 | 0.880 (0.825, 0.919) | 0.000 | 0.725 (0.688, 0.760) | 0.976 |
| 3 | 3 | 0.844 (0.796, 0.882) | 0.000 | 0.784 (0.752, 0.813) | 0.976 |
| 4 | 4 | 0.788 (0.725, 0.840) | 0.000 | 0.837 (0.809, 0.861) | 0.000 |
| 5 | 5 | 0.792 (0.716, 0.873) | 0.000 | 0.848 (0.820, 0.873) | 0.000 |
| 6 | 6 | 0.855 (0.762, 0.916) | 0.000 | 0.807 (0.773, 0.838) | 0.976 |
| 7 | 7 | 0.844 (0.762, 0.902) | 0.000 | 0.810 (0.776, 0.840) | 0.976 |
| 8 | 8 | 0.871 (0.786, 0.925) | 0.000 | 0.784 (0.746, 0.819) | 0.976 |
Bold values represent those of the final selected form.
The 4-item short form was the shortest form that fulfilled all criteria. The form includes: item 1 (“Little interest or pleasure in doing things”), item 2 (“Feeling down, depressed, or hopeless”), item 6 (“Feeling bad about yourself - or that you are a failure or have let yourself or your family down”), and item 8 (“Moving or speaking so slowly that other people could have noticed? Or the opposite - being so fidgety or restless that you have been moving around a lot more than usual”). The PHQ-Dep-4 maintained high reliability with a Cronbach’s alpha of 0.805 (95% CI, 0.795, 0.814) compared to 0.866 for the full-length form. Correlations of the summed and factor scores between the PHQ-Dep-4 and PHQ-9 were 0.919 (95% CI, 0.916, 0.923) and 0.910 (95% CI, 0.907, 0.914), respectively. The sensitivity and specificity of the PHQ-Dep-4 at its optimal cutoff of 4 were 0.788 (95% CI, 0.725, 0.840) and 0.837 (95% CI, 0.809, 0.861), respectively. Both sensitivity and specificity were non-inferior to the sensitivity (0.761; 95% CI, 0.679, 0.787) and specificity (0.866; 95% CI, 0.836, 0.892) of the full-length form.
DISCUSSION
This study illustrated how OTA methods can be used to effectively shorten self-report symptom measures while maintaining comparable diagnostic accuracy. OTA methods were applied to shorten the 9-item PHQ-9 to a 4-item version (PHQ-Dep-4). In addition to maintaining similar sensitivity and specificity, the short form had minimal loss of information and maintained reliability and validity that were comparable to the full-length form based on pre-specified criteria. Cronbach’s alpha of the PHQ-Dep-4 was 0.805, compared to 0.866 for the full form. Correlations of the summed score and factor score of the PHQ-Dep-4 and PHQ-9 were 0.919 and 0.910, respectively. Per pre-specified criteria, the sensitivity and specificity of the PHQ-Dep-4 (0.788 and 0.837, respectively) were within 5% of those of the PHQ-9 (0.761 and 0.866, respectively).
The 4 items included in the PHQ-Dep-4 included items 1, 2, 6 and 8 from the original PHQ-9. These items included the 2 core depression items (depressed mood and loss of interest) that make up the commonly used PHQ-2. According to diagnostic criteria for major depression, at least one of these symptoms must be present for a diagnosis. The other 2 items in the PHQ-Dep-4 included an affective/cognitive item (feelings of failure) and a somatic item (physical movement). Thus, the PHQ-Dep-4 includes items that qualitatively represent the depressive symptomatology construct well. We note that the PHQ-Dep-4 includes 1 somatic symptom, whereas the full PHQ-9 includes 4 symptoms. One study found that somatic symptoms may increase scores on the PHQ-9 among somatically ill patients due to factors related to somatic disease, but not depression, among scleroderma patients, but the association was minimal (Leavens, Patten, Hudson, Baron, & Thombs, 2012). Another study, of multiple sclerosis patients, did not find that somatic symptoms influenced scores substantively (Sjonnesen et al., 2012).
Both the actual PHQ-2 and the PHQ-8 were selected in the set of 16 candidate short forms. Neither of these, however, were selected by the OTA procedure as optimal. The PHQ-Dep-4 has lower sensitivity than the PHQ-2 (0.788 rather than 0.880), but higher specificity (0.837 rather than 0.725). The PHQ-Dep-4, therefore, may represent a middle ground between shortening the full-length scale, while still retaining desirable measurement and diagnostic properties. The PHQ-Dep-4 may be a useful option in some contexts because it is shorter than the PHQ-9 and PHQ-8, but generates a wider score distribution than the PHQ-2.
There are several limitations for this study that must be considered. First, for the collection of data for the full IPDMA, it was not possible to obtain primary data from 14 of the 69 eligible datasets. Second, the full IPDMA excluded studies where the PHQ-9 was administered exclusively to patients with known psychiatric conditions. Therefore, the generalizability of the results should be confirmed when monitoring treatment response. Third, the present study only included participants for whom the PHQ-9 was administered in English. Fourth, a previous study showed that semi-structured and fully structured interviews have different characteristics as reference standards (B. Levis et al., Br. J. Psychiatry 2018). We excluded studies that used the MINI, given its high rate of diagnosis relative to other diagnostic interviews (B. Levis et al., Br. J. Psychiatry 2018). We included studies that used both semi-structured and fully structured interviews as reference standards, and future work should verify that our results apply in both cases. While our dataset included a specific sample of patients, we note that measurement invariance or differential item functioning requirements have been examined in previous studies of the PHQ-9 used as a continuous measure across variables like language (Arthurs, Steele, Hudson, Baron, & Thombs, 2012; Merz, Malcarne, Roesch, Riley, & Sadler, 2013), culture (Baas et al., 2011; Hirsch, Donner-Banzhoff, & Bachmann, 2013; Huang, Chung, Kroenke, Delucchi, & Spitzer, 2006), and medical diagnosis (Chung et al., 2015; Cook et al., 2011; Leavens et al., 2012). These studies provide some degree of confidence that the structure of the PHQ-9 is similar across groups. Lastly, there is a need to replicate our results in different patient populations due to unexamined heterogeneity across the studies included in this analysis.
With regards to the OTA procedure, two limitations must be considered. First, the selection of a short version was sensitive to the choice of criteria for the selection of the final form, and should be carefully considered in future analyses Additionally, the OTA approach is exploratory and data-driven, and the results of this study should be replicated.
CONCLUSION
The study illustrates how patient self-report symptom measures can be developed and validated using the OTA method, which uses pre-specified objective criteria to determine the length and specific items that should be included in a short form. The method was implemented with a sample of 7,850 participants from 20 primary PHQ-9 diagnostic studies. The 4-item version was developed and validated based on pre-specified constraints on its test information, reliability, validity, and diagnostic accuracy.
Acknowledgements:
This study was funded by the Canadian Institutes of Health Research (CIHR; KRS-134297). Dr. Harel was supported by NYU start-up research grants. Ms. Levis was supported by a CIHR Frederick Banting and Charles Best Canada Graduate Scholarship doctoral award. Mr. Levis and Ms. Azar were supported by Fonds de recherche du Québec - Santé (FRQS) Masters Training Awards. Ms. Riehm and Ms. Saadat were supported by CIHR Frederick Banting and Charles Best Canadian Graduate Scholarships - Master’s Awards. Ms. Rice was supported by a Vanier Canada Graduate Scholarship. The primary studies by Amoozegar and by Fiest et al. were funded by the Alberta Health Services, the University of Calgary Faculty of Medicine, and the Hotchkiss Brain Institute. Collection of data for the study by Arroll et al. was supported by a project grant from the Health Research Council of New Zealand. Data for the study by Razykov et al. was collected by the Canadian Scleroderma Research Group, which was funded by the CIHR (FRN 83518), the Scleroderma Society of Canada, the Scleroderma Society of Ontario, the Scleroderma Society of Saskatchewan, Sclérodermie Québec, the Cure Scleroderma Foundation, Inova Diagnostics Inc., Euroimmun, FRQS, the Canadian Arthritis Network, and the Lady Davis Institute of Medical Research of the Jewish General Hospital, Montreal, QC. The primary study by Bombardier et al. was supported by the Department of Education, National Institute on Disability and Rehabilitation Research, Spinal Cord Injury Model Systems: University of Washington (grant no. H133N060033), Baylor College of Medicine (grant no. H133N060003), and University of Michigan (grant no. H133N060032). Collection of data for the primary study by Kiely et al. was supported by National Health and Medical Research Council (grant number 1002160) and Safe Work Australia. Dr. Butterworth was supported by Australian Research Council Future Fellowship FT130101444. Dr. Conwell received support from NIMH (R24MH071604) and the Centers for Disease Control and Prevention (R49 CE002093). Collection of data for the primary study by Gjerdingen et al. was supported by grants from the NIMH (R34 MH072925, K02 MH65919, P30 DK50456). The primary study by Eack et al. was funded by the NIMH (R24 MH56858). Collection of data for the studies by Turner et al were funded by a bequest from Jennie Thomas through the Hunter Medical Research Institute. The primary study by Sidebottom et al. was funded by a grant from the United States Department of Health and Human Services, Health Resources and Services Administration (grant number R40MC07840). Dr. Hudson was supported by a FRQS Senior Investigator Award. The primary study by Twist et al. was funded by the UK National Institute for Health Research under its Programme Grants for Applied Research Programme (grant reference number RP-PG-0606-1142). Dr. Jetté was supported by a Canada Research Chair in Neurological Health Services Research. Dr. Kiely was supported by funding from Australian National Health and Medical Research Council fellowship (grant number 1088313). Collection of data for the primary study by Williams et al. was supported by a NIMH grant to Dr. Marsh (RO1-MH069666). Collection of primary data for the study by Dr. Pence was provided by NIMH (R34MH084673). The primary study by Rooney et al. was funded by the United Kingdom National Health Service Lothian Neuro-Oncology Endowment Fund. Simning et al.’s research was supported in part by grants from the NIH (T32 GM07356), Agency for Healthcare Research and Quality (R36 HS018246), NIMH (R24 MH071604), and the National Center for Research Resources (TL1 RR024135). The primary study by Thombs et al. was done with data from the Heart and Soul Study (PI Mary Whooley). The Heart and Soul Study was funded by the Department of Veterans Epidemiology Merit Review Program, the Department of Veterans Affairs Health Services Research and Development service, the National Heart Lung and Blood Institute (R01 HL079235), the American Federation for Aging Research, the Robert Wood Johnson Foundation, and the Ischemia Research and Education Foundation. Drs. Benedetti and Thombs were supported by FRQS researcher salary awards. No other authors reported funding for primary studies or for their work on the present study.
Footnotes
Conflict of Interest Disclosures: Drs. Jetté and Patten declare that they received a grant, outside the submitted work, from the Hotchkiss Brain Institute, which was jointly funded by the Institute and Pfizer. Pfizer was the original sponsor of the development of the PHQ-9, which is now in the public domain. All other authors declare no competing interests. No funder had any role in the design and conduct of the study; collection, management, analysis, and interpretation of the data; preparation, review, or approval of the manuscript; and decision to submit the manuscript for publication.
REFERENCES
- Arthurs E, Steele RJ, Hudson M, Baron M, & Thombs BD (2012). Are Scores on English and French Versions of the PHQ-9 Comparable? An Assessment of Differential Item Functioning. PLoS ONE, 7(12), 5–11. 10.1371/journal.pone.0052028 [DOI] [PMC free article] [PubMed] [Google Scholar]
- Baas KD, Cramer AOJ, Koeter MWJ, Van De Lisdonk EH, Van Weert HC, & Schene AH (2011). Measurement invariance with respect to ethnicity of the Patient Health Questionnaire-9 (PHQ-9). Journal of Affective Disorders, 129(1-3), 229–235. 10.1016/j.jad.2010.08.026 [DOI] [PubMed] [Google Scholar]
- Bates D, Mächler M, Bolker B, & Walker S (2015). Fitting linear mixed-dffects models using lme4. Journal of Statistical Software, 67(1). 10.18637/jss.v067.i01 [DOI] [Google Scholar]
- Benjamini Y, Hochberg Y (1995). Controlling the false discovery rate: a practical and powerful approach to multiple testing. Journal of the Royal Statistical Society, 57(1), 289–300. [Google Scholar]
- Boekkooi-timminga E (1989). A maximin model for test design. Psychometrika, 54(2), 237–247. [Google Scholar]
- Chung H, Kim J, Askew RL, Jones SMW, Cook KF, & Amtmann D (2015). Assessing measurement invariance of three depression scales between neurologic samples and community samples. Quality of Life Research, 24(8), 1829–1834. 10.1007/s11136-015-0927-5 [DOI] [PubMed] [Google Scholar]
- Cook KF, Bombardier CH, Bamer AM, Choi SW, Kroenke K, & Fann JR (2011). Do somatic and cognitive symptoms of traumatic brain injury confound depression screening? Archives of Physical Medicine and Rehabilitation, 92(5), 818–823. 10.1016/j.apmr.2010.12.008 [DOI] [PMC free article] [PubMed] [Google Scholar]
- Corson K, Gerrity MS, & Dobscha SK (2004). Screening for depression and suicidality in a VA primary care setting: 2 items are better than 1 item. The American Journal of Managed Care, 10(11 Pt 2), 839–845. [PubMed] [Google Scholar]
- Coste J, Guillemin F, Pouchot J, & Fermanian J (1997). Methodological approaches to shortening composite measurement scales. Journal of Clinical Epidemiology, 50(3), 247–252. 10.1016/S0895-4356(96)00363-0 [DOI] [PubMed] [Google Scholar]
- Counsell A, & Cribbie RA (2015). Equivalence tests for comparing correlation and regression coefficients. British Journal of Mathematical and Statistical Psychology, 68(2), 292–309. 10.1111/bmsp.12045 [DOI] [PubMed] [Google Scholar]
- Cronbach LJ (1951). Coefficient alpha and the internal structure of tests. Psychometrika, 16(3), 297–334. 10.1007/BF02310555 [DOI] [Google Scholar]
- Diao Q, & van der Linden WJ (2011). Automated test assembly using lp_solve version 5.5 in R. Applied Psychological Measurement, 35(5), 398–409. 10.1177/0146621610392211 [DOI] [Google Scholar]
- Dube P, Kroenke K, Bair MJ, Theobald D, & Williams LS (2010). The P4 screener: Evaluation of a brief measure for assessing potential suicide risk in 2 randomized effectiveness trials of primary care and oncology patients. The Primary Care Companion to The Journal of Clinical Psychiatry, 12(June 2008). 10.4088/PCC.10m00978blu [DOI] [PMC free article] [PubMed] [Google Scholar]
- Efron B, & Tibshirani RJ (1994). An introduction to the bootstrap. CRC press. [Google Scholar]
- Chen Feinian, Curran PJ, Bollen KA, Kirby J, & Paxton P (2008). An Empirical Evaluation of the Use of Fixed Cutoff Points in RMSEA Test Statistic in Structural Equation Models. Sociological Methods & Research, 36(4), 462–494. 10.1177/0049124108314720 [DOI] [PMC free article] [PubMed] [Google Scholar]
- Gilbody S, Richards D, Brealey S, & Hewitt C (2007). Screening for depression in medical settings with the Patient Health Questionnaire (PHQ): A diagnostic meta-analysis. Journal of General Internal Medicine, 22(11), 1596–1602. 10.1007/s11606-007-0333-y [DOI] [PMC free article] [PubMed] [Google Scholar]
- Goetz C, Coste J, Lemetayer F, Rat AC, Montel S, Recchia S, … Guillemin F (2013). Item reduction based on rigorous methodological guidelines is necessary to maintain validity when shortening composite measurement scales. Journal of Clinical Epidemiology 10.1016/j.jclinepi.2012.12.015 [DOI] [PubMed] [Google Scholar]
- Harel D (2014). The effect of model misspecification for polytomous logistic adjacent-category item response theory models (Doctoral dissertation, McGill University). [Google Scholar]
- Harel D, & Baron M (2018). Methods for shortening patient-reported outcome measures. Statistical Methods in Medical Research. doi: 10.1177/0962280218795187 [DOI] [PubMed] [Google Scholar]
- Hirsch O, Donner-Banzhoff N, & Bachmann V (2013). Measurement Equivalence of Four Psychological Questionnaires in Native-Born Germans, Russian-Speaking Immigrants, and Native-Born Russians. Journal of Transcultural Nursing, 24(3), 225–235. 10.1177/1043659613482003 [DOI] [PubMed] [Google Scholar]
- Holling H, Kuhn JT, & Kiefer T (2013). Optimal test assembly in practice: The design of the Austrian educational standards assessment in mathematics. Journal of Psychology, 221(3), 190–200. [Google Scholar]
- Hu LT, & Bentler PM (1999). Cutoff criteria for fit indexes in covariance structure analysis: Conventional criteria versus new alternatives. Structural Equation Modeling, 6(1), 1–55. 10.1080/10705519909540118 [DOI] [Google Scholar]
- Huang FY, Chung H, Kroenke K, Delucchi KL, & Spitzer RL (2006). Using the Patient Health Questionnaire-9 to measure depression among racially and ethnically diverse primary care patients. Journal of General Internal Medicine, 21(6), 547–552. 10.1111/j.1525-1497.2006.00409.x [DOI] [PMC free article] [PubMed] [Google Scholar]
- Kroenke K, & Spitzer RL (2002). The PHQ-9: a new depression diagnostic and severity measure. Psychiatric Annals, 32(9), 509–515. [Google Scholar]
- Kroenke K, & Spitzer RL (2002). The PHQ-9 : a new depression diagnostic and severity measure. Psychiatric Annals, 32(9), 509–515. https://doi.org/170553651 [Google Scholar]
- Kroenke K, Spitzer RL, & Williams JBW (2001). The PHQ-9 Validity of a Brief Depression Severity Measure. Journal of General Internal Medicine, 16(9), 605–613. 10.1046/j.1525-1497.2001.016009606.x [DOI] [PMC free article] [PubMed] [Google Scholar]
- Kroenke K, Spitzer RL, & Williams JBW (2003). The Patient Health Questionnaire-2 Validity of a Two-Item Depression Screener. Medical Care, 41(11), 1284–1292. 10.1097/01.MLR.0000093487.78664.3C [DOI] [PubMed] [Google Scholar]
- Kroenke K, Strine TW, Spitzer RL, Williams JBW, Berry JT, & Mokdad AH (2009). The PHQ-8 as a measure of current depression in the general population. Journal of Affective Disorders, 114(1-3), 163–173. 10.1016/j.jad.2008.06.026 [DOI] [PubMed] [Google Scholar]
- Kruyen PM, Emons WHM, & Sijtsma K (2013). On the Shortcomings of Shortened Tests: A Literature Review. International Journal of Testing. 10.1080/15305058.2012.703734 [DOI] [Google Scholar]
- Leadbeater E, Carruthers JM, Green JP, Rosser NS, & Field J (2011). Nest inheritance is the missing source of direct fitness in a primitively eusocial insect. Science, 333(6044), 874–876. 10.1126/science.1205140 [DOI] [PubMed] [Google Scholar]
- Leavens A, Patten SB, Hudson M, Baron M, & Thombs BD (2012). Influence of somatic symptoms on patient health questionnaire-9 depression scores among patients with systemic sclerosis compared to a healthy general population sample. Arthritis Care and Research, 64(8), 1195–1201. 10.1002/acr.21675 [DOI] [PubMed] [Google Scholar]
- Lee PW, Schulberg HC, Raue PJ, & Kroenke K (2007). Concordance between the PHQ-9 and the HSCL-20 in depressed primary care patients. Journal of Affective Disorders, 99(1-3), 139–145. 10.1016/j.jad.2006.09.002 [DOI] [PubMed] [Google Scholar]
- Levis AW, Harel D, Kwakkenbos L, Carrier ME, Mouthon L, Poiraudeau S, … Mills SD (2016). Using Optimal Test Assembly Methods for Shortening Patient-Reported Outcome Measures: Development and Validation of the Cochin Hand Function Scale-6: A Scleroderma Patient-Centered Intervention Network Cohort Study. Arthritis Care and Research, 68(11), 1704–1713. 10.1002/acr.22893 [DOI] [PubMed] [Google Scholar]
- Levis B, Benedetti A, Riehm KE, Saadat N, Levis AW, & Azar M (2018). Probability of major depression diagnostic classification using semi-structured versus fully structured diagnostic interviews. British Journal of Psychiatry. 212(6), 377–385‥ [DOI] [PMC free article] [PubMed] [Google Scholar]
- Liu JP, Ma MC, Wu CY, & Tai JY (2006). Test of equivalence and non-inferiority for diagnostic accuracy based on the paired areas under ROC curves. Statistics in Medicine, 25(7), 1219–1238. 10.1002/sim.2358 [DOI] [PubMed] [Google Scholar]
- Manea L, Gilbody S, Hewitt C, North A, Plummer F, Richardson R, … McMillan D (2016). Identifying depression with the PHQ-2: A diagnostic meta-analysis. Journal of Affective Disorders, 203, 382–395. 10.1016/j.jad.2016.06.003 [DOI] [PubMed] [Google Scholar]
- McDonald RP, & Ho M-HR (2002). Principles and practice in reporting structural equation analyses. Psychological Methods, 7(1), 64–82. 10.1037/1082-989X.7.1.64 [DOI] [PubMed] [Google Scholar]
- Merz EL, Malcarne VL, Roesch SC, Riley N, & Sadler GR (2013). A multigroup confirmatory factor analysis of the Patient Health Questionnaire-9 among English-and Spanish-speaking Latinas. Cultural Diversity and Ethnic Minority Psychology, 17(3), 309 10.1021/nn300902w.Release [DOI] [PMC free article] [PubMed] [Google Scholar]
- Moriarty AS, Gilbody S, McMillan D, & Manea L (2015). Screening and case finding for major depressive disorder using the Patient Health Questionnaire (PHQ-9): A meta-analysis. General Hospital Psychiatry, 37(6), 567–576. 10.1016/j.genhosppsych.2015.06.012 [DOI] [PubMed] [Google Scholar]
- Muraki E (1992). A Generalized Partial Credit Model : Application of an EM Algorithm. Applied Psychological Measurement, 16(2), 159–176. [Google Scholar]
- Muthén L, & Muthén B (2012). Mplus User’s Guide: Statistical Analysis With Latent Variables. Mplus User’s Guide (Seventh Edition), 1–850. 10.1111/j.1600-0447.2011.01711.x [DOI] [Google Scholar]
- R Core Team. (2017). R: A language and environment for statistical computing. R Foundation for Statistical Computing; Vienna, Austria: Retrieved from https://www.r-project.org/ [Google Scholar]
- Razykov I, Hudson M, Baron M, & Thombs BD (2013). Utility of the Patient Health Questionnaire-9 to assess suicide risk in patients with systemic sclerosis. Arthritis Care & Research, 65(5), 753–758. 10.1002/acr.21894 [DOI] [PubMed] [Google Scholar]
- Reise SP, Widaman KF, & Pugh RH (1993). Confirmatory factor analysis and item response theory: two approaches for exploring measurement invariance. Psychological Bulletin, 114(3), 552. [DOI] [PubMed] [Google Scholar]
- Rief W, Nanke A, Klaiberg A, & Braehler E (2004). Base rates for panic and depression according to the Brief Patient Health Questionnaire: A population-based study. Journal of Affective Disorders, 82(2), 271–276. 10.1016/j.jad.2003.11.006 [DOI] [PubMed] [Google Scholar]
- Rizopoulos D (2006). ltm: An R package for latent variable modeling and item response theory analyses. Journal of Statistical Software, 17(5), 1–25. [Google Scholar]
- Sjonnesen K, Berzins S, Fiest KM, Bulloch AGM, Metz LM, Thombs BD, & Patten SB (2012). Evaluation of the 9-Item Patient Health Questionnaire (PHQ-9) as an Assessment Instrument for Symptoms of Depression in Patients with Multiple Sclerosis. Postgraduate Medicine, 124(5), 69–77. 10.3810/pgm.2012.09.2595 [DOI] [PubMed] [Google Scholar]
- Smith G, Mccarthy DM, & Anderson K (2004). On the sins of short-form development (vol 12, pg 102, 2000). Psychological Assessment, 16(3), 340. [DOI] [PubMed] [Google Scholar]
- Spitzer RL, Kroenke K, & Williams JBW (2000). Validation and utility of a self-report version of PRIME-MD. Primary Care Companion to the Journal of Clinical Psychiatry, 2(1), 31. [Google Scholar]
- Stanton JM, Sinar EF, Balzer WK, & Smith PC (2002). Issues and strategies for reducing the length of self-report scales. Personnel Psychology, 55(1), 167–194. [Google Scholar]
- Thombs BD, Benedetti A, Kloda LA, Levis B, Nicolau I, Cuijpers P, … Ziegelstein RC (2014). The diagnostic accuracy of the Patient Health Questionnaire-2 (PHQ-2), Patient Health Questionnaire-8 (PHQ-8), and Patient Health Questionnaire-9 (PHQ-9) for detecting major depression: protocol for a systematic review and individual patient data meta-ana. Systematic Reviews, 3(1), 124 10.1186/2046-4053-3-124 [DOI] [PMC free article] [PubMed] [Google Scholar]
- Van der Ark LA (2005). Stochastic ordering of the latent trait by the sum score under various polytomous IRT models. Psychometrika, 70(2), 283–304. 10.1007/s11336-000-0862-3 [DOI] [Google Scholar]
- Van der Linden WJ (2006). Linear models for optimal test design. New York: Springer. [Google Scholar]
- Wittkampf KA, Naeije L, Schene AH, Huyser J, & van Weert HC (2007). Diagnostic accuracy of the mood module of the Patient Health Questionnaire: a systematic review. General Hospital Psychiatry, 29(5), 388–395. 10.1016/j.genhosppsych.2007.06.004 [DOI] [PubMed] [Google Scholar]
- Youden WJ (1950). Index for rating diagnostic tests. Cancer, 3(1), 32–35. [DOI] [PubMed] [Google Scholar]