Abstract
Background:
In the heart, slow delayed rectifier channels provide outward currents (IKs)for action potential (AP) repolarization in a region- and context-dependent manner. In diseased hearts, chronic elevation of angiotensin II (Ang II) may remodel IKs in a region-dependent manner, contributing to atrial and ventricular arrhythmias of different mechanisms.
Objective:
To study whether/how chronic in vivo Ang II administration remodels IKs in atrial and ventricular myocytes.
Methods:
We used the guinea pig (GP) model whose myocytes express robust IKs. GPs were implanted with minipumps containing Ang II or vehicle. Treatment continued for 4–6 weeks. We used patch clamp, immunofluorescence/confocal microscopy and immunoblots to evaluate changes in IKs function and to explore the underlying mechanisms.
Results:
We confirmed the pathological state of the heart after chronic Ang II treatment. IKs density was increased in atrial myocytes but decreased in ventricular myocytes in Ang II- vs vehicle-treated animals. The former was correlated with an increase in KCNQ1/KCNE1 colocalization in myocyte periphery, while the latter was correlated with a decrease in KCNQ1 protein level. Interestingly, these changes in IKs were not translated into expected alterations in AP duration or plateau voltage, indicating that other currents were involved. In atrial myocytes from Ang II-treated animals, the L-type Ca channel current was increased contributing to AP plateau elevation and AP duration prolongation.
Conclusion:
IKs is differentially modulated by chronic in vivo Ang II administration between atrial and ventricular myocytes. Other currents remodeled by Ang II treatment also contribute to changes in action potentials.
Keywords: Slow delayed rectifier current, repolarization reserve, angiotensin II, angiotensin receptor type I, arrhythmia
INTRODUCTION
The slow delayed rectifier (IKs) channel passes slowly activating outward currents (at +40 mV, τ ~ 2 s and 0.2 s at 21oC and 36oC, respectively1), that can contribute to action potential (AP) repolarization in a region- and context-dependent manner. In ventricular myocytes under basal conditions, the slowness of IKs activation makes it unimportant for AP repolarization2. Faster-activating rapid delayed rectifier (IKr) and inward rectifier (IK1) currents are sufficient to repolarize AP3. During high β-adrenergic tone, when the heart rate is accelerated and the L-type Ca current (LTCC) is increased to boost myocyte contractility and increase cardiac output, IKs becomes larger and activates faster4. As such, IKs becomes critical for ventricular AP shortening2, which is necessary for ventricular chamber filling during tachycardia. Therefore, IKs is a major component of ‘repolarization reserve’ in the ventricles5. Atrial myocytes express the ultra-rapid delayed rectifier (IKur) channel, which keeps the AP plateau low and AP duration short. Whether IKs can contribute to atrial AP repolarization under normal conditions is unclear.
The IKs channel has two components: KCNQ1 channel, that has the ion conduction pore and voltage sensor, and KCNE1 subunits, that confer the slowness of activation while increasing the pore conductance to K+ ions6. Dysregulation of IKs amplitude and/or activation kinetics can lead to arrhythmias. Loss-of-function mutations in IKs channel components often lead to a decrease in IKs amplitude and congenital long QT syndromes. On the other hand gain-of-function mutations in IKs channel components often create an instantaneous activation phenotype that causes short QT syndrome and familial atrial fibrillation (AF)7. In diseased hearts, there is often a downregulation of IKs in ventricular myocytes, leading to acquired LQT8. On the other hand, IKs is upregulated in atrial myocytes from patients with chronic AF, increasing AF stability9.
In diseased hearts, the angiotensin II (Ang II) level is often chronically elevated. This leads to persistent activation of AT1R, and a plethora of signaling pathways that eventually lead to myocyte hypertrophy, increased fibrosis, and electrical remodeling (e.g. Cx43 and Nav1.5 downregulation)10. How chronic Ang II elevation may modulate IKs, and whether this modulation differs between atrial and ventricular myocytes, are unclear. These questions motivated us to undertake the current study. We chose the guinea pig (GP) model because GP cardiomyocytes express robust IKs. Ang II was administered through implanted minipump for 4–6 weeks. Animals implanted with vehicle-containing minipump served as control. Our data show that IKs is differentially modulated by chronic in vivo Ang II administration between atrial and ventricular myocytes. However, other currents are also involved to shape the action potential configuration and duration in Ang II-treated heart.
METHODS
Guinea pig model of chronic Ang II treatment
The animal experiments were conducted in accordance with The Guide for the Care and Use of Laboratory Animals published by the US National Institute of Health (NIH publication 85–23, revised 1996), and were approved by IACUC of VCU. Thirty three guinea pigs were assigned to ‘Ang II-treatment’ group (18), ‘Vehicle’ group (12), and ‘Control’ (3, no minipump implantation). Under sterile conditions with animals anesthetized, Alzet osmotic minipumps (model 2004) containing 190 ul of Ang II (60 ug/ul, dissolved in sterile saline) or saline alone were inserted subcutaneously on the back of the animals.
Echocardiograph
Echocardiography using Vevo 770 imaging system (VisualSonics, Toronto, Canada) has been described 11. LV ejection fraction was calculated using the Teichholz formula.
Histology
Thin (10–15 um) slices were stained with Masson’s trichrome dyes. Quantification of % fibrotic area was done using ImageJ.
Myocyte isolation
Myocyte isolation procedures have been described12.
Patch clam experiments and data analysis
Myocytes were superfused with Tyrode’s at 34+1oC. To minimize interference due to current rundown, in all cases we adhered to the following sequence of voltage clamp protocols: (1) first 3–5 min, whole cell dialysis and adjusting series resistance compensation to 90–95%, (2) recording action potentials in current-clamp mode, (3) switching to voltage clamp mode, recording IK1 and ICaL, (4) recording combined delayed rectifier currents (IKr+IKs), (5) dofetilide (DOF, 1 uM) washin (~10 min), and (6) recording DOF-insensitive IKs. Data analysis was done using Clampfit, Microsoft Excel, PeakFit, SigmaStat, and SigmaPlot.
Western blot experiments
Tissue chunks from LV base were frozen in liquid nitrogen and stored at −80oC until experiments. The procedures of immunoblots have been described previously12. The following antibodies were used: Cav1.2 (mAb, NeuroMab), KCNQ1 (rabbit Ab, Alomone, goat Ab, Santa Cruz Biotechnology), and KCNE1 (mAb, AbNova).
Immunofluorescence, confocal microscopy and image analysis
Myocytes were plated on poly-L-lysine coated coverslips, fixed by 2% PFA for 15 min, and stored in nonpermeabilizing blocking buffer (5% fetal calf serum in PBS, with 0.1% NaN3) at 4oC. Before experiments, myocytes were permeabilized (0.1% triton or saponin), incubated with KCNQ1 (rabbit) and KCNE1 (mouse) Abs, followed by Alexa-conjugated secondary Abs. Fluorescence images were obtained using Zeiss 510 confocal microscope in sequence: DAPI (405 nm/band pass (BP) 420–480 nm), Alexa-488 (488 nm/BP 493–530 nm), and Alexa-568 (561 nm/BP 570–630 nm). Colocalization was analyzed using thresholded Pearson correlation coefficient of the Volocity program (PerkinElmer Life Sciences).
On-line supplement
Detailed methods are provided in on-line Supplemental Materials.
RESULTS
Chronic Ang II administration induced adverse remodeling in guinea pig hearts
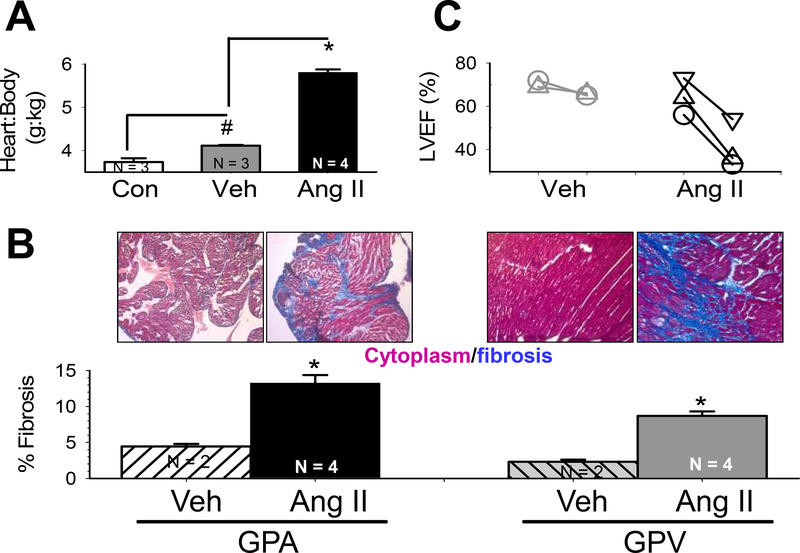
We quantified the heart:body weight (H:B) ratio of 3 groups of guinea pigs (Fig. 1A). Compared to CON group, Veh group showed a modest but statistically significant increase in H:B ratio, reflecting response to mild stress from minipump implantation. Ang II group showed a much more dramatic increase in H:B ratio, confirming the hypertrophic effect of chronic Ang II treatment. These are corroborated with measurements of myocyte size (see below). Ang II group showed marked increase in % fibrosis in both atria and ventricles (GPA and GPV, Fig. 1B), confirming the fibrosis-promoting effect of chronic Ang II treatment. Echo of the same GPs before and after 2 weeks of Veh or Ang II treatment showed that left ventricular ejection fraction did not change in Veh animals but markedly declined in Ang II animals (Fig. 1C). Together, these data confirmed the effectiveness of chronic Ang II administration through subcutaneous minipumps in the guinea pig model.
Fig. 1. Effects of chronic Ang II administration on guinea pig hearts.
(A) Heart-to-body weight ratio was modestly elevated in animals implanted with vehicle-containing minipump, but markedly increased in those implanted with Ang II-containing minipump, relative to age-matched control (Veh, Ang and CON, respectively). (B) Ang II animals showed marked increase in interstitial fibrosis in both atria and ventricles, relative to Veh animals. Top: Images of Masson’s trichrome stain. Bottom: Quantification of % of fibrotic area in the samples. N=number of hearts examined. * p < 0.001, Ang II vs Veh. (C) Left ventricular ejection fraction (LVEF) dropped in Ang II, but not Veh, animals. Different symbols linked by lines represent different animals before and 2 weeks after minipump implantation.
Chronic Ang II administration differentially remodeled IKs between atrial and ventricular myocytes
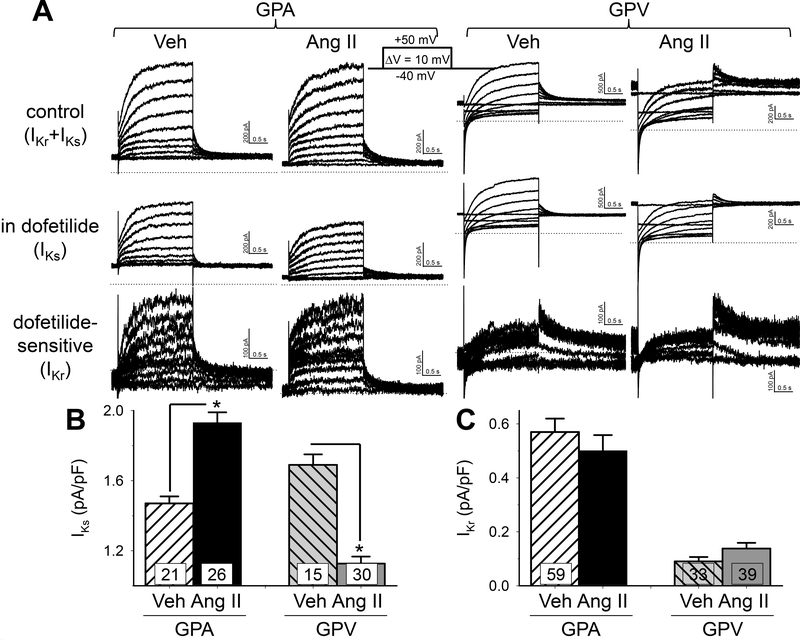
IKs and IKr overlap in voltage-range and time course of activation. Therefore, a prerequisite to quantify the effects of Ang II treatment on IKs is to separate it from IKr. This can be done using dofetilide: IKs was ‘dofetilideinsensitive’ and IKr was ‘dofetilide-sensitive’ (Fig. 2A). Unfortunately, not all myocytes could sustain dofetilide wash-in while maintaining stable giga-ohm seal and current amplitudes for successful IKs and IKr separation. To increase data acquisition for statistical analysis, we quantified IKs as peak tail amplitude at −20 mV after 2-s to +40 mV, and IKr as peak tail amplitude at −60 mV after 2-s to −20 mV. Fig. S1 validates these measurements. These values are further divided by cell capacitance as current densities for statistical analysis. Relative to Veh group, chronic Ang II treatment led to an increase in IKs current density in GPA but a decrease in GPV myocytes (Fig. 2B). This was selective for IKs, as chronic Ang II had no effects on IKr relative to Veh group.
Fig. 2. Effects of chronic Ang II administration on the slow and rapid delayed rectifier currents (IKs and IKr) of guinea pig atrial and ventricular myocytes.
(A) Representative current traces recorded from GPA and GPV myocytes from Veh and Ang II animals. Currents were elicited by the diagrammed voltage clamp protocol. Top row: control (Ικγ+Iks)· Second row: in 1 uM dofetilide (IKs)· Subtracting IKs from control produced dofetilide-sensitive current (third row, ΙΚγ). (B) and (C) Summary of lKs and lKr current density in GPA and GPV myocytes from Veh and Ang ll animals. For each cell, lKs was measured as peak tail current amplitude at −20 mV following a 2-s pulse to +40 mV, and lKr was measured as peak tail current amplitude at −60 mV following a 2-s pulse to +20 mV. Validation of such measurements is presented in Fig. S1. Both were normalized by cell capacitance. * p < 0.05 Ang ll vs Veh.
Chronic Ang II administration remodels IKs by different mechanisms
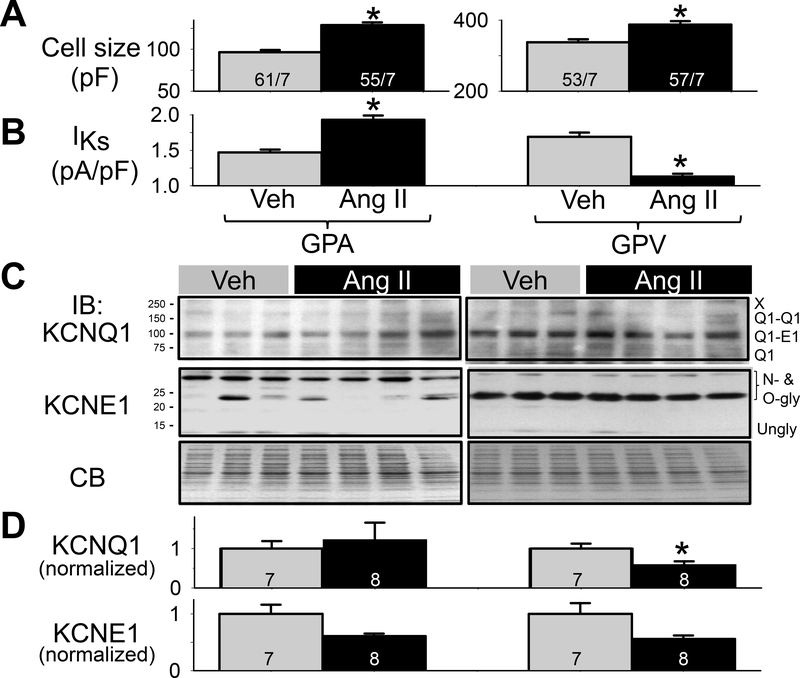
Cell sizes estimated by capacitive transients during patch clamp recordings, along with IKs current densities (replotted from Fig. 2B) are presented in Fig. 3A and 3B. Both GPA and GPV myocyte sizes were significantly increased in Ang II vs Veh groups, indicating that the population of single myocytes used in patch clamp experiments had been remodeled by the previous Ang II treatment.
Fig. 3. Effects of chronic Ang II administration on KCNQ1 and KCNE1 protein levels in guinea pig atria and ventricles.
(A) Cell size measured by cell capacitance in the 4 groups of myocytes. n/M: number of myocytes examined/number of animals. (B) lKs current densities from the 4 groups of myocytes (same as Fig. 2B). (C) Immunoblot images of whole tissue lysates (50 ug/lane) prepared from atria and left ventricles of 3 Veh and 4 Ang ll animals. CB: Coomassie-blue stain of gel as loading control. Size marker bands (in kDa) noted on left. Bands of interest and their nature noted on right. (D) Summary of densitometry. The intensities of bands of interest were combined, and normalized by the mean value of Veh lanes from the same membrane. Number of animals noted in histogram bars. One-way ANOVA, p < 0.01, followed by pair-wise test, * p < 0.05, Ang ll vs Veh in KCNQ1 protein level.
To investigate the mechanism(s) by which chronic Ang II treatment differentially remodeled IKs in GPA and GPV myocytes, we quantified the protein levels of KCNQ1 and KCNE1 in Veh and Ang II hearts under two conditions: WTL from GPA and GPV tissue chunks from Veh (3) and Ang II (4) hearts snap-frozen in liquid nitrogen (Fig. 3C), or WCL from GPA and GPV myocytes after collagenase treatment from Veh (4) or Ang II (4) hearts (Fig. S2). Guinea pig KCNQ1 (NP_001166292.1) is 74 kDa in size. However, in SDS-PAGE KCNQ1 migrated as a 74, ~100, ~150 and ≥ 250 kDa bands (Fig. 3C and Fig. S2). This is similar to the KCNQ1 banding pattern reported previously13, which has been identified as Q1 monomer, Q1-E1 heterodimer, Q1-Q1 homodimer, and higher-order oligomers (marked by ‘X’). Guinea pig KCNE1 (NP_001166443.1) is 14 kDa in size. In SDS-PAGE, KCNE1 migrated as ~40, 35, 25, and 20 kDa bands and a very faint 14 kDa band (Fig. 3C and Fig. S2). This is similar to the KCNE1 banding pattern reported previously13, which has been identified as N- and O-glycosylated KCNE1 forms14 and unglycosylated form. To quantify KCNQ1 and KCNE1 protein levels in Veh and Ang hearts and to combine data from multiple immunoblots (WTL, Fig. 3C, and WCL, Fig. S2), we summed the intensities of all band of interest (labeled on the right side of the immunoblots) and normalized the value by the mean value of Veh lanes of the same immunoblots. We then performed statistical analysis on the combined data (Fig. 3D). The only statistically significant difference between Veh and Ang II was the KCNQ1 protein level in GPV (reduced in Ang II, p<0.05). Although KCNE1 protein level trended lower in Ang II vs Veh in both GPA and GPV, the difference did not reach p < 0.05.
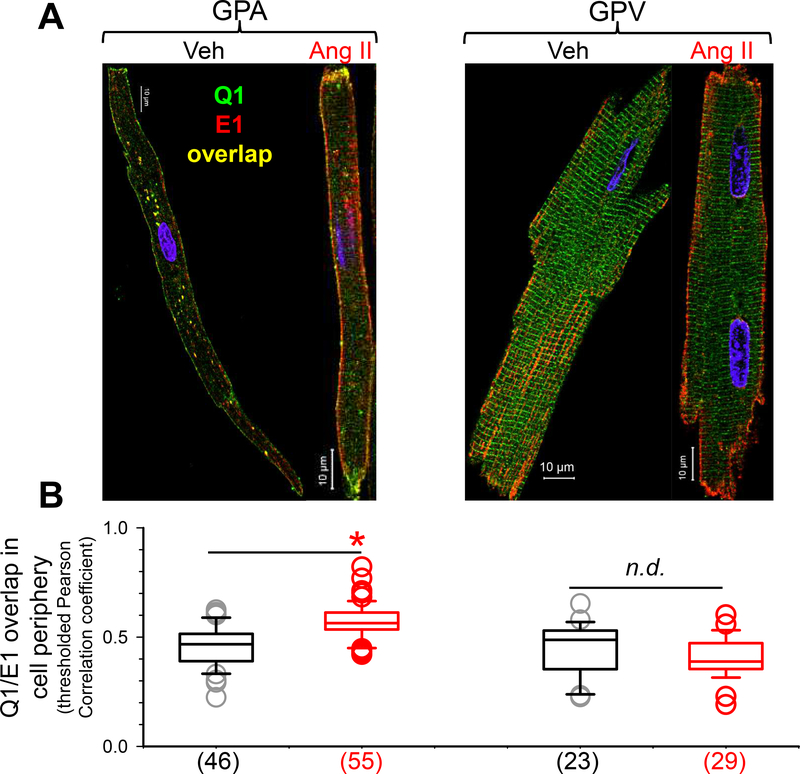
To further probe the mechanisms for IKs remodeling after chronic Ang II treatment, we studied the distribution patterns of KCNQ1 and KCNE1 and their relationship in myocytes. We used rabbit and mouse Abs targeting KCNQ1 and KCNE1, respectively, followed by Alexa488- and Alexa568-conjugated secondary Abs targeting rabbit and mouse IgG. Fig. 4A depicts representative immunofluorescence images. As reported previously15, KCNE1 was distributed along the lateral surface in both GPA and GPV myocytes. KCNQ1 was distributed as striations along the z-lines in GPV myocytes and, to a lesser degree, in GPA myocytes. We have shown that the striation pattern represents KCNQ1 reservoir in the junctional sarcoplasmic reticulum (jSR) compartment12. Ang II treatment did not grossly alter the distribution patterns of either KCNQ1 or KCNE1. To explore whether Ang II altered the relationship between KCNQ1 and KCNE1, we quantified the degree of their overlap in myocyte periphery (a space ~ 2 um within the border of myocyte immunofluorescence image) using Pearson correlation coefficient. The value of Pearson correlation coefficient ranges from +1 (total overlap) to −1 (mutual exclusion), with zero meaning no correlation. Fig. 4B sows that Ang II treatment significantly increased the degree of KCNQ1/KCNE1 overlap in GPA myocyte periphery. This is interpreted as an increase in KCNQ1/KCNE1 assembly on the myocyte surface. This interpretation has been validated by acceptor photobleach fluorescence resonance energy transfer (apFRET) between KCNQ1 and KCNE1 in GP cardiomyocytes15. On the other hand, Ang II treatment did not change the degree of KCNQ1/KCNE1 overlap or assembly in GPV myocytes.
Fig. 4. Effects of chronic Ang II administration on subcellular distribution of KCNQ1 and KCNE1 in guinea pig atrial and ventricular myocytes.
(A) Confocal images of native KCNQ1 and KCNE1 detected as Alexa488 ‘green’ and Alexa568 ‘red’, respectively. (B) Box plot of degree of KCNQ1/KCNE1 overlap in cell periphery, quantified by Pearson correlation coefficients of immunofluorescence signals that were above threshold (pixels in cell free areas). Numbers of myocytes analyzed are shown in parentheses; * t-test, Ang ll vs Veh, p < 0.05.
Chronic Ang II administration differentially modulates action potentials and ICal in GPA and GPV myocytes
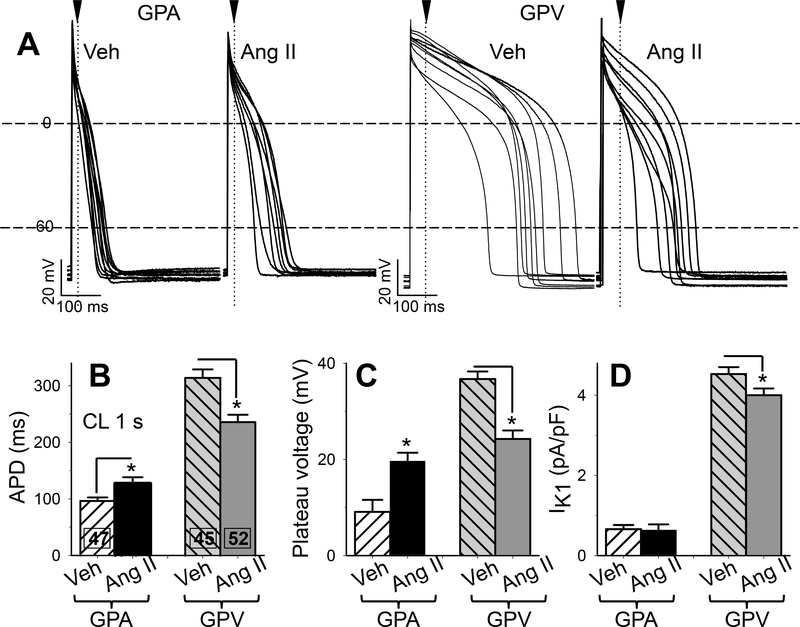
If IKs is the sole determinant of action potential duration (APD) in GP cardiomyocytes, we expected to see APD shortening in GPA and APD prolongation in GPV myocytes from Ang II animals. Surprisingly, Fig. 5A and 5B show that the opposite was observed: relative to myocytes from Veh animals, Ang II treatment prolonged APD in GPA myocytes but shortened APD in GPV myocytes. Ang II treatment also lowered the AP plateau voltage in GPV myocytes (Fig. 5C). There was a trend of higher plateau voltage in GPA myocytes from Ang II animals but the difference did not reach p < 0.05.
Fig. 5. Effects of chronic Ang II administration on action potential duration, plateau voltage, and outward IK1 current densities of guinea pig atrial and ventricular myocytes.
(A) Superimposed action potential traces (APs) recorded from 8–10 each of 4 groups of myocytes. Cycle length (CL) was 1 s. Dashed horizontal lines denote 0 and −60 mV. Arrowheads and dotted vertical lines denote the time point when plateau voltages were measured. (B) Action potential duration (APD) measured as interval between upstroke and when membrane voltage repolarized to −60 mV. (C) Plateau voltage measured as voltage 20 ms (GPA) or 50 ms (GPV) after the upstroke. (D) IK1 current density based on the highest value of outward IK1 current (typically at −50 mV), normalized by cell capacitance. Numbers of myocytes studied are listed (from 7 each of Veh and Ang II animals). * t-test, Ang II vs Veh, p < 0.05.
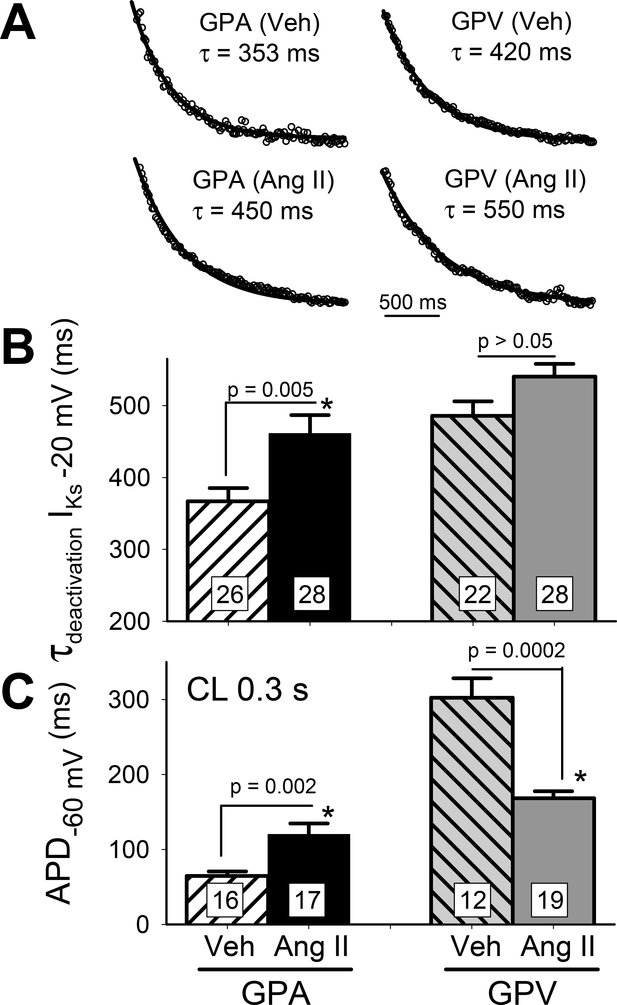
IKs deactivation (at −20 mV) in all 4 groups of myocytes could be well-fit with single-exponential function (Fig. 6A), enabling comparison of IKs deactivation rate by τ values (Fig. 6B): Ang II treatment markedly slowed IKs deactivation in GPA but not GPV myocytes. To check whether we could unmask changes in APD due to IKs remodeling, we quantified APD at cycle length of 0.3 s (Fig. 6C): in Ang II relative to Veh groups, APD was still prolonged in GPA but shortened in GPV myocytes. Thus, the changes in APD cannot be explained by Ang II-induced changes in IKs gating.
Fig. 6. chronic Ang II administration slows IKs deactivation in GPA but not GPV myocytes and this kinetic effect does not explain Ang II-induced changes in APD.
(A) Representative cases of single exponential fit (curves) to IKs tail currents at −20 mV (data points shown as open circles). Best-fit values of time constant (t) are noted. (B) Summary of τ of IKs deactivation. (C) Summary of APD at CL 0.3 s. Numbers of myocytes (from 4 animals) patch clamped are noted in n histogram bars, with p-values for t-test between Veh and Ang II noted.
These observations indicated that other currents remodeled by chronic Ang II treatment contributed to changes in APD and plateau voltage. A role of IKr was ruled out because Ang II treatment did not alter IKr current density in either GPA or GPV myocytes (Fig. 2C). A second possibility was IK1, which contributes outward current during phase 3 of action potentials in GP cardiomyocytes16. We quantified the peak outward IK1 current densities (occurred at ~ −50 mV, corresponding to phase 3 voltage) in the four groups of myocytes. Fig. 5D shows that Ang II treatment did not alter IK1 in GPA myocytes, and caused a modest yet significant decrease in IK1 in GPV myocytes. These observations cannot explain the changes in APD and plateau voltage of GP cardiomyocytes from Ang II animals.
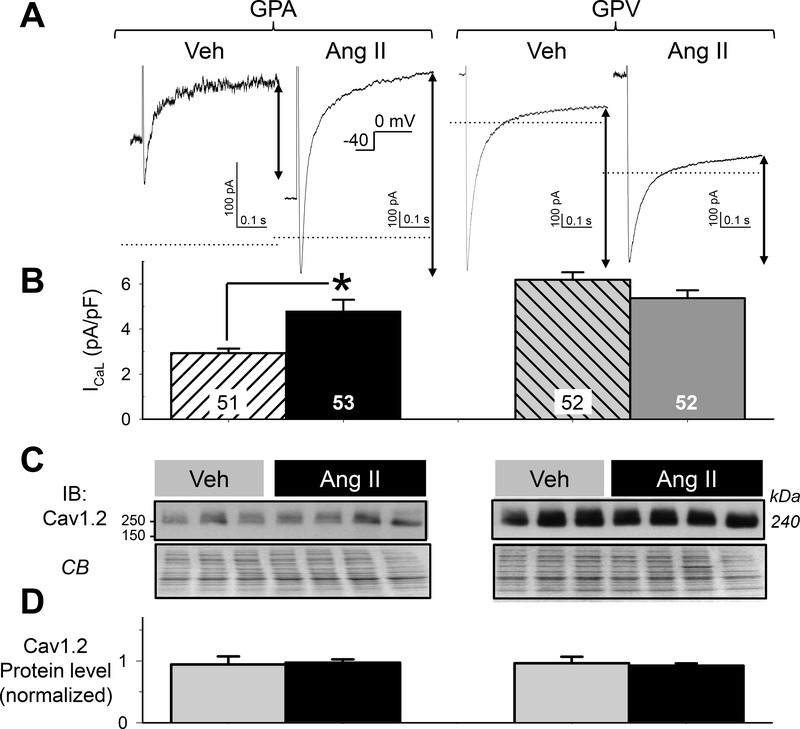
A third possibility was ICaL, which contributes inward current to sustain AP plateau voltage and can prolong APD16. Fig. 7 depicts current traces and the quantification of peak ICaL amplitude in GPA and GPV myocytes from Veh and Ang II animals. Ang II treatment increased ICaL current density in GPA myocytes (Fig. 7B), although there was no change in the protein level of pore-forming subunits Cav1.2 (Fig. 7C and 7D). Ang II treatment did not change ICaL current density or Cav1.2 protein level in GPV myocytes.
Fig. 7. Effects of chronic Ang II administration on the L-type Ca (ICaL) current densities in guinea pig atrial and ventricular myocytes.
(A) Representative current traces 4 groups of myocytes elicited by depolarizing pulses from Vh −40 mV to 0 mV. Dotted horizontal lines denote the zero current level. ICaL was quantified as the difference between the peak inward-going current and current level 500 ms into the pulse (double-arrow lines). (B) Summary of ICaL current densities. Numbers of myocytes studied are listed (from 7 each of Veh and Ang II animals). * t-test, Ang II vs Veh, p < 0.05. (C) Cav1.2 immunoblot images of whole tissue lysates (50 ug/lane) prepared from atria and left ventricles of 3 Veh and 4 Ang II animals, with CB staining as loading control. (D) Summary of densitometry. Cav1.2 band intensities were normalized by mean value of Veh lanes from the same membrane. There was no difference in Cav1.2 protein level among the 4 groups of samples.
DISCUSSION
In cardiac myocytes, action potential durations (APDs) play a key role in determining myocyte contractility and help shaping the pattern of AP propagation through the myocardial syncytium. APD is regulated by a delicate balance between inward (mainly ICaL) and outward (Ito, IKr, IKs, IK1) currents3, in a region- and contextdependent manner. Under basal conditions IKr and IK1 are the major determinants of ventricular APD, while during high β-adrenergic activity, IKs is critical for shortening ventricular APD2, 3. Under pathological conditions time-independent currents through ATP-regulated K channels (IK,ATP), small-conductance Ca-activated K channels (ISK)17, and volume-regulated Cl channels (ICl,swell)18, may also come into play in AP repolarization. Understanding how these channels are regulated by myocytes from different regions of the heart under diverse conditions and how their balance is perturbed under pathological pro-arrhythmic conditions, are prerequisite to designing effective anti-arrhythmic strategies.
Our purpose was to understand how chronic elevation of Ang II level in vivo remodeled the electrical activity of atrial and ventricular myocytes. In particular, we were interested in the effects on IKs. Although IKs is the major component of ‘repolarization reserve’ in human heart2, such information was totally missing in previous studies of electrical remodeling following chronic Ang II elevation using rodent models10.
In GPA myocytes, chronic Ang II elevation caused an increase in both IKs and ICaL, without altering IKr or IK1. APDs measured at CLs of 1 and 0.3 s were prolonged, suggesting that the impact of increase in ICaL outweighed that of increase in IKs. The increase in both IKs and ICaL in Ang II-treated GPA myocytes were reminiscent of the effects of PKA activation. It has been shown that acute Ang II exposure can increase cAMP production following β-adrenergic stimulation19. We believe this is unrelated to our observations reported here, because our patch clamp experiments were conducted in the absence of Ang II. The increase in IKs in GPA myocytes was correlated with an increase in KCNQ1/KCNE1 colocalization on myocyte surface, while the KCNQ1 protein level was unaltered and KCNE1 protein level trended lower in Ang II-treated GPA tissue or myocytes. The increase in ICaL of GPA myocytes was not accompanied by an increase in the protein level of pore-forming component, Cav1.2. Future experiments will test whether Ang II treatment induced changes in the protein levels of other components of the L-type Ca channel (β, γ, and α2-δ subunits), and whether there were changes in the subcellular distribution of Cav1.2 or other subunits.
In GPV myocytes, chronic Ang II treatment caused a decrease in IKs and IK1, without altering IKr or ICaL. The decrease in IKs was correlated with a significant decrease in the KCNQ1 protein level, trend of lower KCNE1 protein, while the degree of KCNQ1/KCNE1 colocalization on GPV myocyte surface was not altered. Opposite to the expectation based on the decrease in both IKs and IK1 (prolonging APD), APDs at CLs of 1 and 0.3 s were shortened along with lowering of plateau voltage, indicating impact of another current(s) remodeled by chronic Ang II elevation, which outweighed the impact of decrease in IKs and IK1. One candidate is ICl,swell, which can be activated by AT1R stimulation20. Persistent activation of ICl,swell has been observed in a canine model of heart failure induced by chronic tachypacing18. Activation of ICl,swell will lead to an increase in time-independent outward current at voltages positive to −30 mV, lowering plateau voltage and shortening APD. Future experiments will test the role of ICl,swell in GPV myocytes.
Conclusion and Clinical implications
Chronic Ang II administration without other comorbidity can induce adverse structural remodeling in the heart. In terms of electrical remodeling, data reported here imply that increase in atrial IKs may contribute to risk for AF while decrease in ventricular IKs may contribute to long QT syndrome in diseased hearts. Alleviating such pro-arrhythmic electrical remodeling by angiotensin-converting enzyme (ACE) inhibitors or AT1R blockers may contribute to their beneficial therapeutic effects.
Supplementary Material
ACKNOWLEDGEMENTS
Confocal microscopy was performed at the Virginia Commonwealth University - Department of Neurobiology & Anatomy Microscopy Facility, supported in part by NIH-NINDS Center Core Grant 5P30NS047463.
FUNDING
This study was supported by the National Institutes of Health [HL128610] and the American Heart Association [16GRNT29920012].
Abbreviations:
- Ang II
angiotensin II
- AT1R
angiotensin type 1 receptor
- GPA
guinea pig atria or atrial myocytes
- GPV
guinea pig ventricles or ventricular myocytes
- WTL
whole tissue lysate
- WCL
whole cell lysate
- SDS-PAGE
sodium dodecyl sulfate polyacrylamide gel electrophoresis
- jSR
junctional sarcoplasmic reticulum
- Vh
holding voltage
- Vt
test pulse voltage
- Vr
repolarization voltage
Footnotes
Conflict of interest: None
Publisher's Disclaimer: This is a PDF file of an unedited manuscript that has been accepted for publication. As a service to our customers we are providing this early version of the manuscript. The manuscript will undergo copyediting, typesetting, and review of the resulting proof before it is published in its final citable form. Please note that during the production process errors may be discovered which could affect the content, and all legal disclaimers that apply to the journal pertain.
REFERENCES
- 1.Dong M-Q, Lau C-P, Gao Z, Tseng G-N, Li G-R. Characterization of recombinant human cardiac KCNQ1/KCNE1 channels (Iks) stably expressed in HEK293 cells. J Memb Biol. 2006;210:183–192. [DOI] [PubMed] [Google Scholar]
- 2.Jost N, Virag L, Bitay M, Takacs J, Lengyel C, Biliczki P, Nagy Z, Bogats G, Lathrop DA, Papp JG, Varro A. Restricting excessive cardiac action potential and QT prolongation. A vital role for IKs in human ventricular muscle. Circulation. 2005;112:1392–1399. [DOI] [PubMed] [Google Scholar]
- 3.Jost N, Virag L, Comtois P, Ordog B, Szuts V, Seprenyi G, Bitay M, Kohajda Z, Koncz I, Nagy N, Szel T, Magyar J, Kovacs M, Puskas LG, Lengyel C, Wettwer E, Ravens U, Nanasi PP, Papp JG, Varro A, Nattel S. Ionic mechanisms limiting cardiac repolarization reserve in humans compared to dogs. J Physiol. 2013;591:4189–4206. [DOI] [PMC free article] [PubMed] [Google Scholar]
- 4.Thompson E, Eldstrom J, Westhoff M, McAfee D, Balse E, Fedida D. cAMP-dependent regulation of IKs single-channel kinetics. J Gen Physiol. 2017;149:781–798. [DOI] [PMC free article] [PubMed] [Google Scholar]
- 5.Sarkar AX, Sobie EA. Quantification of repolarization reserve to understand interpatient variability in the response to proarrhythmic drugs: A computational analysis. Heart Rhythm. 2016;8:1749–1755. [DOI] [PMC free article] [PubMed] [Google Scholar]
- 6.Sanguinetti MC, Curran ME, Zou A, Shen J, Spector PS, Atkinson DL, Keating MT. Coassembly of KvLQT1 and minK (IsK) proteins to form cardiac IKs potassium channel. Nature. 1996;384:80–83. [DOI] [PubMed] [Google Scholar]
- 7.Chan PJ, Osteen JD, Xiong D, Bohnen MS, Doshi D, Sampson KJ, Marx SO, Karlin A, Kass RS. Characterization of KCNQ1 atrial fibrillation mutations reveals distinct dependence on KCNE1. J Gen Physiol. 2012;139:135–144. [DOI] [PMC free article] [PubMed] [Google Scholar]
- 8.Liu X-S, Jiang M, Zhang M, Tang D, Higgins RSD, Tseng G-N. Electrical remodeling in a canine model of ischemic cardiomyopathy. Am J Physiol. 2007;292:H560–H571. [DOI] [PubMed] [Google Scholar]
- 9.Caballero R, de la Fuente MG, Gomez R, Barana A, Amoros I, Dolz-Gaiton P, Osuna L, Almendral J, Atienza F, Fernandez-Aviles F, Pita A, Rodriguez-Roda J, Pinto A, Tamargo J, Delpon E. In humans, chronic atrial fibrillation decreases the transient outward current and ultrarapid component of the delayed rectifier current differentially on each atria and increases the slow component of the delayed rectifier current in both. J Am Coll Cardiol. 2010;55:2346–2354. [DOI] [PubMed] [Google Scholar]
- 10.Kasi VS, Xiao HD, Shang LL, Iravanian S, Langberg J, Withman EA, Jiao Z, Gallego CJ, Bernstein KE, Dudley SC Jr. Cardiac-restricted angiotensin-converting enzyme overexpression causes conduction defects and connexin dysregulation. Am J Physiol. 2007;293:H182–H192. [DOI] [PMC free article] [PubMed] [Google Scholar]
- 11.Salloum FN, Abbate A, Das A, Houser J-E, Mudrick CA, Qureshi IZ, Hoke NN, Roy SK, Brown WR, Prabhakar S, Kukreja RC. Sildenafil (Viagra) attenuates ischemic cardiomyopathy and improves left ventricular function in mice. Am J Physiol. 2008;294:H1398–H1406. [DOI] [PubMed] [Google Scholar]
- 12.Jiang M, Wang Y-H, Tseng G-N. Adult ventricular myocytes segregate KCNQ1 and KCNE1 to keep the IKs amplitude in check until when larger IKs is needed. Circ Arrhythm Electrophysiol. 2017;10:e005084. [DOI] [PMC free article] [PubMed] [Google Scholar]
- 13.Chung DY, Chan PJ, Bankston JR, Yang L, Liu G, Marx SO, Karlin A, Kass RS. Location of KCNE1 relative to KCNQ1 in the IKs potassium channel by disulfide cross-linking of substituted cysteins. PNAS. 2009;106:743–748. [DOI] [PMC free article] [PubMed] [Google Scholar]
- 14.Chandrasekhar KD, Lvov A, Terrenoire C, Gao GY, Kass RS, Kobertz WR. O-glycosylation of the cardiac IKs complex. J Physiol. 2011;589:3721–3730. [DOI] [PMC free article] [PubMed] [Google Scholar]
- 15.Wang Y-H, Zankov DP, Jiang M, Zhang M, Henderson SC, Tseng G-N. [Ca]¡ elevation and oxidative stress induce KCNQ1 translocation from cytosol to cell surface and increase IKs in cardiac myocytes. J Biol Chem. 2013;288:35358–35371. [DOI] [PMC free article] [PubMed] [Google Scholar]
- 16.Hume JR, Uehara A. Ionic basis of the different action potential configurations of single guinea pig atrial and ventricular myocytes. J Physiol. 1985;368:525–544. [DOI] [PMC free article] [PubMed] [Google Scholar]
- 17.Chiamrimonvat N, Chen-Izu Y, Clancy CE, Deschenes I, Dobrev D, Heijman J, Izu L, Qu Z, Ripplinger CM, Vandenberg JI, Weiss JN, Koren G, Banyasz T, Grandi E, Sanguinetti MC, Bers DM, Nerbonne JM. Potassium currents in the heart: functional roles in repolarization, arrhythmia and therapeutics. J Physiol. 2017;595:2229–2252. [DOI] [PMC free article] [PubMed] [Google Scholar]
- 18.Clemo HF, Stambler BS, Baumgarten CM. Swelling-activated chloride current is persistently activated in ventricular myocytes from dogs with tachycardia-induced congestive heart failure. Circ Res. 1999;84:157–165. [DOI] [PubMed] [Google Scholar]
- 19.Kubalak SW, Webb JG. Angiotensin II enhancement of hormone-stimulated cAMP formation in cultured vascular smooth muscle cells. Am J Physiol. 1993;264:H86–H96. [DOI] [PubMed] [Google Scholar]
- 20.Browe DM, Baumgarten CM. Angiotensin II (AT1) receptors and NADPH oxidase regulate Cl− current elicited by β1 integrin stretch in rabbit ventricular myocytes. J Gen Physiol. 2004;124:273–287. [DOI] [PMC free article] [PubMed] [Google Scholar]
Associated Data
This section collects any data citations, data availability statements, or supplementary materials included in this article.


