

Many coronaviruses (CoVs) possess conserved motifs YxxΦ and/or KxHxx/KKxx in the cytoplasmic tail of the S protein. The KxHxx/KKxx motif has been identified as the ER retrieval signal, but the function of the YxxΦ motif in the intracellular sorting of CoV S proteins remains controversial. In this study, we showed that the YxxΦ of PEDV S protein is an endocytosis signal. Furthermore, using reverse genetics technology, we evaluated its role in PEDV pathogenicity in neonatal piglets. Our results explain one attenuation mechanism of Vero cell-adapted PEDV variants lacking functional YxxΦ and KVHVQ motifs. Knowledge from this study may aid in the design of efficacious live attenuated vaccines against PEDV, as well as other CoVs bearing the same motif in their S protein.
KEYWORDS: PEDV, YxxΦ, coronavirus, endocytosis, spike, virulence
ABSTRACT
Porcine epidemic diarrhea virus (PEDV) causes high mortality in neonatal piglets. The PEDV spike (S) protein contains two intracellular sorting motifs, YxxΦ (tyrosine-based motif YEVF or YEAF) and KVHVQ at the cytoplasmic tail, yet their functions have not been fully elucidated. Some Vero cell-adapted and/or attenuated PEDV variants contain ablations in these two motifs. We hypothesized that these motifs contribute to viral pathogenicity. By transiently expressing PEDV S proteins with mutations in the motifs, we confirmed that the motif KVHVQ is involved in retention of the S proteins in the endoplasmic reticulum (ER)-Golgi intermediate compartment (ERGIC). In addition, we showed that the YxxΦ motif triggers endocytosis of S proteins. These two motifs synergistically regulate the level of S expressed on the cell surface. To investigate their role in viral pathogenicity, we generated three recombinant PEDVs by introducing deletions or a mutation in the two motifs of the infectious clone of PEDV PC22A strain (icPC22A): (i) icΔ10aa (ΔYxxΦEKVHVQ), (ii) icΔ5aa (ΔKVHVQ), and (iii) icYA (Y1378A, to an inactivated motif, AEVF). Infection of Vero cells with icΔ10aa resulted in larger syncytia and more virions, with reduced numbers of S protein projections on the surface compared with icPC22A. Furthermore, we orally inoculated five groups of 5-day-old gnotobiotic piglets with the three mutants, icPC22A, or a mock treatment. Mutant icΔ10aa caused less severe diarrhea rate and significantly milder intestinal lesions than icPC22A, icΔ5aa, and icYA. These data suggest that the deletion of both motifs can reduce the virulence of PEDV in piglets.
IMPORTANCE Many coronaviruses (CoVs) possess conserved motifs YxxΦ and/or KxHxx/KKxx in the cytoplasmic tail of the S protein. The KxHxx/KKxx motif has been identified as the ER retrieval signal, but the function of the YxxΦ motif in the intracellular sorting of CoV S proteins remains controversial. In this study, we showed that the YxxΦ of PEDV S protein is an endocytosis signal. Furthermore, using reverse genetics technology, we evaluated its role in PEDV pathogenicity in neonatal piglets. Our results explain one attenuation mechanism of Vero cell-adapted PEDV variants lacking functional YxxΦ and KVHVQ motifs. Knowledge from this study may aid in the design of efficacious live attenuated vaccines against PEDV, as well as other CoVs bearing the same motif in their S protein.
INTRODUCTION
Porcine epidemic diarrhea virus (PEDV) infects pigs of all ages. Since 2010, highly virulent PEDV variants have emerged in swine farms in Asia, North America, and Europe, resulting in significant economic losses globally to pork producers (1–4). Taxonomically, PEDV is a member of the Alphacoronavirus genus within the Coronaviridae family. The mature PEDV virion consists of four structural proteins: spike (S), envelope (E), membrane (M), and nucleocapsid (N) proteins. As the major glycoprotein on the PEDV envelope, S proteins form trimers, which appear as projections on the surface of a virion using an electron microscope, and bind to cellular receptors and mediate virus-host membrane fusion. Proteolytic cleavage of S proteins expressed on the cell surface triggers syncytium formation (5, 6).
Like those of other coronaviruses (CoVs), PEDV virions assemble at the endoplasmic reticulum (ER)-Golgi intermediate compartments (ERGIC) (7–9). The amounts of PEDV S proteins in the ERGIC, in other organelles, or on the cell surface are likely regulated by two nearby motifs in its cytoplasmic tail (CT): a tyrosine-based motif, YxxΦ (x is any residue and Φ is a bulky hydrophobic residue: F, M, I, L, or V), and an ER retrieval signal (ERRS), KVHVQ (10–13), as well as other viral and cellular proteins. The CoV ERRS, either in the dilysine or the dibasic form (KxKxx, KKxx, or KxHxx), is a weak ERGIC retention signal (14, 15). It interacts with coatomer complex I (COPI), a cellular protein involved in cargo transportation from the Golgi to ER, and prevents large amounts of the S proteins from being transported to the cell surface through the canonical secretory pathway (16, 17). In addition, the ERRS in the S protein of severe acute respiratory syndrome CoV (SARS-CoV) promotes the interaction between S and M proteins in the Golgi region (16). Inactivation of the ERRS in the SARS-CoV S protein impaired its incorporation into virus-like particles when coexpressed with the M in the cells (15). For PEDV, the amino acid sequence of the ERRS is KVHVQ, which is highly conserved among different genotypes. One study demonstrated that a single amino acid substitution in this motif (KVHVQ to KVRVQ) weakens the intracellular retention function of the S proteins of the 10th passage of a murine-adapted PEDV variant, MK-P10 (18), resulting in enhanced syncytium formation in Vero cells. However, this impaired KVRVQ motif does not alter the incorporation of S into the MK-P10 virions (6).
Although the YxxΦ motif is a well-studied, clathrin-dependent endocytosis signal among numerous viral and host cellular transmembrane proteins (19–25), its function in CoV S proteins has not been fully understood. Most S proteins of alphacoronaviruses, such as transmissible gastroenteritis virus (TGEV), and gammacoronaviruses, such as infectious bronchitis virus (IBV), contain this motif in their CTs (Fig. 1A). A previous study demonstrated that the YxxΦ motif is responsible for intracellular retention but not endocytosis of TGEV S proteins into cells (13). Interestingly, this retention signal could be transformed into a strong endocytosis signal when the first lysine residue of the TGEV KxHxx motif was replaced by methionine (YEPIEK VHVH to YEPIEM VHVH; change is in bold type and YxxΦ and KxHxx motifs are underlined) (26). For IBV, the role of the YxxΦ motif in S protein intracellular transport is controversial. One group reported that this motif is not an endocytosis signal (11). The other group demonstrated that the YxxΦ motif functioned as an endocytosis signal in a chimeric protein composed of the vesicular stomatitis virus (VSV) G protein ectodomain and the CT of the IBV S protein (14). It has also been demonstrated that a recombinant IBV harboring a mutated YxxΦ (YTTF to YTTA) in the CT of the S protein could not be recovered in cell culture, suggesting the essential role of this motif in the IBV life cycle. Moreover, since the 3′end of the IBV S gene overlaps with the transcription regulatory sequence (TRS) of accessory gene 3, mutagenesis of the IBV ERRS (KKSV to AASV) impaired the synthesis of subgenomic RNA 3 (sgRNA 3), resulting in decreased expression of E proteins in the IBV-infected cells (12).
FIG 1.

(A) Comparison of the C-terminal 24 amino acids of spike proteins among coronaviruses (CoVs). The YxxΦ motifs are marked in red, and the endoplasmic reticulum retrieval signals (ERRSs) are marked in blue. FIPV, feline infectious peritonitis virus; HCoV, human coronavirus; MERS-CoV, Middle East respiratory syndrome coronavirus; MHV, murine hepatitis virus; PDCoV, porcine deltacoronavirus. (B) Schematic of the plasmids expressing M protein or mCherry-tagged S proteins. CMV, cytomegalovirus promoter; Led Seq, 5′leader sequence of PEDV S sgRNA; mChy, mCherry gene; A25, 25-nucleotide poly(A) tail; HDV, hepatitis D virus ribozyme; BGH, bovine growth hormone terminator. (C) The C-terminal amino acid sequences of two wild-type (WT) S proteins and the 10 mutants. WT1 and WT2 contain the YEVF and YEAF motifs, respectively.
Previously, we generated an attenuated PEDV strain by serially passaging a highly virulent strain, PC22A, in Vero cells. At the 120th (P120) and later passages, we identified a premature stop codon in the 3′end of the S gene (27). This stop codon truncates the S protein by 9 amino acids (aa) (EVFEKVHVQ). Interestingly, at least five PEDV variants (FL2013, SM-98, CHM2013, AVCT12, and KNU-141112) containing a premature terminated S gene have been reported (Table 1) (28–31). All these PEDV variants are either cell culture attenuated or clinically mild in pigs, except for AVCT12, whose pathogenicity is unknown. These variants share the same S truncation pattern as PC22A-P120: partially ablated YxxΦ and completely deleted KVHVQ. It is possible that the loss of KVHVQ may enhance the surface S protein level and increase its ability to induce syncytia in cell culture. However, the function of the incomplete YxxΦ motif in viral replication and pathogenicity is unknown. Notably, two types of YxxΦ motif exist in the CTs of S proteins among PEDV genotypes: classical strains (G1a) and some highly virulent Asian strains (G2a) contain a YEAF motif, whereas highly virulent North American strains (G2b), S insertion and deletion (indel) strains (G1b), and some G2a strains harbor a YEVF motif. We hypothesized that the YxxΦ motif of PEDV, regardless of its amino acid sequence, is an endocytosis signal and determines viral virulence in pigs. In this study, we evaluated the phenotypes of transiently expressed S mutants containing mutations or deletions in these two motifs in mammalian cells and the virulence of three representative recombinant PEDVs in gnotobiotic piglets.
TABLE 1.
Representative PEDV strains with an intact S protein and strains with a truncated S protein and variations in the YxxΦ and KVHVQ motifs in the cytoplasmic tail
| Type of YxxΦ motif | Genotype | PEDV straina | S protein C-terminald motifs YxxΦ and KxHxx |
Pathogenicity | Disrupted start codon of ORF3 | GenBank no. (reference) |
|---|---|---|---|---|---|---|
| YEAF | G2a | GD-1/2011 | CRGPRLQP YEAF EKVHVQ . | Virulent | No | JX647847 (53) |
| G2a | FL2013 | CRGPRLQP YEA . | Mild | No | KP765609 (28) | |
| G1a | CV777 | CRGPRLQP YEAF EKVHVQ . | Virulent | No | AF353511 (54) | |
| G1a | MK-P10a | CRGPRLQP YEAF EKV RVQ . | Virulent | NA | NAe (6) | |
| G1a | SM-98 | CRGPRLQP YEA . | Attenuated | No | GU937797 (NA) | |
| G1a | CHM2013b | CRGPRLQP YEA . | Attenuated | No | KM887144 (30) | |
| G1a | AVCT12 | CRGPRLQP YEA . | NA | Yes | LC053455 (29) | |
| YEVF | G1b | Iowa106/2013 | CRGPRLQP YEVF EKVHVQ . | Mild | No | KJ645695 (50) |
| G2a | BJ-2011-1 | CRGPRLQP YEVF EKVHVQ . | Virulent | No | JN825712 (55) | |
| G2b | PC22A (wild type) | CRGPRLQP YEVF EKVHVQ . | Virulent | No | KU893861 (27) | |
| G2b | PC22A (P120) | CRGPRLQP Y . | Attenuated | No | KU893872 (27) | |
| G2b | KNU-141112c | CRGPRLQP YEV HD. | Attenuated | Yes | NA (31) |
Names of PEDV variants with truncated CTs of their S proteins are in bold.
An infectious clone-derived PEDV using CHM2013 as the template was attenuated in pigs.
The full name of this strain is KNU-141112-S-DEL2/ORF3 in the reference.
Amino acid sequences of the most C-terminal portions of spike proteins. Periods indicate stop codons. The YxxΦ motif is underlined and the KxHxx motif is in bold, except for the mutated amino acid.
NA, not available.
RESULTS
Motifs YxxΦ and KVHVQ regulate the levels of PEDV S proteins on the cell surface.
To determine the roles of the two motifs in the intracellular sorting of S proteins, we constructed 12 plasmids bearing a wild-type S gene (of PC22A) or an S gene with different mutations in the CTs (Fig. 1B and C). Also, the dispensable 197-aa region (residues 34 to 230) in domain 0 of each S protein was replaced by fluorescent protein mCherry (236 aa), as we demonstrated previously that this 197-aa region does not interfere with the formation of S protein trimers (32). WT1 and WT2 contain the YEVF and YEAF motifs, respectively. Using these two wild-type constructs as templates, we generated additional 10 mCherry-tagged S mutants, including mutants bearing point mutations and the CT-truncated variants (Fig. 1; Table 1). The Δ10aa mutant lacks both motifs. The Δ9aa and HD mutants contain the CTs of PEDV strains PC22A-P120 and KNU-141112, respectively. The Δ7aa mutant bears the same CT as four S-truncated PEDV variants, FL2013, SM-98, AVCT12, and CHM2013. MK-P10 contains the identical CT to that of the PEDV strain MK-P10. To evaluate the difference in functions between YEVF and YEAF, three pairs of mutants (YA and YA-A, Δ5aa and Δ5aa-A, and MK-P10 and MK-P10-V) were generated.
To confirm the role of the KVHVQ motif in ERGIC retention, transiently transfected Vero cells were fixed with methanol at 12 h posttransfection (hpt) and stained with an antibody against ERGIC marker ERGIC-53 (Fig. 2A). We observed distinct sorting patterns among the 12 recombinant S proteins. Quantification of the colocalization between the S protein and ERGIC signals was indicated as Pearson’s correlation coefficient (PCC) value (33, 34), by measuring 20 to 25 individual cells from each sample (Fig. 2B). The higher PCC values indicate the higher levels of colocalization between the two fluorescent signals. For the four S proteins (WT1, WT2, YA, and YA-A) with an intact KVHVQ motif in the CT, most intracellular S proteins were concentrated at the ERGIC region, with significantly higher PCC values than for the other S mutants (P < 0.05). Interestingly, only the six S proteins with an intact YxxΦ motif in their CTs (WT1, WT2, Δ5aa, Δ5aa-A, MK-P10, and MK-P10-V) formed clear puncta in the cells.
FIG 2.

An intact KVHVQ motif is required for retaining PEDV S proteins in the ERGIC region. (A) Immunofluorescent (IF) staining of ERGIC in the individual pUC19-sgRNA-S-transfected cells. Vero cells were transfected with individual plasmid DNA and fixed with methanol at 12 h posttransfection (hpt). Arrows indicate S puncta in the WT1-, WT2-, MK-P10-, MK-P10-V-, Δ5aa-, and Δ5aa-A-transfected cells. Scale bar: 10 μm. (B) Quantification of colocalization of S proteins and ERGIC. Twenty to 25 individual cells in each sample were selected randomly. Pearson’s correlation coefficient (PCC) values of the S and ERGIC signals in each cell are shown in the box-whisker plot. The boxes indicate interquartile ranges in different groups, the lines in the boxes represent median values, and the whiskers show the range of a group of values excluding the outliers (dots). Groups with statistically significant differences (P < 0.05) are indicated by different letters; the alphabetical order reflects groups with median values from high to low.
To determine the steady-state levels of these S proteins, we quantified the fluorescent intensities of the mCherry signals in 50 individual Vero cells of each sample at 12 hpt (Fig. 3B). No statistically significant difference (P > 0.05) was observed among samples, indicating that all the recombinant S proteins were expressed at similar levels. Next, we measured the levels of S proteins on the cell surface using digital quantitative method and syncytium induction assay. The transfected cells were fixed with 4% formaldehyde without permeabilization, and the surface S proteins were stained with green fluorescence (Fig. 3A). Total (both surface and intracellular) S proteins were observed for the red fluorescence. Since each S protein produces equal intensity of red fluorescent signal, we quantified the levels of surface S proteins by measuring the ratios of gray values of the green fluorescent signal to mCherry signal and designated it the surface/total ratio. Fifty individual cells in each sample were measured and are plotted in Fig. 3C. WT1 did not differ statistically from WT2. Eight mutants (Δ10aa, YA, YA-A, Δ9aa, Δ7aa, HD, MK-P10, and MK-P10-V) expressed higher levels of S proteins than the two wild-type S proteins on the cell surface, while Δ5aa and Δ5aa-A expressed significantly lower levels (P < 0.05). Because proteolytic cleavage of surface S proteins triggers cell-cell fusion, a syncytium induction assay was performed by culturing the transfected cells in medium containing trypsin. The syncytia induced by the eight mutants (Δ10aa, YA, YA-A, Δ9aa, Δ7aa, HD, MK-P10, and MK-P10-V) contained significantly more nuclei than those induced by the two wild types (WT1 and WT2), while almost no syncytia were induced by the Δ5aa and Δ5aa-A mutants (Fig. 3D and E). Collectively, these data suggest that an intact KVHVQ motif (WT1, WT2, YA, and YA-A) retains S proteins in the ERGIC, and the two motifs synergistically regulate the level of PEDV S protein expressed on the cell surface via different mechanisms.
FIG 3.

Mutation of the YxxΦ and KVHVQ motifs of PEDV S protein altered the expression of S proteins on the cell surface and syncytium formation. (A) IF staining of S proteins expressed on cell surface, or total (surface and intracellular) S proteins (Total S). Vero cells were fixed by 4% formaldehyde at 12 h after transfection with plasmid DNA. Without permeabilization, surface S proteins were stained with guinea pig antiserum GP17 against PEDV S1 followed by Alexa Fluor 488 (AF488)-conjugated goat anti-guinea pig IgG. Total S proteins were observed under the mCherry channel. Scale bar: 30 μm. (B) The fluorescent intensities of the total S proteins (mCherry) were measured on 50 individual cells of each sample. NS, no statistically significant difference (P > 0.05). (C) Surface S/total S fluorescent intensity ratios (AF488/mCherry) were calculated based on 50 individual cells of each sample. (D) Syncytia induced by mCherry-tagged WT S proteins and their mutants. At 6 h after transfection with the plasmid DNA, Vero cells were cultured in medium containing trypsin (10 μg/ml) for an additional 6 h. Cells were fixed with methanol and total S proteins were detected by IF staining with the antiserum GP17 as described above. Nuclei were stained with DAPI. Scale bar: 50 μm. (E) Nuclei in each syncytium were counted based on 200 syncytia for each sample. Values in panels B, C, and E are shown in box-whisker plots. The boxes indicate interquartile ranges in different groups, the lines in the boxes represent median values, and the whiskers show the range of a group of values excluding the outliers, which are shown as dots. Groups with statistically significant differences (P < 0.05) are indicated with different letters; the alphabetical order reflects groups with median values from high to low.
The YxxΦ motif is an endocytosis signal and regulates surface S protein internalization to early endosomes.
To determine whether the YxxΦ motif functions as an endocytosis signal in PEDV S protein, we performed an antibody-antigen (GP17-S protein) uptake assay. We evaluated the portions of the GP17-bound surface S proteins (green) being endocytosed after incubation at 37°C. As controls, one set of cells were incubated at 4°C, whereby the cell endocytosis activities ceased. Therefore, both the GP17-bound S proteins (green) and the surface S proteins (red), which were labeled after incubation and fixation without permeabilization, were colocalized on the cell surface (Fig. 4). On the other hand, for the cells being incubated at 37°C, a large portion of the GP17-bound S proteins (green) of WT1, WT2, MK-P10, MK-P10-V, Δ5aa and Δ5aa-A formed puncta in the cells and were not colocalized with the surface S proteins (red). This was further confirmed when we compared the PCC values between the GP17-bound S protein signal and total surface S protein signal of each S protein at 4°C and 37°C (Fig. 5A). We found that the PCC values of the six S proteins (WT1, WT2, MK-P10, MK-P10-V, Δ5aa, and Δ5aa-A) at 37°C were significantly lower than those at 4°C, suggesting that partial GP17-bound S proteins of those six samples were internalized from the cell surface after incubation at 37°C. Additionally, we probed the total GP17 signals on the cell surface without permeabilization in the GP17-S uptake assay (Fig. 5B). We measured the ratios of surface S (GP17) signal to total S (mCherry) signal in the transfected cells incubated at 4°C and 37°C. WT1, WT2, and the MK-P10, MK-P10-V, Δ5aa, and Δ5aa-A mutants had significantly lower ratios at 37°C than at 4°C. In contrast, the other six mutants (Δ10aa, YA, YA-A, Δ9aa, Δ7aa, and HD) had similar PCC values (Fig. 5A) and surface/total ratios (Fig. 5B) at 4°C and 37°C. These results indicate that the S mutants without an intact YxxΦ motif were defective in endocytosis.
FIG 4.

IF staining of antibody-S protein uptake assay in Vero cells. At 24 h after transfection with the plasmid DNA, Vero cells were incubated with guinea pig anti-S1 antiserum GP17 at 4°C for 10 min. After washing with PBS three times, one set of cells was cultured at 37°C for 30 min to allow endocytosis. Another set of cells was kept at 4°C for 30 min as the control group. Cells were fixed with 4% formaldehyde without permeabilization. Surface S proteins were stained with mouse anti-S2 monoclonal antibody SD129-5 and goat anti-mouse AF647-conjugated secondary antibodies (red). Then the cells were permeabilized with Triton X-100 and stained with goat anti-guinea pig AF488-conjugated secondary antibodies (green). Nuclei were stained with DAPI (blue). Cells were randomly selected, and images were taken by using a Leica TCS SP6 confocal microscope. Scale bar: 10 μm.
FIG 5.
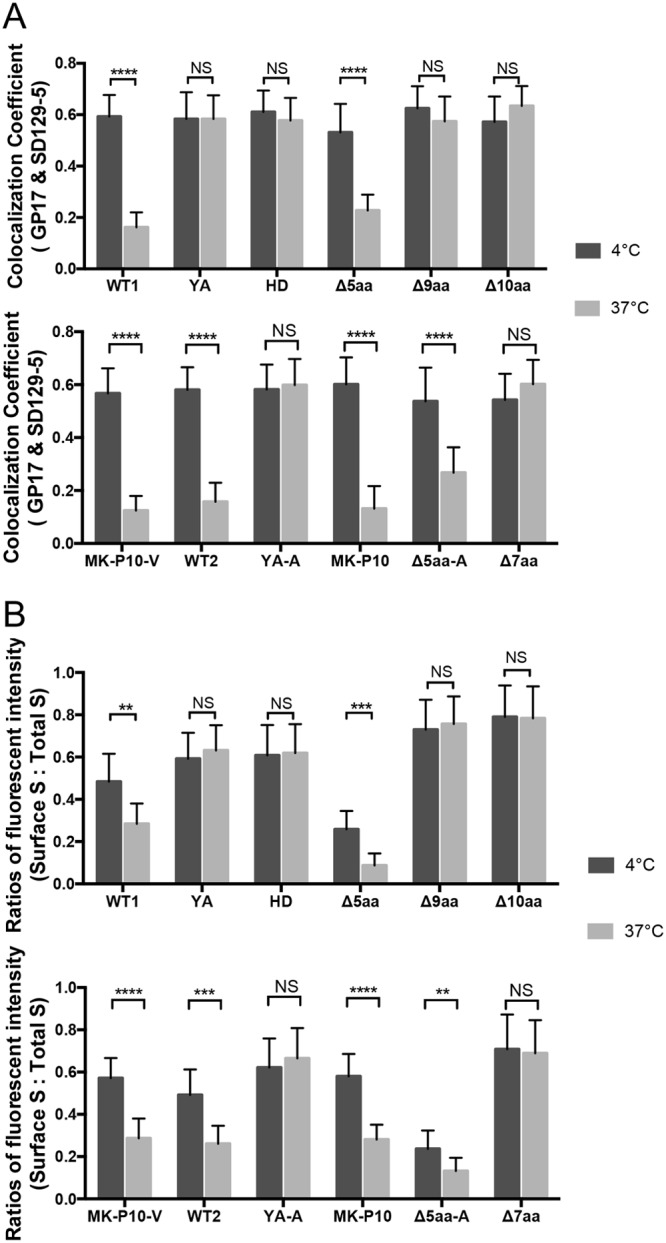
Quantification of the colocalization of Gp17-bound S proteins and surface S proteins and the ratios of surface S/total S levels in the antibody-S protein uptake assay. (A) Colocalization coefficients between the GP17-bound S proteins and surface S proteins (SD129-5) are shown in Fig. 4. PCC values of the two signals in 20 to 25 individual cells cultured at 4°C or 37°C for 30 min were plotted. (B) Quantification of GP17 signals on the cell surface in the Gp17-S uptake assay. The assay was performed as described in the legend to Fig. 4. To stain the GP17 bound on the cell surface, cells were fixed with 4% formaldehyde without permeabilization. GP17 was probed using AF488-conjugated secondary antibodies (green). The fluorescent intensities of surface (AF488) to total S (mCherry) ratios were measured in 20 to 25 individual cells. Values are plotted in a bar chart, and shown as means ± SDs. Values of the same sample cultured at 4°C and 37°C were analyzed by Student’s t test. NS, P > 0.05; **, P < 0.01; ***, P < 0.001; ****, P < 0.0001.
Endocytotic vesicles deliver cell surface proteins to early endosomes in the cytoplasm (35). To determine whether the internalized S puncta of WT1, WT2, MK-P10, MK-P10-V, Δ5aa, and Δ5aa-A (Fig. 2A and Fig. 4) were located in early endosomes, we performed the antibody-antigen (GP17-S protein) uptake assay (Fig. 6). After performing fixation and permeabilization of cells, we immunostained the GP17-bound S proteins (green) and the early endosome marker Rab5 proteins (red). The GP17-bound S protein signals in the cells incubated at 37°C showed a significantly higher percentage of colocalization with the Rab5 signal than in those at 4°C, as quantified by the Manders colocalization coefficient (MCC) method (Fig. 6). Collectively, these data suggest that an intact YxxΦ motif in the CT is necessary for endocytosis of the S protein from the cell surface to early endosome.
FIG 6.

Internalized S proteins colocalized with early endosomes. Antibody-S protein uptake assays were performed at 24 hpt for the two wild-type S proteins (WT1 and WT2) and the four mutants, Δ5aa, Δ5aa-A, MK-P10, and MK-P10-V, that formed puncta as shown in Fig. 4. Cells were incubated with guinea pig anti-S1 antiserum GP17 at 4°C for 10 min. After washing with PBS three times, one set of cells were cultured at 37°C for 30 min to allow endocytosis and another set of cells were incubated at 4°C for 30 min. After fixation with methanol, early endosome marker Rab5 proteins were stained with rabbit anti-Rab5 MAb (C8B1) followed by AF647-conjugated goat anti-rabbit antibody (red). GP17-bound S proteins were stained with goat anti-guinea pig AF488-conjugated secondary antibodies (green). (A) IF staining of internalized S protein puncta and early endosome marker Rab5. Arrows indicate the GP17-bound S protein puncta or/and early endosome marker Rab5 that colocalized together. Scale bar: 10 μm. (B) Percentage of GP17-S signals colocalized with Rab5 signals in Vero cells. The MCC values of the two signals in 20 to 25 cells in each sample were measured. Values are shown as means ± SDs. Values of the same sample cultured in 4°C or 37°C were analyzed by Student’s t test. *, P < 0.05; **, P < 0.01; ***, P < 0.001.
Virulence of the recombinant PEDV lacking both the YxxΦ and KVHVQ motifs was reduced in neonatal gnotobiotic pigs.
To investigate the function of the two motifs in PEDV replication and pathogenesis, we generated three recombinant PEDVs by introducing the Δ10aa, Δ5aa, and YA mutations into the CT of the PEDV infectious cDNA clone of strain PC22A (icPC22A) (32). We inoculated 5-day-old gnotobiotic piglets with the three mutant PEDVs, icPC22A, and phosphate-buffered saline (PBS; mock treatment) to determine the role of the two motifs in viral pathogenicity. Clinical signs and fecal viral shedding of individual piglets were examined every 12 h, and pigs were euthanized at 52 h postinoculation (hpi) to examine the intestinal histopathological changes (Table 2). No mock-inoculated piglet developed diarrhea, but all PEDV-inoculated piglets had diarrhea. Except for 50% (2/4) of the icΔ10aa-infected pigs, all PEDV-infected piglets had severe diarrhea. Piglets infected with icΔ10aa shed significantly lower titers of PEDV RNA and infectious virus in feces than pigs in the other three PEDV-inoculated groups (Table 2 and Fig. 7B and C) (P < 0.05). We detected PEDV antigens in the intestines of all the PEDV-infected, but not mock-infected, piglets (Fig. 7A). The villous atrophy in the duodenum, jejunum, and ileum was quantified by measuring villus height to crypt depth (VH/CD) ratios of each piglet (Fig. 7D to F). A lower VH/CD value indicates more severe atrophy in the intestines. Compared with the virulent icPC22A group, the lesions of icΔ10aa-infected pigs were the least severe in all three small intestinal regions (duodenum, jejunum, and ileum). Although there were no statistically significant differences in duodenum and ileum, the lesions in the jejunum of icYA-infected piglets were significantly milder than those of the icPC22A- and icΔ5aa-infected pigs. We did not observe significant differences in clinical signs, fecal viral shedding titers, or VH/CD ratios between the icΔ5aa and icPC22A groups. We concluded that the virulence of icΔ10aa was milder than that of icPC22A, and the icΔ5aa maintained virulence similar to that of icPC22A. These data suggest that deletion of both the YxxΦ and KVHVQ motifs from the S protein significantly impaired the pathogenicity of the highly virulent PEDV icPC22A.
TABLE 2.
Diarrhea and fecal shedding in pigs after PEDV inoculation (within 52 hpi)a
| Group | No. of pigs | Severe diarrhea rate (%) | Onset of diarrhea (dpi) | Peak fecal PEDV shedding titer (PFU/ml) |
|---|---|---|---|---|
| icΔ10aa | 4 | 50 B | 1.38 ± 0.48 | 1.89 ± 2.27 B |
| icYA | 4 | 100 A | 1.25 ± 0.29 | 5.47 ± 0.90 A |
| icΔ5aa | 4 | 100 A | 1.00 ± 0.00 | 6.53 ± 0.08 A |
| icPC22A | 5 | 100 A | 1.10 ± 0.22 | 6.23 ± 0.81 A |
| Mock | 2 | 0 C | ND | 0.00 ± 0.00 C |
Fecal consistency (FC) was scored as follows: 0, solid; 1, pasty; 2, semiliquid; and 3, liquid. A pig with an FC score of ≥2 was defined as having diarrhea; an FC score of 3 was considered to indicate severe diarrhea. Different letters indicate significant differences among groups (P < 0.05). dpi, days postinfection; ND, not detected.
FIG 7.

Virulence of the recombinant PEDV lacking both the YxxΦ and KVHVQ motifs was reduced in gnotobiotic piglets. (A) Immunohistochemistry staining of PEDV N proteins in the jejunum of piglets euthanized at 52 hpi. Arrows indicate PEDV antigens (brown). Magnification, ×300. (B and C) Fecal PEDV infectious titers (B) and viral RNA (N gene) titers (C) of individual recombinant PEDV-infected piglets. Rectal swab (RS) samples of individual piglets were collected every 12 h, except for three icPC22A-infected piglets that were not sampled at 36 hpi. (D to F) Mean VH/CD values of duodenum, jejunum, and ileum of individual piglets euthanized at 52 hpi after pigs had severe diarrhea and vomiting. Thirty intact villi in each intestinal section of individual piglets were measured. In the plots, the boxes indicate interquartile ranges, the lines in the boxes represent median values, and the whiskers show the range of data. Due to the small sample sizes, all the individual values are also shown in dots in the plot. Groups with statistically significant differences (P < 0.05) are indicated with different letters; the alphabetical order reflects groups with median values from high to low.
The YxxΦ and KVHVQ motifs are dispensable for PEDV replication, but the lack of either impairs viral replication efficiency in vitro.
We measured the one-step (with a multiplicity of infection [MOI] of 5) growth kinetics of the viruses in Vero cells (Fig. 8A). The three PEDV mutants had significantly lower peak titers than icPC22A at 12 hpi. Subcellular structures of the four recombinant PEDV-infected Vero cells at 12 hpi were visualized by transmission electronic microscopy (TEM) of cellular sections. Like other CoVs, replication of PEDV induces dramatic membrane rearrangements (9, 36). We did not observe differences in the rearranged membrane structures among cells infected with the four recombinant PEDVs. However, in the icPC22A-infected cells, Golgi vacuoles contained more mature virions, which are smaller particles with denser cores than immature virions (9), than those in the icΔ10aa- and icYA-infected cells (Fig. 8F and G). The icΔ5aa-infected cells contained intermediate amounts of mature virions in the vacuoles. trans-Golgi vacuoles containing large numbers of mature virions were observed exclusively in icPC22A-infected cells. This single-membrane structure contains viral particles prior to their egress. Collectively, these data suggest that neither the YxxΦ nor KVHVQ motif is essential for PEDV replication, but the absence of either motif impairs the generation of infectious PEDV viral particles.
FIG 8.

The lack of either the YxxΦ or KVHVQ motif in the CT of the S protein alters PEDV replication efficiency and syncytium formation in Vero cells. (A) One-step (MOI = 5) growth curves of the four recombinant PEDVs (icPC22A, icΔ10aa, icΔ5aa, and icYA) in Vero cells. Titers are shown as means ± SDs for each group. Statistically significantly different titers at 12 hpi (P < 0.05) are indicated by different letters. (B) Multistep (MOI = 0.001) growth curves of the four recombinant PEDVs in Vero cells. Statistically significantly different peak titers (P < 0.05) are indicated as different letters. (C) Plaques caused by the four recombinant viruses at 40 hpi in Vero cells. Cells were stained with neutral red. Arrows indicate the plaques. (D) Quantification of the diameter of plaques at different time points based on 30 plaques of each PEDV. Data are shown as mean ± SDs of each group. Statistical different titers of 40 h (P < 0.05) are indicated by different letters. (E) IF staining of surface S proteins in fixed but not permeabilized Vero cells infected with the four recombinant PEDVs at 8 hpi (MOI = 1). Scale bar: 25 μm. (F) Subcellular structures of the Vero cells infected with the recombinant PEDVs at 12 hpi. Mature virions and immature virions are indicated by filled arrows and empty arrows, respectively. Scale bar: 100 nm. (G) Quantification of mature virions in each Golgi vacuole in the Vero cells infected with the four recombinant PEDVs is shown in the box-whisker plots. The boxes indicate interquartile ranges, the lines in the boxes represent median values, and the whiskers show the range of a group of values excluding the outliers, which are shown as dots. Values in panels A, D, and G were analyzed by one-way ANOVA followed by Tukey’s comparison test. Groups with statistically significant differences (P < 0.05) are indicated by different letters, and the alphabetical order reflects groups with median values from high to low.
Recombinant PEDVs lacking an intact YxxΦ motif in the CT of the S protein formed larger syncytia than the wild-type virus.
We measured multistep growth kinetics (MOI = 0.001) of the four recombinant PEDV in Vero cells (Fig. 8B). We found that the speed of viral replication varied among the four recombinant viruses and the infectious titers gradually decreased after the majority of cells were lysed due to the formation of syncytia. In the growth curve, the peak titers of icΔ10aa and icYA occurred earlier but were lower than those of icPC22A and icΔ5aa. Replication of icΔ5aa in Vero cells showed a peak titer similar to that of icPC22A, but with a delay. We performed plaque assays and measured the kinetics of the plaque formation of the four viruses (Fig. 8C and D). At 40 hpi, the icΔ10aa virus had induced the largest plaques, followed by the icYA and then by the parental icPC22A, whereas the icΔ5aa had formed the smallest plaques. We stained the surface S proteins of infected cells at an early time point (8 hpi) (Fig. 8E). The fluorescent signals represented S proteins anchoring either on cell membrane or on the egressing virions on the surface. The S proteins of icPC22A-infected cells clustered mainly in a small area on the cell surface, presumably virions clustering at the egress sites, in contrast to the evenly distributed surface S proteins of icΔ10aa and icYA on the entire cytoplasmic membrane, presumably S proteins anchoring directly on the cell membrane. The surface S proteins of icΔ5aa-infected cells were distributed in a pattern similar to that of icPC22A but showed less intense staining. These data suggest that the YxxΦ motif decreases the amount of S proteins on the cell surface in PEDV-infected cells.
Lack of both the YxxΦ and KVHVQ motifs impairs S proteins from being incorporated into PEDV virions.
To determine whether the attenuation of icΔ10aa in vivo was due to the amount of S proteins incorporated into virions, we visualized the S proteins on the purified virion surface using TEM. The culture and purification of the four recombinant PEDVs were performed simultaneously to minimize the variations due to sample preparation. We observed virions with or without S protein projections on virions in all four samples (Fig. 9A). The virions without S projections could be those that lack enough S proteins on the surface or whose S projections were lost during sample preparation for TEM. The icΔ10aa PEDV contained the lowest percentage of virions with S protein projections, followed by icYA and then by icPC22A and icΔ5aa. Next, we quantified the number of S projections on the individual virions of each PEDV sample. Among the four mutants, the icΔ10aa PEDV contained significantly fewer S projections than icPC22A, icΔ5aa, and icYA (P < 0.05). These data suggest that the deletion of both the YxxΦ and KVHVQ motifs from the S protein impairs the incorporation of S proteins into PEDV virions.
FIG 9.

The virions of icΔ10aa PEDV with an S protein lacking the YxxΦ and KVHVQ motifs contained fewer S protein projections. (A) TEM images of purified virions of icPC22A, icΔ10aa, icΔ5aa, and icYA. Scale bar: 50 nm. (B) Percentages of virions with S protein projections on the surface in the TEM images of each recombinant PEDV. For each viral sample, 25 to 35 TEM images were evaluated; each image contained about 20 to 60 virions. (C) Quantification of S projections on the surface of individual virions. One hundred particles with S projections on the surface were randomly selected and counted from the TEM images of each recombinant PEDV. Values are shown as mean ± SDs and were analyzed by one-way ANOVA followed by Tukey’s comparison test. Groups with statistically significant differences (P < 0.05) are indicated with different letters; the alphabetical order reflects groups with median values from high to low.
Previous studies showed that the M protein retained the S protein of SARS-CoV in the Golgi regions when they were coexpressed in the same cell (15, 16). To characterize whether the S proteins of the four recombinant PEDVs can still interact with M, we cloned the PEDV M gene into the vector pUC19-sgRNA. The S and M proteins were coexpressed in Vero cells (Fig. 10A) or the S protein alone was expressed. When the S and M proteins were coexpressed in cells, we observed that they colocalized, with equal PCC values (Fig. 10B and C). We stained the surface S proteins of the cells cotransfected with the S and M plasmids or transfected with the S plasmid alone and measured the ratios of fluorescent intensities of surface S to total S. We found that the expression of M significantly decreased the surface S protein levels in the same cell (Fig. 10C), as evident by the significantly lower surface S to total S ratios in the M and S plasmid-cotransfected cells compared with those in the cells transfected with only S plasmid.
FIG 10.

IF staining of S and M proteins coexpressed in Vero cells. (A) IF staining of surface S and M proteins in the Vero cells expressing S and M simultaneously or only S proteins at 12 hpt. The total S proteins (mCherry, red), M proteins (green), and cell surface S proteins (cyan) were visualized. Scale bar: 10 μm. In the images of the WT1, Δ10aa, and YA group, S-expressing cells with or without M protein expression are included. For the Δ5aa-M group, filled arrows indicate surface S (cyan) colocalized with S (mCherry, red) and M (green) and empty arrows indicate surface S (cyan) colocalized with S (mCherry, red). (B) Colocalization coefficients (PCC) between S and M proteins in the Vero cells. Ten to 18 cells in each group were measured and analyzed by one-way ANOVA and Tukey’s test. (C) Two sets of Vero cells were transfected with the individual S plasmid alone or cotransfected with the S and M plasmids. Surface S/total S fluorescent intensity ratios (AF647:mCherry) were calculated based on 10 to 20 individual cells for the cells coexpressing S and M or transfected with S alone. Values in panel B are shown in a box-whisker plot and were analyzed by one-way ANOVA followed by Tukey’s comparison test. In panel C, values in the group coexpressing S and M and the S-only group in each plasmid DNA are shown as means ± SDs and were analyzed by Student’s t test. *, P < 0.05; **, P < 0.01; ***, P < 0.0001.
DISCUSSION
In this study, we determined that the YxxΦ and KVHVQ motifs at the CT of PEDV S proteins are dispensable for PEDV replication. However, the deletion of both motifs reduced the viral virulence in vivo and the incorporation of S proteins into virus particles in vitro. The YxxΦ motif and the KVHVQ motif function as an endocytosis signal and an ER retrieval signal, respectively.
YxxΦ and KVHVQ together regulate surface S protein levels and S protein-induced syncytium formation.
The number of nuclei in a PEDV S protein-induced syncytium, or the size of a syncytium, correlates with the amount of S proteins on the cell surface (6). Collectively, our data support the hypothesis that both motifs are involved in the regulation of PEDV S proteins on the cell surface: the KVHVQ motif retains the S proteins in the ERGIC, limiting its transport to the cell surface, whereas the YxxΦ motif decreases the amount of surface S proteins via endocytosis. The mutants Δ10aa, Δ9aa, Δ7aa, and HD, which lack the complete KVHVQ motif and complete/partial YxxΦ motif, had the highest level of surface S proteins (Fig. 3A and C), probably due to the lack of both ER retrieval and endocytosis. The mutants YA, YA-A, MK-P10, and MK-P10-V had the second highest level of cell surface S proteins. For the YA and YA-A, this is probably due to the inactivation of the endocytosis signal, while their ERRS remained intact. For MK-P10 and MK-P10-V, it may be due to the impaired ERRS (KVRVQ; R is the mutation that leads to the impaired ERRS) while their YxxΦ motif was intact. Surprisingly, the mutants Δ5aa and Δ5aa-A had significantly lower levels of surface S proteins than WT1 and WT2. The lack of the entire KVHVQ motif resulted in significantly lower levels of ERGIC colocalization of Δ5aa and Δ5aa-A than of WT1 and WT2 (Fig. 2), confirming that the KVHVQ motif functions as an ERRS in PEDV as described previously (6, 16). Why, then, did we not observe an increased level of surface S proteins for these two mutants? We hypothesized that the loss of the entire KVHVQ motif in the CT of the S protein altered the intracellular sorting of S proteins. One possibility could be that the potency of their YxxΦ motifs, as the endocytosis signal, was dramatically enhanced due to the lack of the entire ERRS motif. A similar endocytosis enhancement effect was reported for the YxxΦ motif of TGEV when its KxHxx motif’s conformation was changed due to the K-to-M mutation (26). Another possibility could be that the deletion of the entire KVHVQ motif may cause other deficiencies in S protein sorting, such as impaired export from the ER or altered transportation to other organelles. Detailed mechanistic studies regarding the sorting of Δ5aa and Δ5aa-A S proteins are necessary to answer this question.
The endocytosis role of the YxxΦ motif in PEDV S intracellular sorting.
The conserved location of the YxxΦ and KxHxx/KKxx motifs in the CT implies that the S protein sorting mechanisms may be similar among different CoVs (Fig. 1A). However, previous studies on the YxxΦ motif of TGEV and IBV S proteins did not provide consistent conclusions (11, 13, 14, 26). One reason could be that the expression efficiencies of vectors varied in those studies. Due to the small amount of S proteins expressed on the cell surface, the endocytosed S proteins might be too subtle to be detected in the antibody-antigen uptake assay. In our study, the plasmid pUC19-sgRNA overexpressed PEDV S proteins in Vero cells compared to some commercially available vectors (data not shown), probably due to the inclusion of the 5′leader sequence of subgenomic RNA (sgRNA) and PEDV 3′untranslated region (UTR) that enhanced the translation. Although we determined that both YEVF and YEAF are endocytosis signals of PEDV S proteins, it is possible that their efficiencies may vary. In the future, more advanced quantitative approaches, such as mechanically induced trapping of molecular interactions (MITOMI) (19), could be used to determine their affinities for binding to cellular factors. Additionally, one limitation of this study is that we did not applied approaches to monitor the kinetic trafficking of the endocytosis of S proteins from the cell surface. Future studies to address these points are necessary.
In this study, we did not detect the colocalization of endocytosed S protein puncta and lysosomal marker LAMP1 in WT1-, WT2-, Δ5aa-, Δ5aa-A, MK-P10- and MK-P10-V-pUC19-sgRNA transfected cells (data not shown). Also, the total S protein levels (mCherry signals) of those mutants did not decrease during up to 2 days’ culture. We hypothesize that the internalized PEDV S proteins are transported back to the virion assembly sites rather than being degraded in the lysosome. For PEDV, this endocytosis may be a strategy to efficiently use the expressed S proteins for the generation of infectious viral particles. This hypothesis may be supported by the quantitative data on S proteins incorporated into virions (Fig. 9), because the icΔ5aa PEDV with an intact YxxΦ motif had a number of S projections similar to that of icPC22A. This endocytosis signal YxxΦ motif may also help PEDV evade host immune responses by constantly decreasing the amounts of viral S proteins on the cell surface. Previous studies reported that inactivation of the YxxΦ motif in the envelope proteins of simian immunodeficiency virus (SIV) and human immunodeficiency virus (HIV) attenuated the corresponding virus and enhanced the T cell responses in vivo (37, 38). Moreover, host antibodies that have already bound to cell surface S proteins would be endocytosed into the cytoplasm, to evade antibody-dependent cell lysis (39, 40). Another possible function of this YxxΦ motif in PEDV S protein is that it could downregulate the levels of viral receptors on the cell surface, which may be involved in superinfection exclusion.
The role of the YxxΦ and KVHVQ motifs in PEDV pathogenicity.
In the gnotobiotic piglet study, we observed that the virulence of icΔ10aa was significantly reduced compared with that of the parental virus, icPC22A. In contrast, no statistically significant differences were observed in the virulence between icPC22A and the icΔ5aa mutant, which lacks the KVHVQ motif. Mutant icYA caused significantly milder villous atrophy in the jejunum than icPC22A. Although not significant, it caused a delayed onset of diarrhea and lower peak fecal shedding titers than did icPC22A. Therefore, icYA PEDV with an inactivated YxxΦ motif was slightly attenuated.
We investigated why the deletion of both motifs from the S protein (icΔ10aa), but not the deletion of ERRS alone (icΔ5aa), significantly attenuates a virulent PEDV. TEM images showed that icΔ5aa-infected Vero cells contained significantly higher numbers of mature virions in the Golgi vacuoles than those infected with icΔ10aa (Fig. 8F and G). Particularly, icΔ10aa had a significantly lower percentage of purified virions with S projections on the surface and lower numbers of S projections on individual virions with surface S projections than the other three viruses (Fig. 9). Therefore, icΔ10aa may generate the highest level of defective virions (without enough S protein projections on the viral surface) among the four PEDVs, causing attenuation in vivo. The difference in S incorporation into viral particles among the PEDV mutants may be due to three reasons. First, the lack of both sorting signals renders more icΔ10aa S proteins to be transported onto the cell surface, decreasing its level in the virus assembly site, ERGIC. Second, the intense and rapid cell-cell fusion induced by surface S proteins in the infected cells causes significant intracellular membrane rearrangements (41), which may interfere with the icΔ10aa budding and egress process. In contrast, icΔ5aa does not cause significant syncytium formation. The third reason may be the altered interaction between S and M proteins in the virion assembly site. Although some previous studies revealed that mutation of the ERRS (KLHYT) of SARS-CoV S protein altered the S-M interaction and S incorporation into virions (15, 16), another study suggested that inactivation of this motif in the S of IBV did not affect the S-M interaction (12). For PEDV, a previous study of MK-P10 also showed that the impaired KVRVQ motif did not alter the S incorporation (6), which is similar to our observation for icΔ5aa (Fig. 9). In our S and M coexpression assay, we found that the four S proteins colocalized with the M proteins in the cytoplasm at the same level, and the coexpression of M protein significantly decreased the transportation of the four S proteins onto the cell surface, implying that those four S mutants may still interact properly with M proteins, although more experiments to evaluate S-M physical interactions are needed. Our current data support the first and second possibilities.
Another reason for the attenuation of icΔ10aa PEDV in pigs is that mutation of PEDV YxxΦ may also interfere with the synthesis of ORF3 sgRNA, since the predicted TRS of open reading frame 3 (ORF3) sgRNA overlaps with the nucleotide sequences encoding the tyrosine of the YxxΦ motif (42). It was reported that a recombinant IBV bearing mutations in its dilysine motif (KKxx) expressed less E protein, due to the decrease of sgRNA 3 synthesis (12). In this study, the sgRNA 3 levels in the icΔ10aa- and icYA-infected cells were about 3 log10 and 2 log10 lower than that in the icPC22A-infected cells, as determined by sgRNA 3-specific TaqMan real-time reverse transcription-qPCR (RT-qPCR) (data not shown). sgRNA 3 expresses the accessory protein ORF3. We do not know whether the E gene in the sgRNA 3 can be translated during PEDV infection. Therefore, it is highly possible that the ORF3 protein level was decreased in the icΔ10aa- and icYA-infected cells. However, due to the lack of effective antibodies against PEDV ORF3 and E proteins, we could not confirm these results at the protein level. The decrease of ORF3 expression may also contribute to the significant attenuation of icΔ10aa and the slight attenuation of icYA in piglets because we determined previously that a PEDV lacking an intact ORF3 gene is partially attenuated in piglets (43).
The role of S CT truncation in Vero cell-adapted PEDVs and PEDV vaccine development.
In our study, the deletion of both the YxxΦ and KVHVQ motifs from the S protein could not completely attenuate a highly virulent PEDV strain in piglets, as icΔ10aa still caused moderate diarrhea in all the piglets (n = 4). Therefore, the ablation of the two motifs was probably not the only determinant of the reduced virulence for those attenuated/mild PEDV variants (FL2013, SM-98, CHM2013, PC22A-P120, and KNU-141112). The attenuation of these strains must be the combined consequence of all the mutations in their genomes. We investigated why some Vero cell-adapted PEDV variants (PC22A-P120, SM-98, and KNU-141112) lost function of the YxxΦ and KVHVQ motifs during continuous passaging. We found that the corresponding mCherry-tagged S proteins (Δ9aa, Δ7aa, and HD) caused larger syncytia than the wild-type S proteins. The loss of the two motifs may facilitate the rapid spread of those PEDV variants between cells through enhanced syncytium formation. This idea was supported by a study of the mutant AVCT12. Jengarn et al. (29) demonstrated that recombinant AVCT12 was rescued in Vero cells only if the infectious cDNA clone contained the Δ7aa mutation in the S CT. We conclude that inactivation of both the YxxΦ and KVHVQ motifs of the S protein could be applied in the rational design of a PEDV vaccine since it results in more S proteins being transported onto cell surface in the infected enterocytes, facilitating antigenic recognition by the host immune system, and may not decrease protective immunogenicity because no neutralizing epitope has been identified in the S CT of PEDV. We aim to test this hypothesis in future studies. To achieve complete attenuation and to increase the safety of an attenuated vaccine, the inactivation of the two motifs should be combined with mutations in other key genes in the PEDV genome.
In conclusion, we showed that the YxxΦ and KVHVQ motifs in the CT of PEDV S protein regulate the surface S protein level. The deletion of both motifs significantly reduced the virulence of PEDV in pigs. Our discovery can aid in the rational design of attenuated vaccines for PEDV and other CoVs containing similar motifs in their S proteins.
MATERIALS AND METHODS
Cells, reagents, and antibodies.
Vero cells (ATCC CCL81) were cultured in Dulbecco modified Eagle medium (DMEM; Gibco, Carlsbad, CA) supplemented with 5% fetal bovine serum (FBS) (Atlanta Biologicals, Flowery Branch, GA). The guinea pig polyclonal antibody (pAb) GP17 against PEDV S1 was generated in our laboratory as described below. PEDV S1 subunit (aa 1 to 421) gene of Vero cell-adapted PEDV PC177 strain at passage level 2 (GenBank accession no. KM392229) was cloned into pFUSE-hIgG1-Fc2 vector (InvivoGen, San Diego, CA), expressed in HEK-293T cells, and purified using a protein A affinity column (Pierce, Waltham, MA). Guinea pigs were first immunized with the purified S1 subunit mixed with Freund’s complete adjuvant via subcutaneous injection, followed by two booster injections of the same dose in Freund’s incomplete adjuvant with a 2- to 3-week interval between doses. The total IgG antibodies in the hyperimmune serum were purified. The production of guinea pig serum was approved by the Institutional Animal Care and Use Committee (IACUC) of the Ohio State University. Mouse monoclonal antibodies (MAbs) SD129-5 against PEDV S2 (residues 747 to 774) (44) and SD17-103 against PEDV N proteins were kindly provided by Diego Diel and Eric Nelson at South Dakota State University, respectively. Rabbit hyperimmune serum against PEDV M proteins was kindly provided by Ying Fang at Kansas State University. Mouse MAb against the ERGIC-53 (OTI1A8) was purchased from Enzo Life Science (Farmingdale, NY). Rabbit MAb against Rab5 (C8B1) were purchased from Cell Signaling Technology (Danvers, MA). Alexa Fluor 488 (AF488)- or AF647-conjugated secondary goat antibodies against the IgG antibodies of different species were all purchased from Life Technologies (Gibco, Carlsbad, CA).
Construction of plasmids encoding mCherry-tagged S or M proteins.
We constructed an expression vector pUC19-sgRNA by inserting sequences of cytomegalovirus (CMV) promoter, 5′leader sequence (nucleotides [nt] 1 to 75) of S sgRNA (sgRNA 2), PEDV 3′UTR, 25-nt (poly)A tail, hepatitis D virus (HDV) ribozyme, and bovine growth hormone (BGH) terminator into plasmid pUC19 (Fig. 1B). Some inserted elements have been applied in CoV infectious cDNA clones (45). The full-length S gene was amplified from the cDNA of icPC22A (GenBank accession number KY499262). The N-terminal 197-aa region in domain 0 of the S1 subunit, which is dispensable for PEDV replication (32), was replaced with an mCherry gene and cloned into pUC19-sgRNA. This construct (WT1) was subsequently cloned into the expression vector pUC19-sgRNA and designated pUC19-sgRNA-S-WT1. Other S mutants were generated by mutating the CT of the WT1 constructs using an NEbuilder DNA assembly kit (New England BioLabs [NEB], Ipswich, MA). Additionally, the full-length M gene of icPC22A was also cloned into the pUC19-sgRNA vector. Monolayers of Vero cells were transfected with the plasmid DNA (500 ng/5 × 105 cells) using Lipofectamine 3000 reagent (Invitrogen, Carlsbad, CA).
IF staining.
Use of 100% methanol fixes and permeabilizes the cells simultaneously, whereas use of 4% formaldehyde can fix the cells without permeabilization. To determine the colocalization between S proteins and the ERGIC marker at 12 hpt (Fig. 2A), the transfected cells were fixed with 100% methanol for 15 min. ERGIC-53 was stained with mouse monoclonal antibody OTI1A8 (Enzo Life Science, Farmingdale, NY) followed by the secondary antibody AF488-conjugated goat anti-mouse IgG serum (Invitrogen, Carlsbad, CA). In Fig. 3A and 8E, the transfected cells (12 hpt) or PEDV-infected cells (8 hpi) were fixed with 4% formaldehyde for 15 min. The S protein on the cell surface was stained with guinea pig anti-PEDV S1 GP17 followed by the secondary antibody AF488-conjugated goat anti-guinea pig IgG serum (Invitrogen). For Fig. 10A, Vero cells were transfected with equal molar ratios of plasmids encoding the S and M proteins. At 12 hpt, the cells were fixed with 4% formaldehyde for 15 min. Cell surface S proteins were stained with mouse monoclonal antibody SD129-5 followed by secondary antibody AF647-conjugated goat anti-mouse IgG serum (Invitrogen). Then the cells were permeabilized with 0.5% Triton X-100 for 20 min, and the intracellular M proteins were stained with the rabbit hyperimmune anti-M serum followed by secondary antibody AF488-conjugated goat anti-rabbit IgG serum (Invitrogen). Immunofluorescence (IF) images in Fig. 3A and D were captured with an IX-70 fluorescence microscope (Olympus, Tokyo, Japan); images in Fig. 2A, 4, 6A, 8E, and 10A were captured with a TCS SP6 confocal microscope (Leica, Wetzlar, Germany).
Syncytium induction assay.
Vero cells in 6-well plates were transfected with the 12 plasmids for S proteins and cultured at 37°C for 6 h. After removal of the medium and washing three times, serum-free medium containing 10 μg/ml of trypsin was added to each well. Cells were cultured for an additional 6 h and fixed with 100% methanol. Total cellular S proteins were stained with guinea pig anti-S1 hyperimmune serum GP17 followed by AF488-conjugated antibody. After staining of nuclei with 4′,6-diamidino-2-phenylindole (DAPI), IF images of the syncytia were captured with an Olympus IX-70 (Tokyo, Japan) fluorescence microscope. The nuclei in each syncytium were counted.
Antibody-antigen uptake assay.
At 24 hpt, Vero cells were incubated with guinea pig pAb GP17 at 4°C for 10 min. After complete removal of the antibody, cells were cultured at 4°C or 37°C for an additional 30 min and fixed with buffered 4% formaldehyde (Fisher Scientific, Waltham, MA). To visualize the endocytosed GP17-S (Fig. 4), the total surface S proteins were stained by mouse MAb SD129-5 and AF647-conjugated anti-mouse secondary antibody. After permeabilization of the cells with 1% Triton X-100, the surface and endocytosed GP17-S was stained with AF488-conjugated anti-guinea pig secondary antibody. To quantify the GP17-S bound to the cell surface (Fig. 5B), cells that had GP17-S uptake were fixed with 4% formaldehyde without permeabilization. Then the cells were incubated with secondary antibody AF488-conjugated goat anti-guinea pig IgG serum (Invitrogen, Carlsbad, CA). The images were captured with an IX-70 fluorescence microscope (Olympus, Tokyo, Japan). To colocalize the S puncta with early endosome marker protein Rab5 (Fig. 6A), the cells showing GP17-S uptake were fixed with cold 100% methanol. The Rab5 was stained with rabbit MAb (C8B1), followed by AF647-conjugated anti-rabbit IgG antibody. Stained cells were analyzed by using a Leica TCS SP6 confocal microscope.
Quantitative analysis of fluorescent images.
The fluorescent intensity of individual cells was measured by ImageJ software (https://imagej.nih.gov/ij/). The channel of a specific fluorescent signal was separated from the composite fluorescent images. In the channel, the areas of individual cells were selected. The total intensity of a single cell in this channel was determined by multiplying the cell area by the mean gray value of this area and subtracting the background value (the area multiplied by mean gray value of the background). The colocalization analysis was performed using the Coloc2 plugin of ImageJ software. To determine the coefficient of two fluorescent signals colocalized with each other, the Pearson’s correlation coefficient (PCC) values of individual cells were measured (33, 34). Higher PCC values indicate higher levels of colocalization between the two fluorescent signals (Fig. 2B, 5A, and 10B). To determine the percentage of the endocytosed GP17 signals colocalized with the Rab5 signals in Vero cells (Fig. 6B), the Manders colocalization coefficients (MCC) of individual cells were measured (34, 46).
Generation of recombinant PEDVs.
The recovery of infectious clone-derived PEDVs was described previously (32). Briefly, the genomic cDNA fragments were purified and ligated into full-length cDNA. The genomic RNAs (gRNAs) were transcribed using an mMessage mMachine T7 transcription kit (Ambion, Austin, TX). Vero cells were electroporated with the mixture of gRNAs and N gene transcripts and cultured in medium containing trypsin. The recovered viruses were plaque purified and verified by Sanger sequencing.
Pathogenesis studies of PEDV in gnotobiotic piglets.
Five groups of 5-day-old gnotobiotic piglets were delivered and housed in different isolators as described previously (47). Piglets in different groups were randomly selected and orally inoculated with 100 PFU/pig of icPC22A (n = 5), icΔ10aa (n = 4), icΔ5aa (n = 4), icYA (n = 4), or PBS (mock treatment; n = 3). Postinoculation, we observed clinical signs and collected rectal swabs every 12 h. All the piglets were euthanized at 52 hpi to evaluate histopathological lesions at the acute phase of infection. TaqMan RT-qPCR for the detection of fecal PEDV N RNA, plaque assay for the detection of fecal infectious PEDV titers, and immunohistochemistry staining of PEDV antigens using mouse MAb against PEDV N protein (SD17-103) were performed as described previously (48, 49). This animal study was approved by the IACUC of the Ohio State University.
Growth curves of infectious PEDVs.
The growth curves of PEDV replication in Vero cells were determined by inoculation of monolayers of cells with each of the four recombinant PEDVs with an MOI of 0.001 or 5. After 1 h absorption, the inocula were removed and the cell monolayers were washed with PBS three times. Maintenance medium containing 10 μg/ml of trypsin was added to the cell culture. The total viruses (intracellular and extracellular) in each sample were collected by freezing and thawing the culture at appropriate time points. The infectious titers of viral samples were titrated by plaque assays.
Plaque assays.
Plaque assays were performed as described previously (50). Briefly, monolayers of Vero cells were inoculated with appropriate dilutions of recombinant PEDVs for 1 h. Then the inocula were removed and the cells were washed with PBS three times. The cells were overlaid with an agarose-MEM (Gibco, Carlsbad, CA) mixture containing 10 μg/ml of trypsin. The diameters of individual plaques were measured by using an IX-70 fluorescence microscope (Olympus, Tokyo, Japan) and its software.
TEM.
Transmission electron microscopy (TEM) of PEDV-infected cell sections was performed as described previously (50). To visualize the subcellular structure in TEM, recombinant PEDV-infected Vero cells (MOI = 5) were cultured in trypsin-free medium for 12 h and fixed with fixative (3% glutaraldehyde, 1% paraformaldehyde in 0.1 M potassium phosphate buffer [pH 7.2]) for 4 h. Samples were embedded in agarose, dehydrated, and re-embedded in EM Bed812 resin (Electron Microscopy Science, Hartfield, PA). Ultrathin sections of each sample were prepared and stained. To visualize S protein projections on the virions, Vero cells were inoculated with the recombinant PEDVs (MOI = 2) in the presence of trypsin. Without freezing and thawing, virions in 500-ml culture supernatants of each recombinant PEDV were purified by using PEG-8000 (Sigma-Aldrich, St. Louis, MO) precipitation, followed by 30% sucrose-cushion ultracentrifugation (10,000 × g for 2 h), according to a previous protocol (51). To maintain consistency, the four PEDVs were cultured and prepared simultaneously. Samples of subcellular section and purified virions were stained with 2% uranyl acetate prior to TEM imaging. Images were visualized using an H-7500 TEM (Hitachi, Japan).
Statistical analysis.
The statistical analyses were performed using GraphPad Prism 6.0. The data in Fig. 2B, 3B to E, 7D to F, 8G, and 10B are shown in box-whisker plots. The outliers were the values 3/2 greater than the upper quartile or 3/2 smaller than the lower quartile (52). Comparisons of means of groups in these figures and Fig. 8A, 8D, 9B, and 9C were analyzed by one-way analysis of variance (ANOVA) followed by Tukey’s multiple-comparison test. In the Fig. 5A, 5B, 6B, and 10C, the two groups were analyzed by Student’s t test. A P value between each two groups less than 0.05 was considered significantly different.
ACKNOWLEDGMENTS
This study was funded by the National Institute of Food and Agriculture, U.S. Department of Agriculture, under award number 2015-67015-23067 (Q.W., principal investigator [PI]; L.J.S., co-PI).
We thank Andrea Kaszas and Xiaohong Wang for technical assistance and Juliette Hanson, Ronna Wood, Megan Strother, Dennis Hartzler, Sara Tallmadge, and Jeff Ogg for animal care assistance. We thank Chang-Won Lee and Scott Kenney for their critical reviews of the manuscript. We are grateful to Diego Diel and Eric Nelson at South Dakota State University for providing us the mouse MAbs against PEDV S and N proteins and to Ying Fang at Kansas State University for providing us the rabbit pAb against PEDV M proteins.
REFERENCES
- 1.Wang D, Fang L, Xiao S. 2016. Porcine epidemic diarrhea in China. Virus Res 226:7–13. doi: 10.1016/j.virusres.2016.05.026. [DOI] [PMC free article] [PubMed] [Google Scholar]
- 2.Paarlberg PL. 2014. Updated estimated economic welfare impacts of porcine epidemic diarrhea virus (PEDV). http://ageconsearch.umn.edu/bitstream/174517/2/14-4.Updated%20Estimated%20Economic%20Welfare%20Impacts%20of%20PEDV.pdf.
- 3.Schulz LL, Tonsor GT. 2015. Assessment of the economic impacts of porcine epidemic diarrhea virus in the United States. J Anim Sci 93:5111–5118. doi: 10.2527/jas.2015-9136. [DOI] [PMC free article] [PubMed] [Google Scholar]
- 4.Stevenson GW, Hoang H, Schwartz KJ, Burrough ER, Sun D, Madson D, Cooper VL, Pillatzki A, Gauger P, Schmitt BJ, Koster LG, Killian ML, Yoon KJ. 2013. Emergence of porcine epidemic diarrhea virus in the United States: clinical signs, lesions, and viral genomic sequences. J Vet Diagn Invest 25:649–654. doi: 10.1177/1040638713501675. [DOI] [PubMed] [Google Scholar]
- 5.Wicht O, Li W, Willems L, Meuleman TJ, Wubbolts RW, van Kuppeveld FJM, Rottier PJM, Bosch BJ. 2014. Proteolytic activation of the porcine epidemic diarrhea coronavirus spike fusion protein by trypsin in cell culture. J Virol 88:7952–7961. doi: 10.1128/JVI.00297-14. [DOI] [PMC free article] [PubMed] [Google Scholar]
- 6.Shirato K, Maejima M, Matsuyama S, Ujike M, Miyazaki A, Takeyama N, Ikeda H, Taguchi F. 2011. Mutation in the cytoplasmic retrieval signal of porcine epidemic diarrhea virus spike (S) protein is responsible for enhanced fusion activity. Virus Res 161:188–193. doi: 10.1016/j.virusres.2011.07.019. [DOI] [PMC free article] [PubMed] [Google Scholar]
- 7.Klumperman J, Locker JK, Meijer A, Horzinek MC, Geuze HJ, Rottier PJM. 1994. Coronavirus M proteins accumulate in the Golgi complex beyond the site of virion budding. J Virol 68:6523–6534. [DOI] [PMC free article] [PubMed] [Google Scholar]
- 8.Hogue BG, Machamer CE. 2008. Coronavirus structural proteins and virus assembly, p 179–200. In Stanley P, Gallagher T, Snijder EJ (ed), Nidoviruses. ASM Press, Washington, DC. [Google Scholar]
- 9.Zhou X, Cong Y, Veenendaal T, Klumperman J, Shi D, Mari M, Reggiori F. 2017. Ultrastructural characterization of membrane rearrangements induced by porcine epidemic diarrhea virus infection. Viruses 9:251. doi: 10.3390/v9090251. [DOI] [PMC free article] [PubMed] [Google Scholar]
- 10.Ujike M, Taguchi F. 2015. Incorporation of spike and membrane glycoproteins into coronavirus virions. Viruses 7:1700–1725. doi: 10.3390/v7041700. [DOI] [PMC free article] [PubMed] [Google Scholar]
- 11.Winter C, Schwegmann-Wessels C, Neumann U, Herrler G. 2008. The spike protein of infectious bronchitis virus is retained intracellularly by a tyrosine motif. J Virol 82:2765–2771. doi: 10.1128/JVI.02064-07. [DOI] [PMC free article] [PubMed] [Google Scholar]
- 12.Youn S, Collisson EW, Machamer CE. 2005. Contribution of trafficking signals in the cytoplasmic tail of the infectious bronchitis virus spike protein to virus infection. J Virol 79:13209–13217. doi: 10.1128/JVI.79.21.13209-13217.2005. [DOI] [PMC free article] [PubMed] [Google Scholar]
- 13.Schwegmann-Wessels C, Al-Falah M, Escors D, Wang Z, Zimmer G, Deng H, Enjuanes L, Naim HY, Herrler G. 2004. A novel sorting signal for intracellular localization is present in the S protein of a porcine coronavirus but absent from severe acute respiratory syndrome-associated coronavirus. J Biol Chem 279:43661–43666. doi: 10.1074/jbc.M407233200. [DOI] [PMC free article] [PubMed] [Google Scholar]
- 14.Lontok E, Corse E, Machamer CE. 2004. Intracellular targeting signals contribute to localization of coronavirus spike proteins near the virus assembly site. J Virol 78:5913–5922. doi: 10.1128/JVI.78.11.5913-5922.2004. [DOI] [PMC free article] [PubMed] [Google Scholar]
- 15.Ujike M, Huang C, Shirato K, Makino S, Taguchi F. 2016. The contribution of the cytoplasmic retrieval signal of severe acute respiratory syndrome coronavirus to intracellular accumulation of S proteins and incorporation of S protein into virus-like particles. J Gen Virol 97:1853–1864. doi: 10.1099/jgv.0.000494. [DOI] [PMC free article] [PubMed] [Google Scholar]
- 16.McBride CE, Li J, Machamer CE. 2007. The cytoplasmic tail of the severe acute respiratory syndrome coronavirus spike protein contains a novel endoplasmic reticulum retrieval signal that binds COPI and promotes interaction with membrane protein. J Virol 81:2418–2428. doi: 10.1128/JVI.02146-06. [DOI] [PMC free article] [PubMed] [Google Scholar]
- 17.Jackson LP, Lewis M, Kent HM, Edeling MA, Evans PR, Duden R, Owen DJ. 2012. Molecular basis for recognition of dilysine trafficking motifs by COPI. Dev Cell 23:1255–1262. doi: 10.1016/j.devcel.2012.10.017. [DOI] [PMC free article] [PubMed] [Google Scholar]
- 18.Sato T, Takeyama N, Katsumata A, Tuchiya K, Kodama T, Kusanagi K. 2011. Mutations in the spike gene of porcine epidemic diarrhea virus associated with growth adaptation in vitro and attenuation of virulence in vivo. Virus Genes 43:72–78. doi: 10.1007/s11262-011-0617-5. [DOI] [PMC free article] [PubMed] [Google Scholar]
- 19.Neveu G, Barouch-Bentov R, Ziv-Av A, Gerber D, Jacob Y, Einav S. 2012. Identification and targeting of an interaction between a tyrosine motif within hepatitis C virus core protein and AP2M1 essential for viral assembly. PLoS Pathog 8:e1002845. doi: 10.1371/journal.ppat.1002845. [DOI] [PMC free article] [PubMed] [Google Scholar]
- 20.Collins BM, McCoy AJ, Kent HM, Evans PR, Owen DJ. 2002. Molecular architecture and functional model of the endocytic AP2 complex. Cell 109:523–535. doi: 10.1016/S0092-8674(02)00735-3. [DOI] [PubMed] [Google Scholar]
- 21.Kelly BT, McCoy AJ, Späte K, Miller SE, Evans PR, Höning S, Owen DJ. 2008. A structural explanation for the binding of endocytic dileucine motifs by the AP2 complex. Nature 456:976–979. doi: 10.1038/nature07422. [DOI] [PMC free article] [PubMed] [Google Scholar]
- 22.Oliver SL, Brady JJ, Sommer MH, Reichelt M, Sung P, Blau HM, Arvin AM. 2013. An immunoreceptor tyrosine-based inhibition motif in varicella-zoster virus glycoprotein B regulates cell fusion and skin pathogenesis. Proc Natl Acad Sci U S A 110:1911–1916. doi: 10.1073/pnas.1216985110. [DOI] [PMC free article] [PubMed] [Google Scholar]
- 23.Heineman TC, Hall SL. 2001. VZV gB endocytosis and Golgi localization are mediated by YXXφ motifs in its cytoplasmic domain. Virology 285:42–49. doi: 10.1006/viro.2001.0930. [DOI] [PubMed] [Google Scholar]
- 24.West JT, Weldon SK, Wyss S, Lin X, Yu Q, Thali M, Hunter E. 2002. Mutation of the dominant endocytosis motif in human immunodeficiency virus type 1 gp41 can complement matrix mutations without increasing Env incorporation. J Virol 76:3338–3349. doi: 10.1128/JVI.76.7.3338-3349.2002. [DOI] [PMC free article] [PubMed] [Google Scholar]
- 25.Vogt C, Eickmann M, Diederich S, Moll M, Maisner A. 2005. Endocytosis of the Nipah virus glycoproteins. J Virol 79:3865–3872. doi: 10.1128/JVI.79.6.3865-3872.2005. [DOI] [PMC free article] [PubMed] [Google Scholar]
- 26.Paul A, Trincone A, Siewert S, Herrler G, Schwegmann-Weßels C. 2014. A lysine-methionine exchange in a coronavirus surface protein transforms a retention motif into an endocytosis signal. Biol Chem 395:657–665. doi: 10.1515/hsz-2013-0282. [DOI] [PubMed] [Google Scholar]
- 27.Lin C-M, Hou Y, Marthaler DG, Gao X, Liu X, Zheng L, Saif L, Wang Q. 2017. Attenuation of an original US porcine epidemic diarrhea virus strain PC22A via serial cell culture passage. Vet Microbiol 201:62–71. doi: 10.1016/j.vetmic.2017.01.015. [DOI] [PMC free article] [PubMed] [Google Scholar]
- 28.Zhang X, Pan Y, Wang D, Tian X, Song Y, Cao Y. 2015. Identification and pathogenicity of a variant porcine epidemic diarrhea virus field strain with reduced virulence. Virol J 12:88. doi: 10.1186/s12985-015-0314-4. [DOI] [PMC free article] [PubMed] [Google Scholar]
- 29.Jengarn J, Wongthida P, Wanasen N, Frantz PN, Wanitchang A, Jongkaewwattana A. 2015. Genetic manipulation of porcine epidemic diarrhoea virus recovered from a full-length infectious cDNA clone. J Gen Virol 96:2206–2218. doi: 10.1099/vir.0.000184. [DOI] [PubMed] [Google Scholar]
- 30.Li J, Jin Z, Gao Y, Zhou L, Ge X, Guo X, Han J, Yang H. 2017. Development of the full-length cDNA clones of two porcine epidemic diarrhea disease virus isolates with different virulence. PLoS One 12:e0173998. doi: 10.1371/journal.pone.0173998. [DOI] [PMC free article] [PubMed] [Google Scholar]
- 31.Lee S, Son K-YY, Noh Y-HH, Lee S-CC, Choi H-WW, Yoon I-JJ, Lee C. 2017. Genetic characteristics, pathogenicity, and immunogenicity associated with cell adaptation of a virulent genotype 2b porcine epidemic diarrhea virus. Vet Microbiol 207:248–258. doi: 10.1016/j.vetmic.2017.06.019. [DOI] [PMC free article] [PubMed] [Google Scholar]
- 32.Hou Y, Lin CM, Yokoyama M, Yount BL, Marthaler D, Douglas AL, Ghimire S, Qin Y, Baric RS, Saif LJ, Wang Q. 2017. Deletion of a 197-amino-acid region in the N-terminal domain of spike protein attenuates porcine epidemic diarrhea virus in piglets. J Virol 91:e00227-17. doi: 10.1128/JVI.00227-17. [DOI] [PMC free article] [PubMed] [Google Scholar]
- 33.Manders EMM, Stap J, Brakenhoff GJ, Driel R. v, Aten JA. 1993. Dynamics of three-dimensional replication patterns during the S-phase, analysed by double labelling of DNA and confocal microscopy. J Cell Sci 103:857–862. [DOI] [PubMed] [Google Scholar]
- 34.Dunn KW, Kamocka MM, McDonald JH. 2011. A practical guide to evaluating colocalization in biological microscopy. Am J Physiol Cell Physiol 300:C723–C742. doi: 10.1152/ajpcell.00462.2010. [DOI] [PMC free article] [PubMed] [Google Scholar]
- 35.Huotari J, Helenius A. 2011. Endosome maturation. EMBO J 30:3481–3500. doi: 10.1038/emboj.2011.286. [DOI] [PMC free article] [PubMed] [Google Scholar]
- 36.Salanueva IJ, Carrascosa JL, Risco C. 1999. Structural maturation of the transmissible gastroenteritis coronavirus. J Virol 73:7952–7964. [DOI] [PMC free article] [PubMed] [Google Scholar]
- 37.Fultz PN, Vance PJ, Endres MJ, Tao B, Dvorin JD, Davis IC, Lifson JD, Montefiori DC, Marsh M, Malim MH, Hoxie JA. 2001. In vivo attenuation of simian immunodeficiency virus by disruption of a tyrosine-dependent sorting signal in the envelope glycoprotein cytoplasmic tail. J Virol 75:278–291. doi: 10.1128/JVI.75.1.278-291.2001. [DOI] [PMC free article] [PubMed] [Google Scholar]
- 38.Bu Z, Ye L, Vzorov A, Taylor D, Compans RW, Yang C. 2004. Enhancement of immunogenicity of an HIV Env DNA vaccine by mutation of the Tyr-based endocytosis motif in the cytoplasmic domain. Virology 328:62–73. doi: 10.1016/j.virol.2004.06.041. [DOI] [PubMed] [Google Scholar]
- 39.Costers S, Delputte PL, Nauwynck HJ. 2006. Porcine reproductive and respiratory syndrome virus-infected alveolar macrophages contain no detectable levels of viral proteins in their plasma membrane and are protected against antibody-dependent, complement-mediated cell lysis. J Gen Virol 87:2341–2351. doi: 10.1099/vir.0.81808-0. [DOI] [PubMed] [Google Scholar]
- 40.Van de Walle GR, Favoreel HW, Nauwynck HJ, Pensaert MB. 2003. Antibody-induced internalization of viral glycoproteins and gE-gI Fc receptor activity protect pseudorabies virus-infected monocytes from efficient complement-mediated lysis. J Gen Virol 84:939–947. doi: 10.1099/vir.0.18663-0. [DOI] [PubMed] [Google Scholar]
- 41.Lavi E, Wang Q, Weiss SR, Gonatas NK. 1996. Syncytia formation induced by coronavirus infection is associated with fragmentation and rearrangement of the Golgi apparatus. Virology 221:325–334. doi: 10.1006/viro.1996.0382. [DOI] [PMC free article] [PubMed] [Google Scholar]
- 42.Tobler K, Ackermann M. 1995. PEDV leader sequence and junction sites. Adv Exp Med Biol 380:541–542. doi: 10.1007/978-1-4615-1899-0_86. [DOI] [PubMed] [Google Scholar]
- 43.Beall A, Yount B, Lin C-MM, Hou Y, Wang Q, Saif L, Baric R. 2016. Characterization of a pathogenic full-length cDNA clone and transmission model for porcine epidemic diarrhea virus strain PC22A. mBio 7:e01451-15. doi: 10.1128/mBio.01451-15. [DOI] [PMC free article] [PubMed] [Google Scholar]
- 44.Okda FA, Lawson S, Singrey A, Nelson J, Hain KS, Joshi LR, Christopher-Hennings J, Nelson EA, Diel DG. 2017. The S2 glycoprotein subunit of porcine epidemic diarrhea virus contains immunodominant neutralizing epitopes. Virology 509:185–194. doi: 10.1016/j.virol.2017.06.013. [DOI] [PMC free article] [PubMed] [Google Scholar]
- 45.Almazán F, González JM, Pénzes Z, Izeta A, Calvo E, Plana-Durán J, Enjuanes L. 2000. Engineering the largest RNA virus genome as an infectious bacterial artificial chromosome. Proc Natl Acad Sci U S A 97:5516–5521. doi: 10.1073/pnas.97.10.5516. [DOI] [PMC free article] [PubMed] [Google Scholar]
- 46.Manders EMM, Verbeek FJ, Aten JA. 1993. Measurement of co-localization of objects in dual-colour confocal images. J Microsc 169:375–382. doi: 10.1111/j.1365-2818.1993.tb03313.x. [DOI] [PubMed] [Google Scholar]
- 47.Saif LJ, Ward LA, Yuan L, Rosen BI, To TL. 1996. The gnotobiotic piglet as a model for studies of disease pathogenesis and immunity to human rotaviruses. Arch Virol Suppl 12:153–161. [DOI] [PubMed] [Google Scholar]
- 48.Lin C-MM, Annamalai T, Liu X, Gao X, Lu Z, El-Tholoth M, Hu H, Saif LJ, Wang Q. 2015. Experimental infection of a US spike-insertion deletion porcine epidemic diarrhea virus in conventional nursing piglets and cross-protection to the original US PEDV infection. Vet Res 46:134. doi: 10.1186/s13567-015-0278-9. [DOI] [PMC free article] [PubMed] [Google Scholar]
- 49.Jung K, Wang Q, Scheuer KA, Lu Z, Zhang Y, Saif LJ. 2014. Pathology of US porcine epidemic diarrhea virus strain PC21A in gnotobiotic pigs. Emerg Infect Dis 20:662. [DOI] [PMC free article] [PubMed] [Google Scholar]
- 50.Oka T, Saif LJ, Marthaler D, Esseili MA, Meulia T, Lin C-MM, Vlasova AN, Jung K, Zhang Y, Wang Q. 2014. Cell culture isolation and sequence analysis of genetically diverse US porcine epidemic diarrhea virus strains including a novel strain with a large deletion in the spike gene. Vet Microbiol 173:258–269. doi: 10.1016/j.vetmic.2014.08.012. [DOI] [PMC free article] [PubMed] [Google Scholar]
- 51.Neuman BW, Adair BD, Yeager M, Buchmeier MJ. 2008. Purification and electron cryomicroscopy of coronavirus particles, p 129–136. In Cavanagh D. (ed), SARS- and other coronaviruses: laboratory protocols. Humana Press, Totowa, NJ. [DOI] [PMC free article] [PubMed] [Google Scholar]
- 52.Frigge M, Hoaglin DC, Iglewicz B. 1989. Some implementations of the boxplot. Am Stat 43:50. doi: 10.2307/2685173. [DOI] [Google Scholar]
- 53.Wei Z, Lu W, Li Z, Mo J, Zeng X, Zeng Z, Sun B, Chen F, Xie Q-M, Bee Y, Ma J. 2012. Complete genome sequence of novel porcine epidemic diarrhea virus strain GD-1 in China. J Virol 86:13824–13825. doi: 10.1128/JVI.02615-12. [DOI] [PMC free article] [PubMed] [Google Scholar]
- 54.Duarte M, Laude H. 1994. Sequence of the spike protein of the porcine epidemic diarrhoea virus. J Gen Virol 75:1195–1200. doi: 10.1099/0022-1317-75-5-1195. [DOI] [PubMed] [Google Scholar]
- 55.Gao Y, Kou Q, Ge X, Zhou L, Guo X, Yang H. 2013. Phylogenetic analysis of porcine epidemic diarrhea virus field strains prevailing recently in China. Arch Virol 158:711–715. doi: 10.1007/s00705-012-1541-2. [DOI] [PubMed] [Google Scholar]