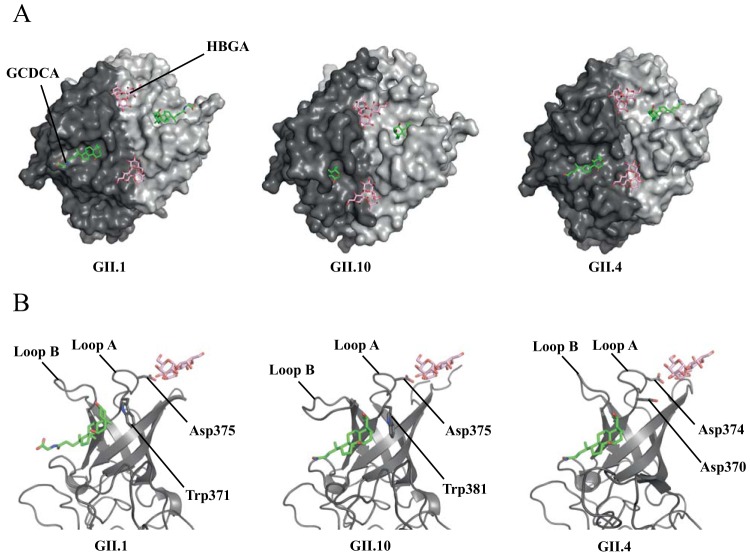
Given that human norovirus virions likely interact with bile acid during a natural infection, our evidence that an HBGA nonbinder (GII.1) can be converted to an HBGA binder after bile acid binding is of major significance. Our data provide direct evidence that, like HBGAs, bile acid interaction on the capsid is an important cofactor for certain genotypes. However, more unanswered questions seem to arise from these new discoveries. For example, is there an association between the bile acid requirement and the prevalence of certain genotypes? That is, the GII.1 and GII.10 (bile acid binders) genotypes rarely caused outbreaks, whereas the GII.4 and GII.17 genotypes (bile acid nonbinders) were responsible for large epidemics. Therefore, it seems plausible that certain genotypes require bile acids, whereas others have modified their bile acid requirements on the capsid.
KEYWORDS: X-ray crystallography, norovirus, structure
ABSTRACT
A recently developed human norovirus cell culture system revealed that the presence of bile enhanced or was an essential requirement for the growth of certain genotypes. Before this discovery, histo-blood group antigens (HBGAs) were the only well-studied cofactor known for human noroviruses, and there was evidence that several genotypes poorly bound HBGAs. Therefore, the purpose of this study was to investigate how human norovirus capsids interact with bile acids. We found that bile acids had low-micromolar affinities for GII.1, GII.10, and GII.19 capsids but did not bind GI.1, GII.3, GII.4, or GII.17. We showed that bile acid bound at a partially conserved pocket on the norovirus capsid-protruding (P) domain using X-ray crystallography. Amino acid sequence alignment and structural analysis delivered an explanation of selective bile acid binding. Intriguingly, we discovered that binding of the bile acid was the critical step to stabilize several P domain loops that optimally placed an essential amino acid side chain (Asp375) to bind HBGAs in an otherwise HBGA nonbinder (GII.1). Furthermore, bile acid enhanced HBGA binding for a known HBGA binder (GII.10). Altogether, these new data suggest that bile acid functions as a loop-stabilizing regulator and enhancer of HBGA binding for certain norovirus genotypes.
IMPORTANCE Given that human norovirus virions likely interact with bile acid during a natural infection, our evidence that an HBGA nonbinder (GII.1) can be converted to an HBGA binder after bile acid binding is of major significance. Our data provide direct evidence that, like HBGAs, bile acid interaction on the capsid is an important cofactor for certain genotypes. However, more unanswered questions seem to arise from these new discoveries. For example, is there an association between the bile acid requirement and the prevalence of certain genotypes? That is, the GII.1 and GII.10 (bile acid binders) genotypes rarely caused outbreaks, whereas the GII.4 and GII.17 genotypes (bile acid nonbinders) were responsible for large epidemics. Therefore, it seems plausible that certain genotypes require bile acids, whereas others have modified their bile acid requirements on the capsid.
INTRODUCTION
Human noroviruses belong to the Caliciviridae family and are the most significant cause of outbreaks of acute gastroenteritis. Human norovirus has a positive-sense single-stranded RNA genome, which encodes three open reading frames (ORFs). ORF1 encodes the nonstructural proteins, ORF2 encodes the capsid protein (VP1), and ORF3 encodes a small structural protein. Based on the VP1 amino acid sequences, human noroviruses are grouped into several genogroups (GI, GII, and GIV), which are subsequently subgrouped into copious genotypes.
Expression of the capsid gene in insect cells results in the formation of virus-like particles (VLPs) that are morphologically similar to native virions. The capsid protein is composed of two domains, where a shell (S) domain forms a scaffold and protects the RNA, while and a protruding (P) domain extends out of the S domain and is involved in host cell attachment (1, 2). Indeed, human histo-blood group antigens (HBGAs) interact with the capsid, and this binding interaction is an observed requirement of infection for most but not all GI and GII genotypes (3–9). Two, possibly four, HBGA binding pockets are located on each P domain dimer, and for GI and GII noroviruses, these pockets are distinct (10). While the precise value of HBGA binding to the capsid remains vague, there are at least nine HBGA types known to bind to noroviruses (3–9).
Unlike murine noroviruses, cultivation of human norovirus in cell culture systems still remains challenging (11, 12). Nevertheless, several new discoveries were recently realized with these cell culture systems. One system was based on replication in B cells and proposed a requirement of commensal bacteria expressing HBGAs or the addition of synthetic HBGAs. Another system utilized human intestinal enteroids (HIE) and showed the requirement of HBGAs on the surface of permissive cells albeit in a strain-specific manner. Also, the presence of bile was shown to enhance or was essential for the growth of certain genotypes (11). Interestingly, bile acid from intestinal contents was also crucial for the propagation of porcine enteric calicivirus (PEC) in porcine kidney cells (13, 14). Various bile acids were shown to enable PEC replication with various efficiencies.
Primary bile acids in humans are synthesized from cholesterol by the liver and are mainly cholic acid (CA) and chenodeoxycholic acid (CDCA). They can be modified by intestinal microbiota to the secondary bile acids as deoxycholic acid (DCA), lithocholic acid (LCA), or ursodeoxycholic acid (UDCA). Primary bile acids can also be further modified by conjugation with glycine or taurine to enhance their solubility in water before they are secreted to the small intestine (15–17).
In this study, we sought to elucidate how different bile acids interact with the human norovirus capsid. In particular, we were interested in HBGA nonbinders (i.e., GII.1) and HBGA binders (i.e., GII.4, GII.10, and GII.17) as well as rarely detected genotypes (i.e., GII.1, GII.10, and GII.19) and epidemic genotypes (GII.4 and GII.17) (5–7, 10, 18, 19). We showed that bile acids bound at a partially conserved pocket on the P domain using X-ray crystallography. We also showed that bile acid binding to the HBGA nonbinder (GII.1) was a critical step that enabled this genotype to bind HBGAs. Altogether, these data provide new insights into requirements of bile acid for certain norovirus genotypes.
RESULTS
ITC bile acid binding measurements.
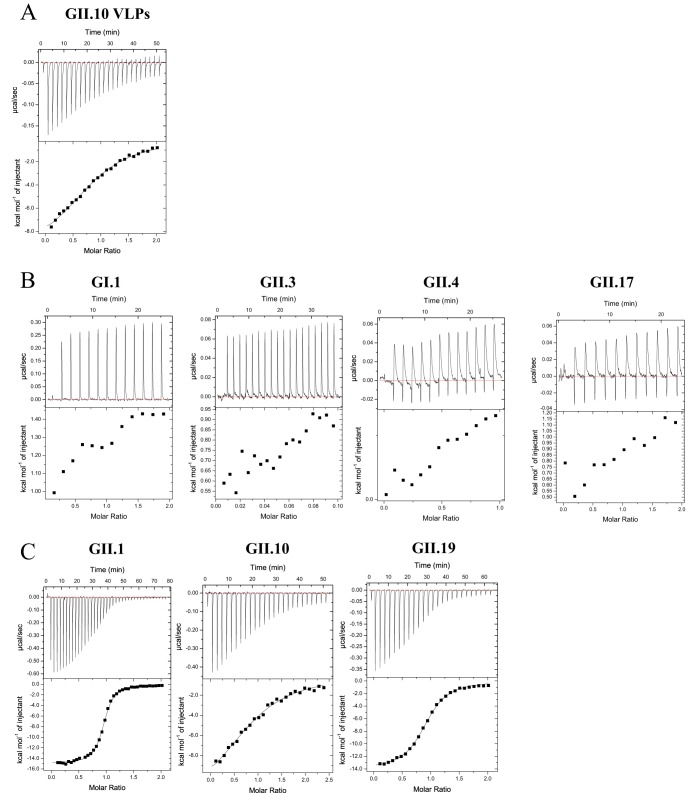
To determine whether bile acid directly binds to the human norovirus capsid, we preformed a series of isothermal titration calorimetry (ITC) binding experiments. Initially, we examined binding to VLPs, where the bile acid was titrated into GI.1, GII.4, and GII.10 VLPs. We found that glycochenodeoxycholic acid (GCDCA) bound to GII.10 VLPs (dissociation constant [Kd] = 6.1 μM) (Fig. 1A and Table 1), while no signals were observed for GI.1 or GII.4 VLPs. Following these results, we rescreened GCDCA binding to GI.1, GII.1, GII.3, GII.4, GII.10, GII.17, and GII.19 P domains. Again, no signals were observed for GI.1 and GII.3, GII.4, or GII.17 P domains (Fig. 1B). For GII.1, GII.10, and GII.19 P domains, GCDCA bound in a low-micromolar range (Fig. 1C). The binding reaction was exothermic and largely driven by substantial negative enthalpy change. GII.1 showed the highest binding affinity for GCDCA, with a Kd of 0.4 μM, followed by GII.19 (Kd = 1.2 μM) and then GII.10 (Kd = 7.2 μM). The stoichiometries of the reactions were 1.0 ± 0.05, indicating the binding of one GCDCA molecule per P domain monomer.
FIG 1.
Thermodynamic properties of GCDCA binding to norovirus VLPs and P domains. (A) Titrations were performed at 25°C by injecting consecutive 3-μl aliquots of 100 μM GCDCA into 10 μM GII.10 VLPs. An example of the titration (top) is shown. The binding isotherm was calculated using a single-binding-site model after subtraction of the heat of dilution (bottom). (B and C) Titrations were performed at 25°C by injecting consecutive 1- to 3-μl aliquots of GCDCA (300 to 500 μM) into GI.1, GII.3, GII.4, GII.17, GII.1, GII.10, and GII.19 P domains (30 to 50 μM). All binding reactions were characterized by the exothermic type of reaction. Thermodynamic constants (enthalpy change [ΔH] entropy change [ΔS], and binding affinity [Kd]) are summarized in Table 1.
TABLE 1.
Thermodynamic properties of bile acids binding to norovirus P domains and VLPsa
| Binding partner | Bile acid | Mean ΔH (cal/mol) ± SD | Mean ΔS (cal/mol/degrees K) ± SD | Mean Kd (M) ± SD |
|---|---|---|---|---|
| GII.1 P domain | GCDCA | −1.6E+04 ± 1E+3 | −23.03 ± 4 | 3.6E−07 ± 3E−8 |
| GCA | −1.6E+04 ± 2E+2 | −25.63 ± 1 | 5.8E−07 ± 5E−8 | |
| TCDCA | −1.7E+04 ± 3E+3 | −28.50 ± 10 | 4.3E−07 ± 9E−8 | |
| TCA | −1.7E+04 ± 3E+2 | −29.33 ± 1 | 6.1E−07 ± 1E−7 | |
| GII.10 P domain | GCDCA | −1.0E+04 ± 3E+3 | −10.32 ± 10 | 7.2E−06 ± 2E−6 |
| GCA | −1.3E+04 ± 1E+2 | −20.13 ± 0.3 | 5.5E−06 ± 2E−8 | |
| TCDCA | −1.2E+04 ± 1E+3 | −16.57 ± 5 | 12.3E−06 ± 8E−7 | |
| TCA | −1.3E+04 ± 2E+3 | −20.10 ± 6 | 10.3E−06 ± 2E−7 | |
| GII.10 VLPs | GCDCA | −1.0E+04 ± 1E+2 | −9.03 ± 1 | 6.1E−06 ± 9E−7 |
| GII.19 P domain | GCDCA | −1.4E+04 ± 4E+2 | −20.26 ± 2 | 1.2E−06 ± 1E−7 |
| GI.1 VLPs/P domain | GCDCA | NB | NB | NB |
| GII.3 P domain | GCDCA | NB | NB | NB |
| GII.4 VLPs/P domain | GCDCA | NB | NB | NB |
| GII.17 P domain | GCDCA | NB | NB | NB |
NB, no binding.
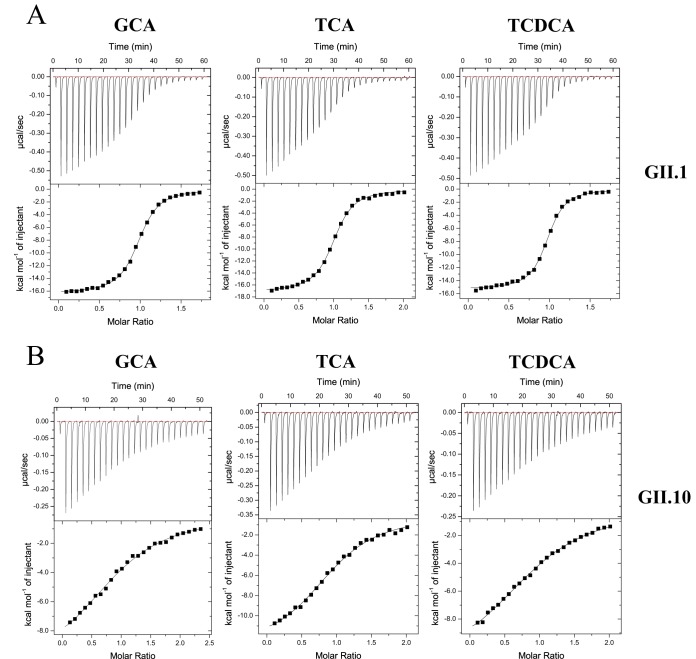
Next, we wanted to see if norovirus capsids (GII.1, GII.10, and GII.19) could distinguish between different bile salts. We performed ITC experiments with either glycine- or taurine-conjugated CDCA (TCDCA) and CA salts. TCDCA showed slightly weaker binding to both GII.1 and GII.10 P domains than GCDCA (Fig. 2). GCDCA/TCDCA had a higher affinity than glycocholic acid (GCA) and taurocholic acid (TCA) for the GII.1 P domain, whereas for the GII.10 P domain, the trend was reversed, where GCA/TCA was marginally preferred over GCDCA/TCDCA. We found that the binding affinities of different bile acids were in a similar range, with a maximum 2-fold difference.
FIG 2.
Thermodynamic properties of GCA, TCA, and TCDCA binding to norovirus P domains. Titrations were performed at 25°C by injecting consecutive aliquots of 300 μM bile acids into 30 to 35 μM GII.1 or GII.10 P domains. All binding reactions were exothermic. The ITC data showed that GII.1 (A) and GII.10 (B) domains bound various types of bile acid with similar affinities. Thermodynamic constants (ΔH, ΔS, and Kd) are summarized in Table 1.
Overall, the ITC data showed that GII.1, GII.10, and GII.19 P domains bound various types of bile acids, whereas GI.1, GII.3, and GII.4 P domains did not bind. Notably, these results showed that both HBGA nonbinder GII.1 (5) and HBGA binder GII.10 (5, 7) bound bile acids.
X-ray crystal structures of GII P domain and GCDCA complexes.
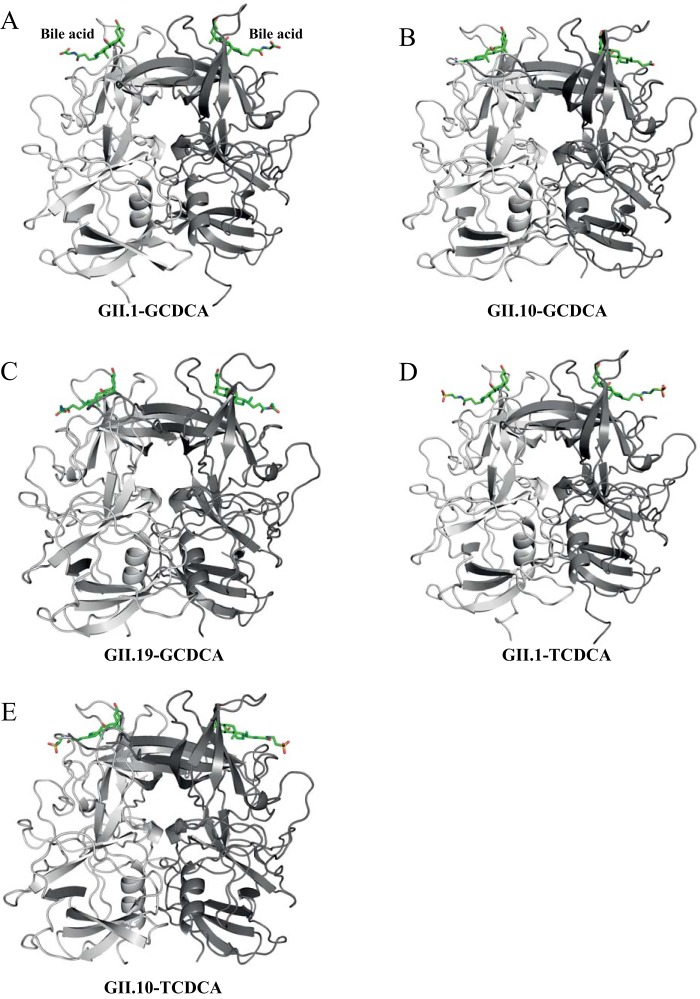
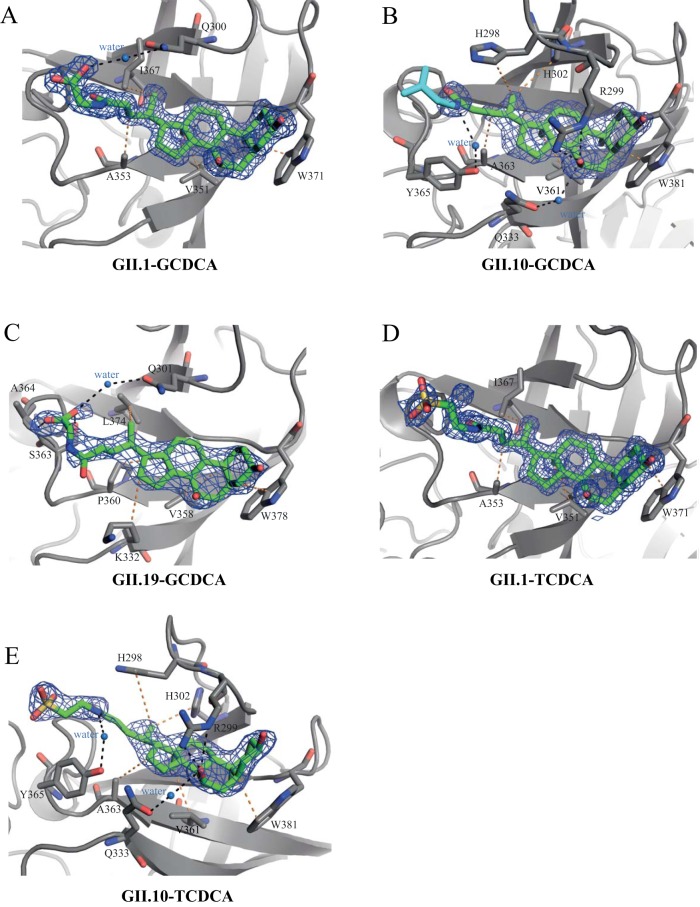
Following the ITC results, we proceeded to solve the X-ray crystal structures of GII.1, GII.10, and GII.19 P domains in complex with GCDCA (Table 2). For GII.10, the asymmetric unit cell contained one P domain dimer and two GCDCA molecules, whereas GII.1 and GII.19 contained one P domain monomer and one GCDCA molecule. In all three genotypes, the GCDCA molecule bound to an identical binding pocket on top of the P domain (Fig. 3). The GII.1 P domain and GCDCA complex structure showed a well-defined electron density for the GCDCA molecule (Fig. 4A). The electron density of GCDCA on the GII.10 P domain was also well defined for most of the GCDCA molecule, although part of the terminal glycine (atoms C26, C27, OT1, and OT2) had no electron density and was omitted from the refined structure (Fig. 4B). The electron density of the GCDCA molecule on the GII.19 P domain was also well defined (Fig. 4C). Overall, these results showed that the GCDCA molecules bound directly on the capsid. Incidentally, we also examined GCDCA binding to GI.1, GII.3, GII.4, and GII.17 P domains; however, the electron density for GCDCA was absent, which is in agreement with our ITC results.
TABLE 2.
Data collection and refinement statistics for the human norovirus P domain and bile acid complex structuresa
| Parameter | Value for binding ofb: |
||||
|---|---|---|---|---|---|
| GII.1 and GCDCA (PDB accession no. 6GVZ) | GII.1 and TCDCA (PDB accession no. 6GW0) | GII.10 and GCDCA (PDB accession no. 6GW1) | GII.10 and TCDCA (PDB accession no. 6GW2) | GII.19 and GCDCA (PDB accession no. 6GW4) | |
| Data collection | |||||
| Space group | C2221 | C2221 | P21212 | P21221 | P6522 |
| Cell dimensions | |||||
| a, b, c (Å) | 74.98, 99.39, 79.28 | 74.45, 99.20, 79.24 | 107.85, 79.67, 87.69 | 79.83, 87.91, 108.34 | 81.24, 81.24, 223.91 |
| α, β, γ (°) | 90, 90, 90 | 90, 90, 90 | 90, 90, 90 | 90, 90, 90 | 90, 90, 120 |
| Resolution range (Å) | 59.86–1.54 (1.59–1.54) | 59.55–1.40 (1.45–1.40) | 45.93–1.90 (1.97–1.90) | 46.12–2.05 (2.12–2.05) | 43.81–2.30 (2.38–2.30) |
| Rmerge | 5.72 (66.74) | 3.74 (46.68) | 6.66 (65.55) | 9.80 (64.77) | 16.72 (78.09) |
| I/σI | 27.70 (3.57) | 41.85 (4.93) | 16.89 (2.49) | 11.02 (2.26) | 13.61 (3.50) |
| Completeness (%) | 99.36 (94.22) | 99.74 (98.34) | 99.38 (96.40) | 99.65 (97.33) | 99.84 (98.90) |
| Redundancy | 13.7 (13.3) | 13.2 (9.5) | 6.4 (6.2) | 6.3 (6.3) | 18.5 (19.0) |
| Refinement | |||||
| Resolution range (Å) | 33.89–1.54 | 32.99–1.40 | 45.93–1.90 | 46.12–2.05 | 40.62–2.30 |
| No. of reflections | 44,174 | 57,927 | 60,113 | 48,564 | 20,419 |
| Rwork/Rfree | 16.79/18.90 | 14.80/16.70 | 16.54/19.00 | 16.95/20.63 | 17.50/21.37 |
| No. of atoms | 2,651 | 2,714 | 5,158 | 5,055 | 2,474 |
| Protein | 2,350 | 2,370 | 4,756 | 4,694 | 2,328 |
| Ligand/ion | 32 | 34 | 58 | 88 | 48 |
| Water | 269 | 310 | 344 | 273 | 98 |
| Avg B factors (Å2) | |||||
| Protein | 19.58 | 15.74 | 33.59 | 42.29 | 38.49 |
| Ligand/ion | 18.41 | 22.32 | 33.65 | 54.07 | 55.51 |
| Water | 25.79 | 24.34 | 37.23 | 41.39 | 38.02 |
| RMSD | |||||
| Bond lengths (Å) | 0.007 | 0.008 | 0.005 | 0.006 | 0.004 |
| Bond angles (°) | 1.210 | 1.270 | 0.750 | 1.090 | 1.060 |
Each data set was collected from a single crystal. RMSD, root mean square deviation.
Values in parentheses are for the highest-resolution shell.
FIG 3.
Crystal structures of GII P domain and bile acid complexes. The P domains are colored as chain A (dark gray) and chain B (light gray). GII.1 and GII.19 are shown as dimers for comparison. In all cases, the bile acids (green sticks) bound to the identical pocket on top of the P domain dimer. (A) GII.1 and GCDCA complex; (B) GII.10 and GCDCA complex; (C) GII.10 and GCDCA complex; (D) GII.1 and TCDCA complex; (E) GII.10 and TCDCA complex. Data statistics are shown in Table 2.
FIG 4.
Closeup view of the bile acid binding pockets. The P domains are colored as chain A (dark gray) and chain B (light gray). The omit map (2Fo − Fc) (blue mesh) is contoured between 2.5 and 2.0 σ. Black dashed lines show the hydrogen bond interactions, while orange lines show hydrophobic interactions. Water molecules are shown as marine-blue spheres. The hydrogen bonds and hydrophobic interactions are given between 2.5 and 3.5 Å and between 3.9 and 5.3 Å, respectively. (A) GII.1 and GCDCA complex; (B) GII.10 and GCDCA complex; (C) GII.10 and GCDCA complex; (D) GII.1 and TCDCA complex; (E) GII.10 and TCDCA complex.
GII.1 P domain and GCDCA complex structure.
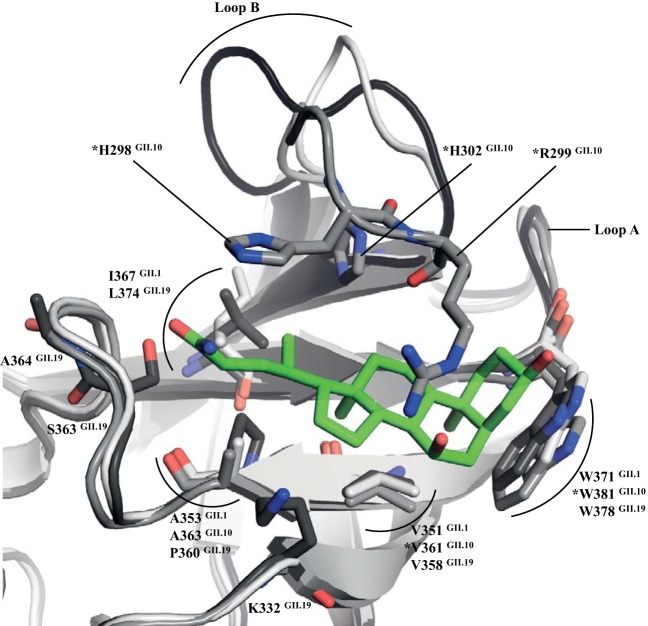
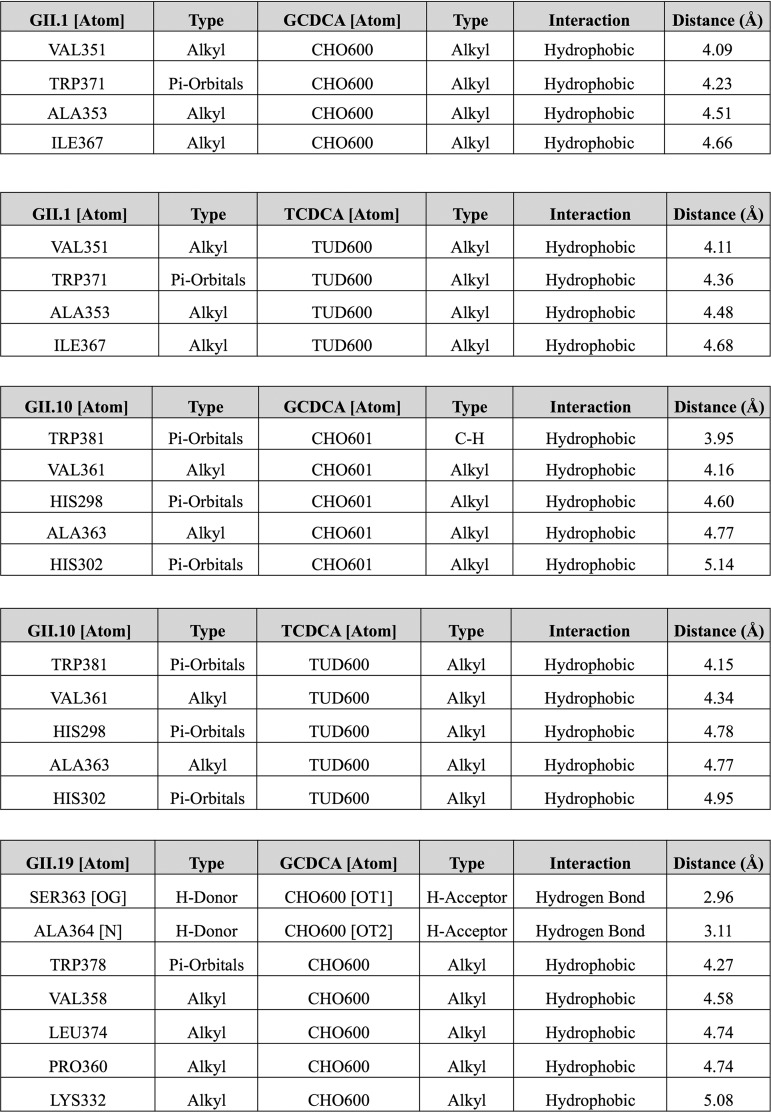
The GCDCA molecule was essentially held by hydrophobic interactions with four GII.1 P domain residues, i.e., Val351, Ala353, Ile367, and Trp371 (Fig. 5 and Table 3). There were no direct hydrogen or ionic bond interactions, except for one water-mediated interaction between Gln300 and the OT2 atom of GCDCA (Fig. 4A). Comparison of the GII.1 P domain GCDCA complex structure with the GII.1 P domain apo structure (PDB accession number 4ROX) (5) revealed that several disordered loops in the GII.1 apo structure were now ordered in the GCDCA complex structure (i.e., loops A and B) (Fig. 5 and 6). Incidentally, these two loops were ordered with clear electron density in most if not all P domains (GII.4, GII.10, GII.12, and GII.17) that interact with HBGAs (5–7, 18–21). These results suggested that GCDCA stabilized GII.1 loops A and B.
FIG 5.
Structural comparison of the GCDCA binding pockets. The following superpositioned GII P domains were colored accordingly: GII.1 (light gray), GII.10 (gray), and GII.19 (dark gray). A single GCDCA molecule (green sticks) from the GII.10 complex structure was superimposed (essentially the same orientation in all genotypes) to compare the binding residues. Only residues that directly interacted with GCDCA are shown. Overall, several residues were structurally conserved, whereas other residues were variable. Loops A and B were found to contain residues interacting with the GCDCA molecule. The residues that were altered for the mutagenesis study are marked with an asterisk.
TABLE 3.
List of hydrophilic and hydrophobic interactions between P domains and bile acids
FIG 6.
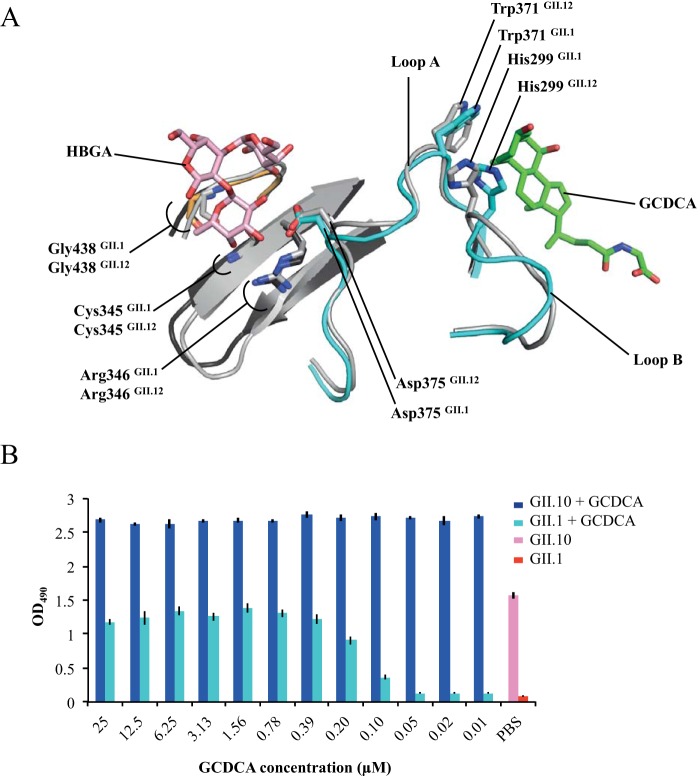
GCDCA effects on HBGA binding. (A) Superposition of GII.12 P domain B-trisaccharide complex (light gray) (PDB accession number 3R6K) and GII.1 P domain apo (black) (PDB accession number 4ROX) structures onto the GII.1 P domain GCDCA (cyan and orange) complex structure. The GII.1 apo structure loop B (residues 293 to 301) was previously disordered, whereas in the GII.1 GCDCA complex, this loop was stabilized (clear electron density), and the His299 side chain was repositioned. Also, GII.1 loop A (residues 370 to 377) in the GII.1 GCDCA complex was positioned similarly to the equivalent loop in the GII.12 B-trisaccharide complex structure. Importantly, the GII.1 Trp371 and Asp375 side chains were almost identical to the equivalent side-chain residues in the GII.12 B-trisaccharide complex. In this position, together with the other fucose binding residues (i.e., Cys345, Arg346, and Gly438), the GII.1 Asp375 side chain could now interact with the fucose of the HBGAs at this pocket. (B) GII.1 VLPs or GII.10 VLPs were preincubated with 2-fold serially diluted GCDCA (starting dilution of 25 μM). Microtiter plates were coated with PGM, and after washing and blocking, the VLP-GCDCA mixture was added to the wells at final concentrations of 5.0 μg/ml for GII.1 VLPs and 0.5 μg/ml for GII.10. GII.1 and GII.10 VLPs in PBS without GCDCA are shown as a reference. The GII.1 GCDCA-treated VLPs bound to PGM in a dose-dependent manner, while the GII.10 GCDCA-treated VLPs bound at all dilutions. A lower concentration of GII.10 VLPs was required for binding to PGM than for the GII.1 VLPs.
Superposition of the GII.12 P domain B-trisaccharide complex structure (7) and the GII.1 P domain apo structure (containing the flexible loops) onto the GII.1 P domain GCDCA complex structure revealed that GII.1 residue Asp375 (loop A) was now precisely positioned to interact with HBGAs (Fig. 6). In fact, the orientation of the Asp375 side chain was almost identical to that of the equivalent Asp375 side-chain residues in the GII.12 B-trisaccharide complex (7). Together with other essential and regular fucose binding residues (i.e., Gly438, Arg346, and Cys345), the Asp375 side chain could be expected to host HBGAs, since all of these residues were similarly positioned in the GII.4, GII.10, and GII.12 HBGA binders (5–7, 10, 18, 19). Thus, the consequences of GCDCA binding to GII.1 were (i) stabilizing two loops (loops A and B) and (ii) correctly positioning the Asp375 side chain to interact with the fucose moiety of HBGAs.
GII.10 and GII.19 P domain and GCDCA complex structures.
In the GII.10 P domain GCDCA complex structure, GCDCA interacted with six P domain residues, i.e., His298, Arg299, His302, Val361, Ala363, and Trp381 (Fig. 4B and 5). These P domain residues held GCDCA with a network of hydrophobic interactions (Table 3). Two water-mediated interactions involving the OE1 atom of Gln333 and the O7 atom of bile acid and the hydroxyl group of Tyr365 and the N25 atom of bile acid were also observed.
For the GII.19 P domain GCDCA complex structure, GCDCA was held with five P domain residues, i.e., Lys332, Val358, Pro360, Leu374, and Trp378, as well as one water-mediated interaction (Fig. 4C and 5 and Table 3). However, unlike GII.1 and GII.10 P domains, the terminal end of GCDCA in the GII.19 complex adapted a slightly different orientation. Two oxygens of the carboxyl group of conjugated glycine formed two hydrogen bonds with the GII.19 P domain residues, i.e., Ser363 and Ala364 (Fig. 4C).
Comparison of GII.1/GII.10/GII.19 P domain GCDCA complex structures showed a difference in the loop B orientation. GII.10 loop B extended over and partially covered the bile acid molecule, whereas the equivalent loop of GII.1 and GII.19 was directed away from the bile acid (Fig. 4 and 5). Interestingly, we previously showed that GII.10 loop B could be in two positions (open or closed) on the P domain dimer, and this depended on whether one or two HBGA molecules bound on the P domain dimer (10). That is, when one HBGA molecule bound on the dimer, the loop at the unoccupied HBGA pocket was opened, but when the concentration of HBGAs was increased and two HBGA molecules bound per dimer, both loops were in the closed position. These results suggested that similarly to high concentrations of HBGAs, the consequence of the two bound GCDCA molecules was two closed loops.
GCDCA involvement in HBGA binding.
To better understand how GCDCA binding to the capsid might influence or alter HBGA binding, we treated GII.1 and GII.10 VLPs and then reanalyzed VLP binding to porcine gastric mucin (PGM; a surrogate source of HBGAs). Previously, we showed that GII.1 VLPs did not bind to PGM, whereas GII.10 VLPs bound in a dose-dependent manner (5). To our amazement, the GII.1 VLPs preincubated with GCDCA now bound strongly to PGM in a GCDCA dose-dependent manner (Fig. 6B). This result strongly indicated that the repositioned Asp375 residue after GCDCA priming enabled the GII.1 VLP to bind HBGAs.
We also discovered that the GII.10 VLPs preincubated with GCDCA had enhanced capacities for binding to HBGAs (Fig. 6B), compared to GII.10 VLPs not treated with GCDCA, i.e., at optical density at 490 nm (OD490) values of 2.7 and 1.6, respectively (5). Conceivably, when GCDCA bound at both pockets on the GII.10 dimer and loop B adapted a closed position, two HBGA molecules likely had an enhanced binding capacity. This scenario explained the enzyme-linked immunosorbent assay (ELISA) results, where the addition of bile acid improved GII.10 VLP binding to HBGAs. Moreover, these results correlated well with the observation that bile enhanced the growth of certain genotypes in cell culture (11). Unfortunately, GII.1 and GII.10 stool specimens were not available at this time to corroborate these new results, but the results clearly showed how the capsid utilized bile acid to interact with HBGAs.
GII P domain and TCDCA complex structures.
In addition to glycine-conjugated bile acid (GCDCA), we investigated how taurine-conjugated bile acid (TCDCA) bound to the GII.1 and GII.10 P domains. For both GII P domains, TCDCA interacted at the same pocket as GCDCA and involved a similar set of binding interactions (Fig. 3, Fig. 4D and E, and Table 3). Unlike GCDCA, which lacked the terminal glycine density in the GII.10 complex structure, the TCDCA molecule in the GII.10 complex showed clear electron density for the terminal taurine (Fig. 4E). Interestingly, TCDCA was held with an almost identical set of residues as GCDCA, which indicated that this bile acid pocket was nicely tailored to host different types of bile acids. On the other hand, the electron density for TCDCA was absent in the GI.1, GII.4, and GII.17 P domain structures. Taken together, these results showed that bile acid binding on the capsid was genotype specific, but certain genotypes could bind several types of bile acid at the same pocket.
Conservation of the bile acid pocket.
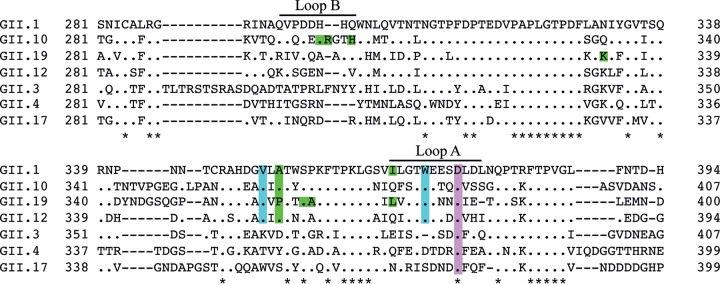
In order to elucidate why some capsids do not interact with bile acid, we compared the sequences of GII.1, GII.4, and GII.10 P domains. An amino acid alignment of different genotypes revealed that only two bile acid binding residues on the capsid (Val361 and Trp381 [GII.1 numbering]) were conserved in GII.1, GII.10, GII.12, and GII.19 (Fig. 7). Other bile acid binding residues were variable, which suggested that these residues might provide auxiliary binding functions. The conserved P domain residues that bind the bile acid formed a hydrophobic platform for the complementary hydrophobic core of the bile acid molecule (Fig. 8). In contrast, genotypes that failed to bind bile acid featured polar or bulky amino acids. These substitutions resulted in a noticeably different landscape of the comparable pocket for these genotypes and likely prevented bile acid from binding to the capsid.
FIG 7.
Conservation of the GII bile acid binding pocket. Amino acid sequence alignments of GII capsids were performed using ClustalX (Genetyx software). The conserved P domain residues interacting with bile acid are highlighted in cyan. Variable residues that interacted with the bile acid tail are colored green. The conserved Asp residue (purple) is known to bind to the fucose moiety of HBGAs. Note that only a partial capsid sequence is shown, and the asterisks indicate highly conserved residues.
FIG 8.
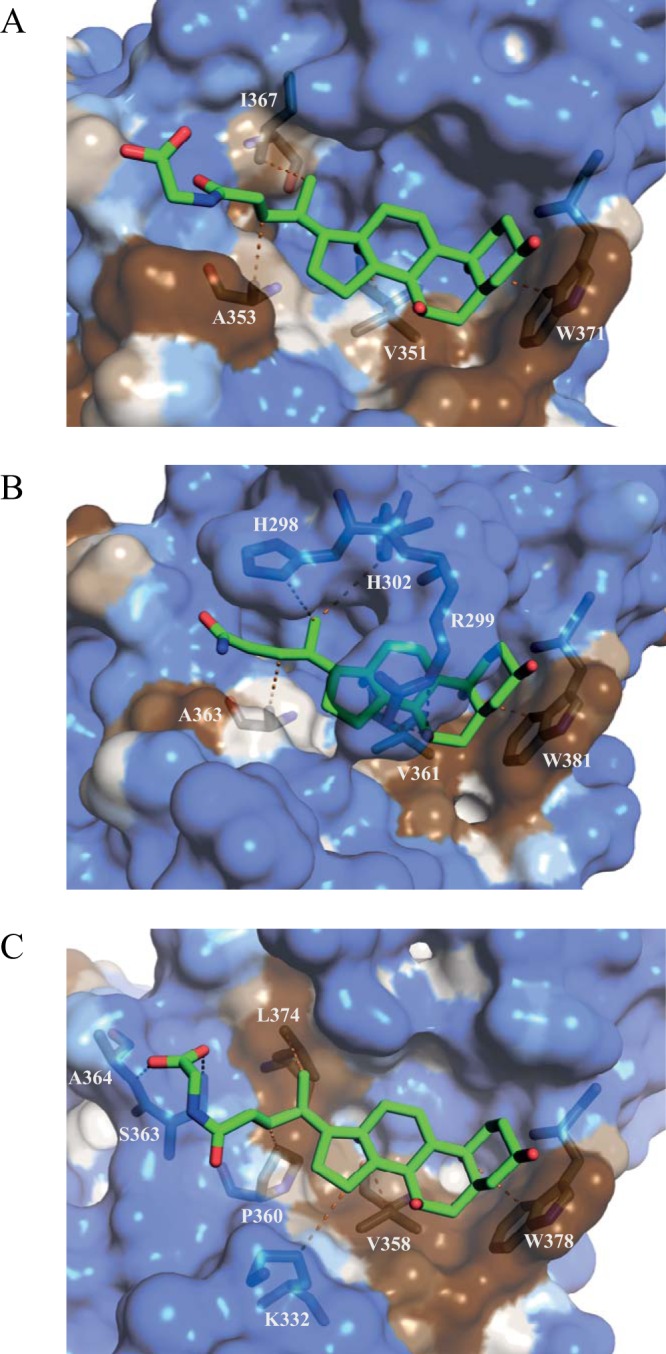
Hydrophobicity at the GII bile acid binding pocket. Hydrophobic surface representations of each P domain, GII.1 (A) GII.10 (B), and GII.19 (C), in complex with bile acid (GCDCA) (green sticks) indicate that bile acids rest on a partly hydrophobic surface (brown) in the binding pocket. Hydrophilic regions are shown in blue. Only residues that interact directly with bile acid are shown. Residues that are involved in the water-mediated interactions are not shown.
Validation of the bile acid binding residues.
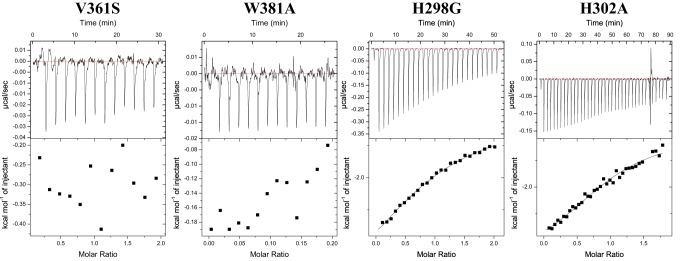
To confirm the essential P domain bile acid binding residues, we mutated five residues in the GII.10 P domain: two conserved residues (V361S and W381A) and three variable residues (H298G, R299A, and H302A) (Fig. 9). In each case, the substituting residue was chosen to maximally disrupt the existing interaction with the bile acid molecule. The V361S and W381A mutations completely abolished the binding, confirming the crucial role of the conserved hydrophobic residues. Substitutions of either H302 or H298 led to an approximately 3-fold affinity reduction for H302 (Kd = 18 μM) and a 40-fold reduction for H298 (Kd = 107 μM), whereas the R299 mutation did not influence the binding affinity (Kd = 7 μM). The GCDCA binding reaction to both H298G and H302A was characterized by a markedly reduced enthalpy change and increased entropy, compared to the wild-type P domain. The unfavorable enthalpy change could be attributed to the loss of direct interactions between GCDCA and H298G or H302A. Improved entropy input likely arises from increased degrees of freedom of loop B carrying H298 and H302. Despite a more favorable entropy change, the drop in the enthalpic component resulted in an overall reduced binding affinity. These results indicated that the H298 and H302 variable residues contribute to a tighter binding of bile acid but were not strictly required. Overall, these ITC data supported the observations in the sequence alignment and structural data.
FIG 9.
Thermodynamic properties of GCDCA binding to GII.10 P domain mutants. Titrations were performed at 25°C by injecting consecutive aliquots of 450 μM GCDCA into 45 μM GII.10 P domain mutants (i.e., H298G, R299A, H302A, V361S, and W381A). Substitutions of V361S and W381A led to a complete loss of GCDCA binding. Substitutions of H298A and H302G led to severalfold affinity reductions, with Kd values of 18 μM and 107 μM, respectively. The R299A mutant did not influence the binding affinity.
Bile acid and HBGA binding pockets.
Our data have shown that bile acid was an important cofactor for certain genotypes. The bile acid and HBGA cofactors were positioned on top of the P domain in such a way that these molecules produced a cross-like formation in close proximity to each other (Fig. 10A). In the case of the bile acid nonbinder GII.4, the landscape could still offer a platform for a bile acid molecule. However, as revealed in the ITC data, Trp381 was a vital residue for bile acid binding, which was substituted for Asp370 in GII.4 (Fig. 10B). This substitution likely abolished GII.4 binding of bile acid. This void region might be replaced with other unknown functions, since other GII.4 variants also lacked an equivalent GII.10 Trp381 residue. Taken together, these new findings underscore the complexity of one or two cofactor interactions on the capsid, and this complexity will likely intensify when the putative receptor for human norovirus is finally revealed.
FIG 10.
The presumed bile acid and HBGA interaction on the P domain. Based on previous X-ray structures, the GII.1 HBGA pocket would likely be similar to the known GII.10, GII.12, and GII.4 HBGA binding pockets. (A) The P domain (surface representation) of the projected and known HBGA and bile acid binding pockets. The B-trisaccharide molecules from the GII.12 B-trisaccharide complex structure (PDB accession number 3R6K) were superpositioned onto the GII.1 P domain GCDCA complex structure. The B-trisaccharide molecules from the GII.10 B-trisaccharide complex structure (PDB accession number 3Q38) were modeled into the GII.10 P domain GCDCA complex. The GCDCA molecules (from the GII.10 P domain GCDCA complex) were superpositioned onto the GII.4 P domain B-trisaccharide complex structure (PDB accession number 4OP7). (B) Looking at the GCDCA and HBGA binding pockets from another angle shows that these two cofactors bind around the barrel-like structure on the P domain, which projects off loops A and B. These pockets and structural features are comparable among bile acid binders and nonbinders.
DISCUSSION
The effects of bile salts on viruses have been studied since around 1906 (22). A number of studies have indicated that bile acids act as important factors in the modulation of viral replication through various cell-associated mechanisms (13, 23–26). In some cases, bile acids influence signaling pathways and transcription factors, whereas in other cases, bile acts through the bile acid receptor (e.g., rotavirus) or aids in endosomal release (e.g., porcine calicivirus).
In the recent case of human norovirus, the addition of bile was shown to be vital for (GI.1 and GII.17) or to enhance (GII.4) replication in cell culture (11). In our study, we showed that different types of bile acid directly bound on the GII capsid. Of significance, our data indicated that only the rarely detected genotypes (GII.1, GII.10, and GII.19) bound bile acid, whereas the epidemic genotypes (GI.1, GII.4, and GII.17) did not bind. This result was somewhat surprising, since the cell culture system clearly showed that GI.1, GII.4, and GII.17 benefited from the addition of bile (11). It is possible that bile acids might indirectly affect norovirus replication by modulating host cell processes, as mentioned above, and these mechanisms might also be strain specific. In addition, other components of bile, which were not studied here, could also be involved in or required for binding. Overall, it is clear that norovirus can utilize multiple cofactors, and a complex interplay likely influences infection.
Genetic substitutions in the projected bile acid pocket on the GII.4 P domain might have alleviated this requirement of direct bile acid binding. On the other hand, genetic substitutions in the GII.4 HBGA pocket have not hindered the ability of this genotype to bind numerous HBGA types (6). Moreover, in the case of GII.17, amino acid substitutions permitted recent variants to acquire HBGA binding and become an epidemic genotype (18, 21). Clearly, these observations raise an interesting question of whether the ability to directly bind bile acid on the capsid confers any evolutionary advantage in terms of infectivity or viral fitness.
Until recently, HBGAs were the only known and well-characterized cofactor for human noroviruses. Here, we resolve that bile acid was also a required cofactor that directly bound to the capsid for certain genotypes. Given that a norovirus virion likely interacts with bile acid during an infection, our evidence that an HBGA nonbinder can be converted to an HBGA binder is of major significance. For example, previous binding studies using different sources of HBGAs may not be entirely accurate without the presence of the bile acid cofactor (27–35). Considering that human norovirus first encounters soluble HBGAs in saliva and then bile acids, could the order of cofactor binding be an important consequence of cell attachment, especially since HBGAs are also likely located on the cell surface? One idea is that bile acid acts as a sensor in the gastrointestinal tract, where it binds to the capsid and amplifies attachment to HBGAs at the cell surface.
Overall, these new data further emphasize the complex nature of norovirus requirements for an infection, i.e., one or two cofactors as well as an as-yet-unknown receptor. On the other hand, at least there is a new potential target for developing inhibitors, i.e., the bile acid pocket.
MATERIALS AND METHODS
Protein expression and purification.
Human norovirus P domains, GI.1 (GenBank accession number M87661), GII.1 (accession number HCU07611), GII.3 (accession number DQ093066), GII.4 (accession number JX459908), GII.10 (accession number AF504671), GII.17 (accession number LC037415), and GII.19 (accession number AB083780), were prepared as previously described (7). For GII.10 P domain mutation studies, a single amino acid codon was substituted, and the P domain sequence was resynthesized. These codon-optimized P domains were cloned into an expression vector (pMal-c2X) and transformed into BL21 cells. Transformed cells were grown in LB medium and induced with isopropyl-β-d-thiogalactopyranoside (IPTG). His-tagged fusion P domains were cleaved and purified from Ni-nitrilotriacetic acid (NTA) columns. The P domains were further purified by size exclusion chromatography, concentrated to 2 to 4 mg/ml, and then stored at 4°C. The corresponding VLPs were also produced as described previously (36).
Isothermal titration calorimetry.
Isothermal titration calorimetry (ITC) experiments were performed using an ITC-200 instrument (Malvern Panalytical). The P domains and VLPs were dialyzed into phosphate-buffered saline (PBS) (pH 7.4) and filtered prior to the ITC experiments. The bile acids (Sigma) GCA (sodium glycocholate hydrate) (catalog number 338950815), GCDCA (sodium glycochenodeoxycholate) (catalog number 16564435), TCA (taurocholic acid sodium salt hydrate) (catalog number 345909264), and TCDCA (sodium taurochenodeoxycholate) (catalog number 6009989) were dissolved to 50 mM in the same PBS solution. Titrations were performed at 25°C by injecting consecutive (1- to 3-μl) aliquots of bile acids (100 to 450 μM) into P domains or VLPs (10 to 45 μM) at 140-s intervals. Injections were performed until saturation was achieved. To correct for the heat of dilution, control experiments were performed by titrating bile salt into the buffer. The heat associated with the control titration was subtracted from raw binding data prior to fitting. The data were fitted using a single-set binding model (Origin 7.0 software). Binding sites were assumed to be identical.
Crystallization of P domains and bile acid.
The P domains and bile acids (GCDCA or TCDCA) were mixed in a 1:10 molar ratio and incubated at 25°C for ∼30 min. Complex crystals were grown using the hanging-drop vapor diffusion method at 18°C for ∼6 to 10 days. The GI.1 P domain crystallized in a mother solution containing 0.1 M phosphate citrate (pH 4.2), 0.2 M NaCl, and 20% (wt/vol) polyethylene glycol 8000 (PEG 8000). The GII.1 P domain crystallized in a solution containing 0.1 M sodium chloride, 5 mM magnesium chloride hexahydrate, 0.1 M Tris (pH 8.5), and 30% (wt/vol) PEG 2000 monomethyl ether (MME). The GII.4 crystals were grown in 3 M sodium acetate (pH 6.9). The GII.10 P domain crystallized in a mother solution containing 0.1 M magnesium acetate tetrahydrate, 0.1 M sodium citrate (pH 5.8), and 14% (wt/vol) PEG 5000 MME. The GII.17 P domain crystallized in a solution containing 0.2 M MgCl2, 20% (wt/vol) PEG 8000, and 0.1 M Tris-HCl (pH 8.5). The GII.19 P domain crystallized in a mother solution containing 0.2 M ammonium acetate, 0.1 M sodium acetate (pH 4.6), and 30% (wt/vol) PEG 4000. Cryoprotectants were prepared using the crystallization mother solutions with the addition of 30% ethylene glycol or by increasing the concentration of the respective PEG solution to 40%.
Data collection, structure solution, and refinement.
Single crystals were used for data collection at the European Synchrotron Radiation Facility, France, at beamlines ID29, ID30A-3, and ID30B. Data were scaled using XDS (37). Space group assignments were confirmed using POINTLESS (38). The molecular replacement method in PHASER (39) was used to solve structures using the apo P domain structures (PDB accession numbers 4ROX and 3ONU ) as search models. Unoccupied electron densities for bound bile acids were confirmed using the difference maps (mFo − DFc). Bile acid molecules were not added to the model until the last rounds of refinement to reduce model bias. All structures were refined in multiple rounds of manual model building in COOT (40), with subsequent refinement with PHENIX (41). Structures were validated with COOT and Molprobity (42) throughout all refinement cycles. Intermolecular distances were analyzed using Biovia Discovery Studio software. Accepted values for hydrogen bonding and hydrophobic interaction distances were between 2.8 and 3.5 Å and between 3.9 and 5.3 Å, respectively. All figures were generated using PyMOL software. The hydrophobicity of the surface was calculated using the online server PLATINUM (43).
ELISA with GCDCA and GII VLPs.
In order to determine if bile acid enhanced VLP binding to HBGAs, VLPs were preincubated with bile acid (GCDCA) before measuring binding to PGM using an ELISA (5). Microtiter plates (Maxisorp; Thermo Scientific) were coated with 100 μl/well of PGM (10 μg/ml; Sigma) overnight at 4°C. Plates were washed three times with PBS (pH 7.4) containing 0.1% Tween 20 (PBS-T) and then blocked with 5% skim milk in PBS (PBS-SM) for 2 h at room temperature. GCDCA was serially diluted from 50 μM, and 10.0 μg/ml of GII.1 VLPs or 1.0 μg/ml of GII.10 VLPs was then added at a 1:1 ratio in GCDCA dilutions. This gave a starting dilution of 25 μM GCDCA in 5.0 μg/ml of GII.1 VLPs or 0.5 μg/ml of GII.10 VLPs. PGM-coated plates were washed three times with PBS-T, and 100 μl of each dilution was then added to wells for 1 h at room temperature. After washing with PBS-T, 100 μl/well primary polyclonal antibodies, HV-1068 (for GII.1) and 026-Rab2 (for GII.10), was added at dilutions of 1:5,000 and 1:20,000 in PBS-T-SM, respectively. After incubation for 1 h at room temperature, secondary anti-rabbit-horseradish peroxidase (HRP)-conjugated antibody (Thermo Scientific) was added at a 1:5,000 dilution in PBS-T-SM and incubated for 1 h at room temperature. After washing, 100 μl of the substrate o-phenylenediamine and H2O2 were added to wells and left in the dark for 30 min at room temperature. The reaction was stopped with the addition of 50 μl of 3 N HCl, and the absorbance was measured at 490 nm (OD490). All experiments were performed in triplicate. The final OD490 value is the sample mean minus the PBS mean (i.e., ∼0.05). A cutoff limit was set at an OD490 of >0.15, which was ∼3 times the value of the negative control (PBS). These ELISA binding experiments were also repeated with TCDCA (data not shown).
Accession number(s).
Atomic coordinates and structure factors were deposited at the Protein Data Bank (PDB) under the following accession numbers: 6GVZ for GII.1 in complex with GCDCA, 6GW0 for GII.1 in complex with TCDCA, 6GW1 for GII.10 in complex with GCDCA, 6GW2 for GII.10 in complex with TCDCA, and 6GW4 for GII.19 in complex with GCDCA.
ACKNOWLEDGMENTS
We acknowledge the protein crystallization platform within the excellence cluster CellNetworks of the University of Heidelberg for initial crystal screening. We thank the staff of the European Synchrotron Radiation Facility (ESRF) and the European Molecular Biology Laboratory (EMBL-Grenoble) for assistance and support in using beamlines ID29, ID30A-3, and ID30B.
G.S.H. was funded by the CHS Foundation, the Helmholtz-Chinese Academy of Sciences (HCJRG-202), the BMBF VIP+ (Federal Ministry of Education and Research) (NATION, 03VP00912), and the Deutsche Forschungsgemeinschaft (DFG) (FOR2327).
REFERENCES
- 1.Glass RI, Parashar UD, Estes MK. 2009. Norovirus gastroenteritis. N Engl J Med 361:1776–1785. doi: 10.1056/NEJMra0804575. [DOI] [PMC free article] [PubMed] [Google Scholar]
- 2.Prasad BV, Hardy ME, Dokland T, Bella J, Rossmann MG, Estes MK. 1999. X-ray crystallographic structure of the Norwalk virus capsid. Science 286:287–290. doi: 10.1126/science.286.5438.287. [DOI] [PubMed] [Google Scholar]
- 3.Liu W, Chen Y, Jiang X, Xia M, Yang Y, Tan M, Li X, Rao Z. 2015. A unique human norovirus lineage with a distinct HBGA binding interface. PLoS Pathog 11:e1005025. doi: 10.1371/journal.ppat.1005025. [DOI] [PMC free article] [PubMed] [Google Scholar]
- 4.Hao N, Chen Y, Xia M, Tan M, Liu W, Guan X, Jiang X, Li X, Rao Z. 2015. Crystal structures of GI.8 Boxer virus P dimers in complex with HBGAs, a novel evolutionary path selected by the Lewis epitope. Protein Cell 6:101–116. doi: 10.1007/s13238-014-0126-0. [DOI] [PMC free article] [PubMed] [Google Scholar]
- 5.Singh BK, Leuthold MM, Hansman GS. 2016. Structural constraints on human norovirus binding to histo-blood group antigens. mSphere 1:e00049-16. doi: 10.1128/mSphere.00049-16. [DOI] [PMC free article] [PubMed] [Google Scholar]
- 6.Singh BK, Leuthold MM, Hansman GS. 2015. Human noroviruses’ fondness for histo-blood group antigens. J Virol 89:2024–2040. doi: 10.1128/JVI.02968-14. [DOI] [PMC free article] [PubMed] [Google Scholar]
- 7.Hansman GS, Biertumpfel C, Georgiev I, McLellan JS, Chen L, Zhou T, Katayama K, Kwong PD. 2011. Crystal structures of GII.10 and GII.12 norovirus protruding domains in complex with histo-blood group antigens reveal details for a potential site of vulnerability. J Virol 85:6687–6701. doi: 10.1128/JVI.00246-11. [DOI] [PMC free article] [PubMed] [Google Scholar]
- 8.Choi JM, Hutson AM, Estes MK, Prasad BV. 2008. Atomic resolution structural characterization of recognition of histo-blood group antigens by Norwalk virus. Proc Natl Acad Sci U S A 105:9175–9180. doi: 10.1073/pnas.0803275105. [DOI] [PMC free article] [PubMed] [Google Scholar]
- 9.Cao S, Lou Z, Tan M, Chen Y, Liu Y, Zhang Z, Zhang XC, Jiang X, Li X, Rao Z. 2007. Structural basis for the recognition of blood group trisaccharides by norovirus. J Virol 81:5949–5957. doi: 10.1128/JVI.00219-07. [DOI] [PMC free article] [PubMed] [Google Scholar]
- 10.Koromyslova AD, Leuthold MM, Bowler MW, Hansman GS. 2015. The sweet quartet: binding of fucose to the norovirus capsid. Virology 483:203–208. doi: 10.1016/j.virol.2015.04.006. [DOI] [PubMed] [Google Scholar]
- 11.Ettayebi K, Crawford SE, Murakami K, Broughman JR, Karandikar U, Tenge VR, Neill FH, Blutt SE, Zeng XL, Qu L, Kou B, Opekun AR, Burrin D, Graham DY, Ramani S, Atmar RL, Estes MK. 2016. Replication of human noroviruses in stem cell-derived human enteroids. Science 353:1387–1393. doi: 10.1126/science.aaf5211. [DOI] [PMC free article] [PubMed] [Google Scholar]
- 12.Jones MK, Watanabe M, Zhu S, Graves CL, Keyes LR, Grau KR, Gonzalez-Hernandez MB, Iovine NM, Wobus CE, Vinje J, Tibbetts SA, Wallet SM, Karst SM. 2014. Enteric bacteria promote human and mouse norovirus infection of B cells. Science 346:755–759. doi: 10.1126/science.1257147. [DOI] [PMC free article] [PubMed] [Google Scholar]
- 13.Chang K-O, Sosnovtsev SV, Belliot G, Kim Y, Saif LJ, Green KY. 2004. Bile acids are essential for porcine enteric calicivirus replication in association with down-regulation of signal transducer and activator of transcription 1. Proc Natl Acad Sci U S A 101:8733–8738. doi: 10.1073/pnas.0401126101. [DOI] [PMC free article] [PubMed] [Google Scholar]
- 14.Shivanna V, Kim Y, Chang KO. 2014. The crucial role of bile acids in the entry of porcine enteric calicivirus. Virology 456–457:268–278. doi: 10.1016/j.virol.2014.04.002. [DOI] [PMC free article] [PubMed] [Google Scholar]
- 15.Esteller A. 2008. Physiology of bile secretion. World J Gastroenterol 14:5641–5649. doi: 10.3748/wjg.14.5641. [DOI] [PMC free article] [PubMed] [Google Scholar]
- 16.Hofmann AF, Hagey LR. 2014. Key discoveries in bile acid chemistry and biology and their clinical applications: history of the last eight decades. J Lipid Res 55:1553–1595. doi: 10.1194/jlr.R049437. [DOI] [PMC free article] [PubMed] [Google Scholar]
- 17.Martinez-Augustin O, Sanchez de Medina F. 2008. Intestinal bile acid physiology and pathophysiology. World J Gastroenterol 14:5630–5640. doi: 10.3748/wjg.14.5630. [DOI] [PMC free article] [PubMed] [Google Scholar]
- 18.Koromyslova A, Tripathi S, Morozov V, Schroten H, Hansman GS. 2017. Human norovirus inhibition by a human milk oligosaccharide. Virology 508:81–89. doi: 10.1016/j.virol.2017.04.032. [DOI] [PubMed] [Google Scholar]
- 19.Schroten H, Hanisch FG, Hansman GS. 2016. Human norovirus interactions with histo-blood group antigens and human milk oligosaccharides. J Virol 90:5855–5859. doi: 10.1128/JVI.00317-16. [DOI] [PMC free article] [PubMed] [Google Scholar]
- 20.Weichert S, Koromyslova A, Singh BK, Hansman S, Jennewein S, Schroten H, Hansman GS. 2016. Structural basis for norovirus inhibition by human milk oligosaccharides. J Virol 90:4843–4848. doi: 10.1128/JVI.03223-15. [DOI] [PMC free article] [PubMed] [Google Scholar]
- 21.Singh BK, Koromyslova A, Hefele L, Gurth C, Hansman GS. 2015. Structural evolution of the emerging 2014/15 GII.17 noroviruses. J Virol 90:2710–2715. doi: 10.1128/JVI.03119-15. [DOI] [PMC free article] [PubMed] [Google Scholar]
- 22.Wilson S. 1939. The action of bile salts on viruses. J Pathol Bacteriol 48:557–571. [Google Scholar]
- 23.Chen W, Liu J, Gluud C. 2007. Bile acids for viral hepatitis. Cochrane Database Syst Rev 2007: CD003181. [DOI] [PMC free article] [PubMed] [Google Scholar]
- 24.Kim Y, Chang KO. 2011. Inhibitory effects of bile acids and synthetic farnesoid X receptor agonists on rotavirus replication. J Virol 85:12570–12577. doi: 10.1128/JVI.05839-11. [DOI] [PMC free article] [PubMed] [Google Scholar]
- 25.Schupp A-K, Graf D. 2014. Bile acid-induced modulation of virus replication. Eur J Med Res 19:S27. doi: 10.1186/2047-783X-19-S1-S27. [DOI] [Google Scholar]
- 26.Schupp AK, Trilling M, Rattay S, Le-Trilling VTK, Haselow K, Stindt J, Zimmermann A, Haussinger D, Hengel H, Graf D. 2016. Bile acids act as soluble host restriction factors limiting cytomegalovirus replication in hepatocytes. J Virol 90:6686–6698. doi: 10.1128/JVI.00299-16. [DOI] [PMC free article] [PubMed] [Google Scholar]
- 27.Debbink K, Lindesmith LC, Donaldson EF, Costantini V, Beltramello M, Corti D, Swanstrom J, Lanzavecchia A, Vinje J, Baric RS. 2013. Emergence of new pandemic GII.4 Sydney norovirus strain correlates with escape from herd immunity. J Infect Dis 208:1877–1887. doi: 10.1093/infdis/jit370. [DOI] [PMC free article] [PubMed] [Google Scholar]
- 28.Lindesmith LC, Debbink K, Swanstrom J, Vinje J, Costantini V, Baric RS, Donaldson EF. 2012. Monoclonal antibody-based antigenic mapping of norovirus GII.4-2002. J Virol 86:873–883. doi: 10.1128/JVI.06200-11. [DOI] [PMC free article] [PubMed] [Google Scholar]
- 29.Lindesmith LC, Donaldson EF, Lobue AD, Cannon JL, Zheng DP, Vinje J, Baric RS. 2008. Mechanisms of GII.4 norovirus persistence in human populations. PLoS Med 5:e31. doi: 10.1371/journal.pmed.0050031. [DOI] [PMC free article] [PubMed] [Google Scholar]
- 30.Rockx BH, Vennema H, Hoebe CJ, Duizer E, Koopmans MP. 2005. Association of histo-blood group antigens and susceptibility to norovirus infections. J Infect Dis 191:749–754. doi: 10.1086/427779. [DOI] [PubMed] [Google Scholar]
- 31.Tan M, Hegde RS, Jiang X. 2004. The P domain of norovirus capsid protein forms dimer and binds to histo-blood group antigen receptors. J Virol 78:6233–6242. doi: 10.1128/JVI.78.12.6233-6242.2004. [DOI] [PMC free article] [PubMed] [Google Scholar]
- 32.Harrington PR, Vinje J, Moe CL, Baric RS. 2004. Norovirus capture with histo-blood group antigens reveals novel virus-ligand interactions. J Virol 78:3035–3045. doi: 10.1128/JVI.78.6.3035-3045.2004. [DOI] [PMC free article] [PubMed] [Google Scholar]
- 33.Tan M, Huang P, Meller J, Zhong W, Farkas T, Jiang X. 2003. Mutations within the P2 domain of norovirus capsid affect binding to human histo-blood group antigens: evidence for a binding pocket. J Virol 77:12562–12571. doi: 10.1128/JVI.77.23.12562-12571.2003. [DOI] [PMC free article] [PubMed] [Google Scholar]
- 34.Lindesmith L, Moe C, Marionneau S, Ruvoen N, Jiang X, Lindblad L, Stewart P, LePendu J, Baric R. 2003. Human susceptibility and resistance to Norwalk virus infection. Nat Med 9:548–553. doi: 10.1038/nm860. [DOI] [PubMed] [Google Scholar]
- 35.Huang P, Farkas T, Marionneau S, Zhong W, Ruvoen-Clouet N, Morrow AL, Altaye M, Pickering LK, Newburg DS, LePendu J, Jiang X. 2003. Noroviruses bind to human ABO, Lewis, and secretor histo-blood group antigens: identification of 4 distinct strain-specific patterns. J Infect Dis 188:19–31. doi: 10.1086/375742. [DOI] [PubMed] [Google Scholar]
- 36.Hansman GS, Natori K, Shirato-Horikoshi H, Ogawa S, Oka T, Katayama K, Tanaka T, Miyoshi T, Sakae K, Kobayashi S, Shinohara M, Uchida K, Sakurai N, Shinozaki K, Okada M, Seto Y, Kamata K, Nagata N, Tanaka K, Miyamura T, Takeda N. 2006. Genetic and antigenic diversity among noroviruses. J Gen Virol 87:909–919. doi: 10.1099/vir.0.81532-0. [DOI] [PubMed] [Google Scholar]
- 37.Kabsch W. 2010. Xds. Acta Crystallogr D Biol Crystallogr 66:125–132. doi: 10.1107/S0907444909047337. [DOI] [PMC free article] [PubMed] [Google Scholar]
- 38.Evans P. 2006. Scaling and assessment of data quality. Acta Crystallogr D Biol Crystallogr 62:72–82. doi: 10.1107/S0907444905036693. [DOI] [PubMed] [Google Scholar]
- 39.McCoy AJ, Grosse-Kunstleve RW, Adams PD, Winn MD, Storoni LC, Read RJ. 2007. Phaser crystallographic software. J Appl Crystallogr 40:658–674. doi: 10.1107/S0021889807021206. [DOI] [PMC free article] [PubMed] [Google Scholar]
- 40.Emsley P, Lohkamp B, Scott WG, Cowtan K. 2010. Features and development of Coot. Acta Crystallogr D Biol Crystallogr 66:486–501. doi: 10.1107/S0907444910007493. [DOI] [PMC free article] [PubMed] [Google Scholar]
- 41.Adams PD, Afonine PV, Bunkoczi G, Chen VB, Davis IW, Echols N, Headd JJ, Hung LW, Kapral GJ, Grosse-Kunstleve RW, McCoy AJ, Moriarty NW, Oeffner R, Read RJ, Richardson DC, Richardson JS, Terwilliger TC, Zwart PH. 2010. PHENIX: a comprehensive Python-based system for macromolecular structure solution. Acta Crystallogr D Biol Crystallogr 66:213–221. doi: 10.1107/S0907444909052925. [DOI] [PMC free article] [PubMed] [Google Scholar]
- 42.Chen VB, Arendall WB III, Headd JJ, Keedy DA, Immormino RM, Kapral GJ, Murray LW, Richardson JS, Richardson DC. 2010. MolProbity: all-atom structure validation for macromolecular crystallography. Acta Crystallogr D Biol Crystallogr 66:12–21. doi: 10.1107/S0907444909042073. [DOI] [PMC free article] [PubMed] [Google Scholar]
- 43.Pyrkov TV, Chugunov AO, Krylov NA, Nolde DE, Efremov RG. 2009. PLATINUM: a Web tool for analysis of hydrophobic/hydrophilic organization of biomolecular complexes. Bioinformatics 25:1201–1202. doi: 10.1093/bioinformatics/btp111. [DOI] [PubMed] [Google Scholar]


