Abstract
Aims
We aimed to study the differences in biventricular scar characterization using bipolar voltage mapping compared with state-of-the-art in vivo delayed gadolinium-enhanced cardiac magnetic resonance (LGE-CMR) imaging and ex vivo T1 mapping.
Methods and results
Ten pigs with established myocardial infarction (MI) underwent in vivo scar characterization using LGE-CMR imaging and high-density voltage mapping of both ventricles using a 3.5-mm tip catheter. Ex vivo post-contrast T1 mapping provided a high-resolution reference. Voltage maps were registered onto the left and right ventricular (LV and RV) endocardium, and epicardium of CMR-based geometries to compare voltage-derived scars with surface-projected 3D scars. Voltage-derived scar tissue of the LV endocardium and the epicardium resembled surface projections of 3D in vivo and ex vivo CMR-derived scars using 1-mm of surface projection distance. The thinner wall of the RV was especially sensitive to lower resolution in vivo LGE-CMR images, in which differences between normalized low bipolar voltage areas and CMR-derived scar areas did not decrease below a median of 8.84% [interquartile range (IQR) (3.58, 12.70%)]. Overall, voltage-derived scars and surface scar projections from in vivo LGE-CMR sequences showed larger normalized scar areas than high-resolution ex vivo images [12.87% (4.59, 27.15%), 18.51% (11.25, 24.61%), and 9.30% (3.84, 19.59%), respectively], despite having used optimized surface projection distances. Importantly, 43.02% (36.54, 48.72%) of voltage-derived scar areas from the LV endocardium were classified as non-enhanced healthy myocardium using ex vivo CMR imaging.
Conclusion
In vivo LGE-CMR sequences and high-density voltage mapping using a conventional linear catheter fail to provide accurate characterization of post-MI scar, limiting the specificity of voltage-based strategies and imaging-guided procedures.
Keywords: Magnetic resonance imaging, T1 mapping, Myocardial infarction, Voltage mapping, Myocardial substrate
What’s new?
High-density voltage mapping of both ventricles after established myocardial infarction correlates with surface scar projections obtained at ∼1 mm from the endocardial or epicardial border of accurate 3D in vivo and ex vivo cardiac magnetic resonance (CMR)-based reconstructions.
Bipolar voltage maps and state-of-the-art delayed gadolinium-enhanced CMR sequences in vivo fail to distinguish specific areas within low voltage territories that were identified as non-enhanced healthy myocardium using high-resolution T1 mapping.
The thinner wall of the right ventricle is especially sensitive to the lower resolution of in vivo CMR images, which is reflected by large differences between normalized voltage-derived scar areas and CMR-derived surface-projected scar areas.
The specificity of substrate-based strategies and imaging-guided procedures is affected by current standard resolutions of both bipolar voltage mapping using a 3.5-mm tip catheter and in vivo delayed gadolinium-enhanced CMR sequences.
Introduction
Scar characterization using different cardiac imaging modalities is a common clinical approach to stratify the risk of ventricular arrhythmia and identify potential target areas for catheter-based ablation after myocardial infarction (MI).1,2 Among such imaging techniques, delayed gadolinium-enhanced cardiac magnetic resonance (LGE-CMR) is a well-established method to characterize myocardial structural changes.3 Voltage mapping is another common approach to identify abnormal electrograms and low voltage areas that may be related to arrhythmogenesis.2,4
Both LGE-CMR imaging and voltage mapping approaches have intrinsic limitations that may affect structural substrate interpretation, and therefore substrate-guided therapeutic interventions. Scar and surviving tissue identification on LGE-CMR sequences are highly affected by current standards on LGE-CMR resolution, and the well-known influence of aliasing and partial volume effects.5 Moreover, no consensus exists on either a uniform scar evaluation technique or signal intensity thresholding for scar characterization,1,6 both of which vary among different series and makes scar characterization particularly sensitive to sampling bias depending on the specific approach. Thus, CMR-based scar characterization remains controversial and has not been incorporated as a standard tool to guide therapeutic interventions.4,7
Voltage-derived scar tissue using a conventional 4-mm tip mapping/ablation catheter and the established cut-off values for defining normal (>1.5 mV) and dense scar myocardium (<0.5 mV) also impose limitations on precise substrate characterization.4 Among other factors, fibre orientation, catheter contact, and fat significantly affect the represented scar.7,8 However, voltage mapping recordings and clinically available LGE-CMR sequences may provide complementary information and valuable clinical input if imaging interpretation is based on appropriate understanding of voltage and signal intensity limitations.
We hypothesize that in vivo LGE-CMR sequences and voltage mapping-derived scar tissue will have limitations, directly related to resolution technique, to identify surviving myocardial regions that can be identified using high-resolution T1 mapping. We compared the differences in scar characterization using 3D voltage maps vs. in vivo LGE-CMR and ex vivo post-contrast T1 mapping in a pig model of MI. We also aimed to optimize the interpretation of in vivo LGE-CMR sequences and voltage-derived maps of both ventricles using ex vivo T1 mapping as a high-resolution reference.
Methods
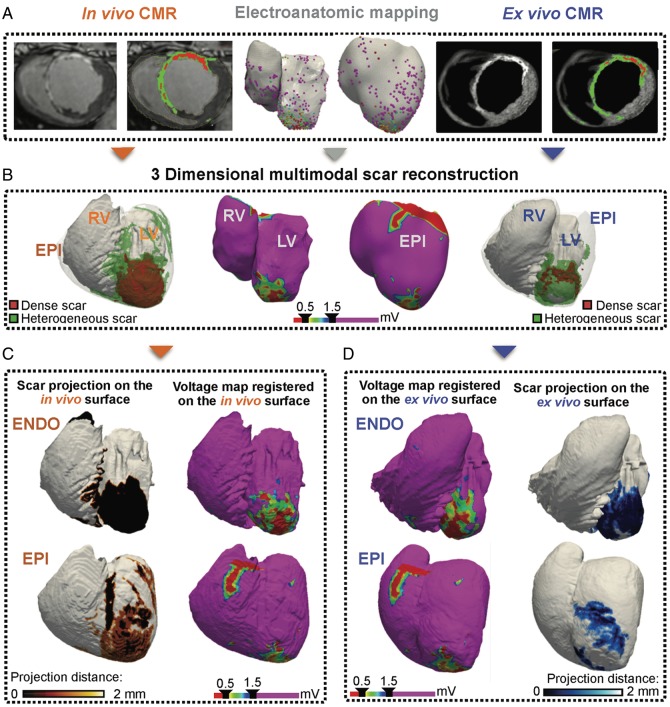
Detailed information of the methodology is provided in the Supplementary material online. Figure 1 summarizes the experimental workflow.
Pig model of myocardial infarction
The studies were conducted in accordance with institutional guidelines and National and European regulation guidelines for the care and use of laboratory animals. Ten castrated male pigs (large-white strain, ∼35 kg) underwent percutaneous catheterization of the left anterior descending (LAD) coronary artery using percutaneous femoral access and fluoroscopic guidance under general anaesthesia. Unfractionated heparin (300 UI/kg) was administered at the onset of the instrumentation. An angioplasty balloon was inflated either proximal (n = 5) or distal (n = 5) to the first diagonal branch to generate different infarct sizes and variable scar distributions. After 60 min of occlusion, the balloon was deflated, and a coronary angiogram was recorded to confirm patency of the coronary artery and reperfusion as described elsewhere.9 After 5 days of recovery, all animals were transferred to specific animal research facilities for 10–12 weeks before CMR studies and invasive cardiac electrophysiology characterization.
In vivo cardiac magnetic resonance imaging
One-to-three days before the electrophysiology study, all pigs (∼55 to 60 kg) underwent substrate characterization using a Philips Achieva 3T-Tx whole-body scanner equipped with a 32-element and phased array cardiac coil (Philips Healthcare, Best, The Netherlands). Ten minutes after intravenous contrast injection (0.2 mM/kg, Dotarem, Guerbet) 3D LGE sequences were acquired using an inversion recovery spoiled turbo field echo (IR-T1TFE) with isotropic resolution of 1.5 × 1.5 × 1.5 mm3.
Electrophysiology study and voltage-based substrate characterization
Anaesthesia induction and maintenance were the same as during the MI protocol. The study was performed using percutaneous venous and arterial femoral access to reach the right and left ventricles (RV, LV), respectively. Additional epicardial access was achieved using a subxiphoid percutaneous approach and an 8.5 Fr epicardial sheath (Agilis EPI 40 cm. St. Jude Medical Inc., St. Paul, MN, USA) positioned on the pericardial space. During sinus rhythm, voltage maps were sequentially generated from the endocardium of the LV, RV, and the epicardial surface of both ventricles using a 3.5-mm irrigated-tip mapping catheter (Navistar Thermocool, Biosense Webster, Diamond Bar, CA, USA) and a 3D electroanatomic mapping system (Carto3, Biosense Webster). Acquired bipolar signals were filtered at 30–500 Hz. Surface projection of acquired voltage data was set at 7 mm. Finally, a single intravenous bolus (0.2 mM/kg) of gadolinium-based contrast agent (Dotarem, Guerbet) was administered 10 min before euthanasia and heart excision.
Ex vivo cardiac magnetic resonance imaging
Right after euthanasia and heart excision, volume-preserved hearts were introduced in a custom-designed, watertight plastic flask containing 2% agarose gel that perfectly adjusted to an 8-channel phased array knee coil. A 3D T1 mapping sequence was acquired using a Look-Locker inversion recovery-turbo field echo sequence (repetition time/echo time/flip angle = 5.9 ms/2.8 ms/7°) with acquired isotropic resolution of 0.60 × 0.60 × 0.60 mm3. Thirty-six inversion times were acquired with a 147-ms gap between them.
Voltage maps processing
Bipolar signals were processed offline using custom-made software in Matlab (MathWorks Inc., Natick, MA, USA). Acquired bipolar electrograms were projected towards the electroanatomic mesh nodes using a minimum distance-based criterion. Data interpolation among nodes was performed using the inverse distance-weighted algorithm.10 Briefly, nodes with unknown data are assigned a weighted linear combination of the neighbouring data-filled nodes.
Processing of cardiac magnetic resonance images
Scar segmentation from ex vivo R1 images
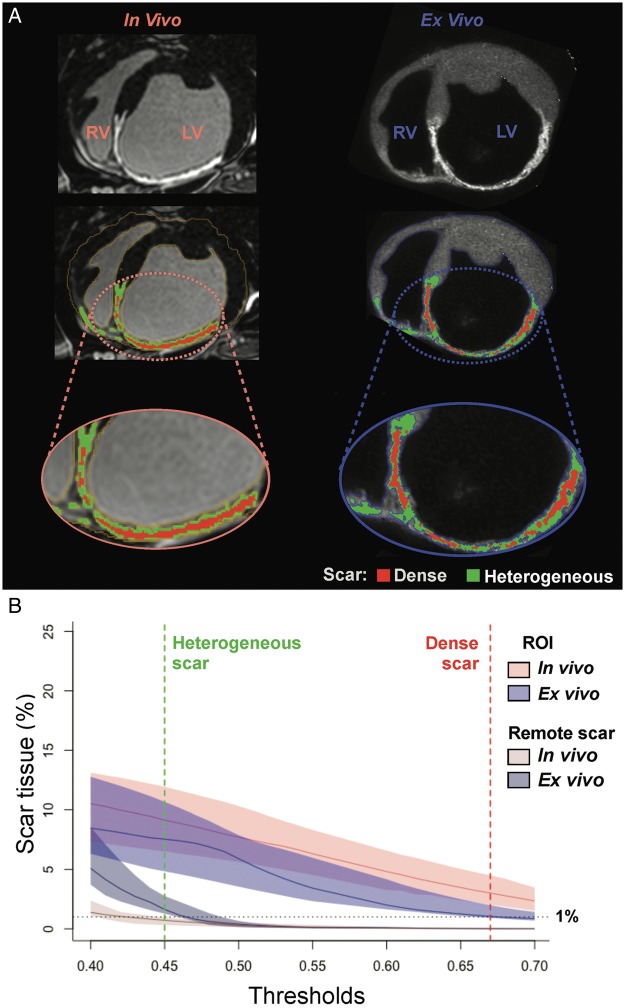
R1 images were calculated from the 36-inversion times of T1 images using a customized software (IDL 8.1, Boulder, CO, USA) as published elsewhere.11 Initial segmentation of the myocardium was performed semi-automatically using custom-made software in Matlab, complemented with fine manual segmentation (∼28 to 30 h per heart). Scar segmentation was performed using a modified strategy based on the full-width-half-maximum method to normalize signal intensity to maximum myocardial signal intensity (Supplementary material online, Figure S1).3 All cut-off values from 0.40 to 0.70 of the maximum signal intensity were evaluated to detect the most accurate scar delineation (Figure 2A,B).
Figure 2.
Myocardial and scar segmentation process. (A) Sample case of myocardial and scar segmentations from in vivo LGE-CMR images (left column) and ex vivo R1 images (right column). (B) Median (colour-coded lines) and interquartile range (colour-coded shadows) of normalized scar areas in each CMR slice at different signal intensity thresholds for in vivo and ex vivo images. Remote scar tissue (outside the infarct region), especially in ex vivo images, rapidly decreased from 0.40 to 0.45 cut-points of maximum signal intensity, which indicated the presence of false positive scar tissue and aided to establish the appropriate cut-off value for scar tissue. LV, left ventricle; ROI, region of interest; RV, right ventricle.
Figure 1.
Experimental workflow. (A) In vivo and ex vivo imaging modalities for biventricular scar characterization. (B) 3D scar reconstructions obtained from each imaging modality. (C, D) Surface scar projections on the in vivo (C) and ex vivo (D) CMR-based geometries, and voltage-derived maps registered onto the endocardial and epicardial CMR geometries for comparisons. CMR, cardiac magnetic resonance; ENDO, endocardium; EPI, epicardium; LV, left ventricle; RV, right ventricle.
Scar segmentation from in vivo LGE-cardiac magnetic resonance images
Similarly, to ex vivo sequences, initial segmentation of the myocardium was performed semi-automatically using custom-made software in Matlab, although a longer time was required for fine manual segmentation (∼48 h per heart). Then, scar segmentation was performed using the same criteria as for ex vivo images without applying any filtering among neighbouring voxels.
Surface projection of 3D scar regions
Surface scar projection was performed using distance-to-scar maps that were computed from the segmented ventricular myocardium. The maps were generated with a mathematical tool based on eikonal equations to calculate scar distances to a given surface (Supplementary material online, Figure S2).12 Two types of surface maps were generated for each myocardial territory (LV endocardium, RV endocardium, and epicardium) to differentiate between dense and heterogeneous scar areas.
Voltage maps registration onto cardiac magnetic resonance geometries
Each myocardial territory was registered onto the corresponding in vivo and ex vivo CMR geometries. The method consisted of an initial registration of anatomical landmarks manually depicted on each voltage and CMR surface. Then, an iterative closest point algorithm was applied to the resulting surfaces using a rigid transformation method (Supplementary material online, Figure S3).13 Finally, bipolar voltage data were integrated on the corresponding endocardial or epicardial CMR geometries using the minimum distance criterion.
Scar quantification and statistical analysis
We quantified the voltage-derived scar areas after registration on the corresponding in vivo and ex vivo CMR surfaces and used a linear interpolation method to define scar and healthy regions based on conventional bipolar thresholds (dense scar: <0.5 mV, heterogeneous scar: 0.5–1.5 mV as low voltage regions, and healthy myocardium: >1.5 mV).4 Using the Pearson correlation coefficient, we calculated the correlation between low bipolar voltage areas on the original electroanatomic meshes, and such scars registered onto the CMR geometries. The Passing–Bablok regression was used to detect any significant difference after registration of voltage maps. Comparisons were performed between registered voltage-derived scars and in vivo or ex vivo 3D surface scar projections. Normalized scar tissue was calculated as the percentage of scar on the registered in vivo or ex vivo CMR surface. Differences in scar areas are expressed as absolute values. Low voltage areas on the electroanatomic maps corresponding to valvular annuli were not considered for comparisons with surface scar projections from CMR images. Data are expressed as median and interquartile range (IQR) for quantitative variables. Data normality was assessed with the Shapiro–Wilk test.
Results
Table 1 lists the resolution differences and geometry areas obtained from each imaging technique. It shows also the number of geometry points generated to construct the voltage maps, the voltage acquisition points for each territory, and the acquisition times.
Table 1.
Characteristics of each imaging technique
| Voltage mapping | In vivo CMR | Ex vivo CMR | |
|---|---|---|---|
| Technique resolution (mm) | Catheter tip-ring: 3.5-1 | ||
| Acquisition | 1.50 × 1.50 × 1.50 | 0.60 × 0.60 × 0.60 | |
| Reconstruction | 0.57 × 0.57 × 0.75 | 0.45 × 0.45 × 0.45 | |
| Geometry areas (cm2) | |||
| LV endocardium | 169.50 (163.00, 182.80) | 157.00 (143.00, 166.20) | 149.50 (130.20, 176.00) |
| RV endocardium | 141.50 (137.80, 153.00) | 139.00 (124.20, 147.80) | 167.50 (144.20, 187.50) |
| Epicardium | 203.00 (186.00, 213.20) | 253.50 (232.00, 274.50) | 258.00 (137.0, 292.50) |
| Geometry points | |||
| LV endocardium | 3043 (2922, 3840) | – | – |
| RV endocardium | 3220 (3018, 3574) | – | – |
| Epicardium | 14 951 (14 014, 16 000) | – | – |
| Voltage acquisition points | |||
| LV endocardium | 1123 (1064, 1172) | – | – |
| RV endocardium | 370 (324, 407) | – | – |
| Epicardium | 1112 (1059, 1218) | – | – |
| Acquisition time (min) | 167 (149, 191) | 10 | 50 |
Data are expressed as median (in bold type) and interquartile range.
CMR, cardiac magnetic resonance; LV, left ventricle; RV, right ventricle.
Dense scar voltage criterion affects substrate characterization
Using a conventional cut-off criterion for dense scar (<0.5 mV) resulted in 5.09% (2.97, 9.86) of the LV endocardium being classified as potentially non-viable myocardium (Supplementary material online, Figure S4A). A similar percentage of the epicardium was classified as dense scar tissue on the epicardial surface [5.27% (1.34, 6.98%), Supplementary material online, Figure S4A]. However, in the RV endocardium, the percentage of dense scar tissue was substantially lower [0.36% (0.07, 0.74%), Supplementary material online, Figure S4A]. Therefore, the infarct territory mainly affected the LV. Decreasing the dense scar cut-off to ≤0.1 mV has been suggested to be more specific to detect unexcitable areas.7 However, the change considerably decreased dense scar tissue in both the LV endocardium [0.17% (0.00002, 0.65%)] and the epicardium [0.025% (0.0002, 0.08%)] (Supplementary material online, Figure S4B). Scar changes in the RV endocardium were negligible due to small areas of very low voltage (≤0.1 mV) with both criteria (Supplementary material online, Figure S4B).
Voltage map registration on cardiac magnetic resonance surfaces preserves scar distribution
Total scar quantification after voltage maps registration on the in vivo or ex vivo CMR geometries (RV endocardium, LV endocardium, and epicardium) strongly correlated with the voltage-derived scar areas obtained on the electroanatomic meshes. R2 values of the Pearson correlation coefficient were 0.94 and 0.94 for in vivo and ex vivo registrations, respectively (Supplementary material online, Figure S5). Quantification of registered and normalized voltage-derived scar tissue on the in vivo and ex vivo CMR geometries showed a median of 2.3% and 2.0% absolute difference, respectively, without statistical significance from the original voltage-derived scars on the electroanatomic geometry (Supplementary material online, Figure S6).
Comparisons of low bipolar voltage areas with surface scar projections from cardiac magnetic resonance
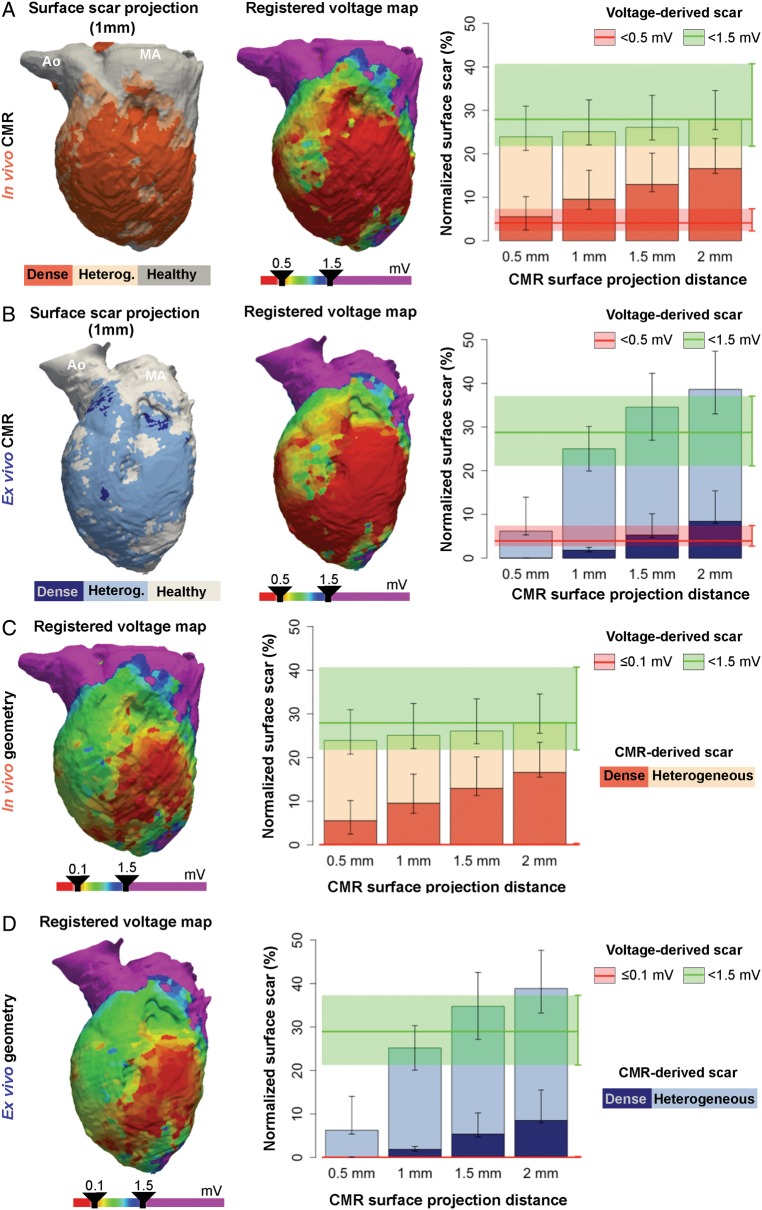
Conventional low voltage maps of the LV endocardium started to resemble heterogeneous and dense scar areas from in vivo LGE-CMR at the minimum evaluated (0.5 mm) surface projection distance (Figure 3A). However, scar regions from ex vivo high-resolution CMR images required larger surface projection distances (∼1.0 mm) to resemble voltage-derived scar areas (Figure 3B). The data indicate that high-resolution and fine-segmented CMR sequences may potentially distinguish thin surviving endocardial layers, just a few hundred micrometre thick,14 which could not be detected using lower resolution techniques. Further analysis supported this assertion since 24.95% (18.92, 36.86%) and 43.02% (36.54, 48.72%) of voltage-derived scar areas in the left ventricular endocardium were classified as non-enhanced healthy myocardium using in vivo LGE-CMR and ex vivo post-contrast T1 mapping, respectively (Supplementary material online, Figure S7).
Figure 3.
Left ventricular scar comparisons between registered voltage maps and CMR images. (A, B, left panel) Representative case of surface scar projections from in vivo (A) and ex vivo (B) CMR images, and registered voltage maps (middle-panel) using a very low voltage cut-off <0.5 mV onto the left ventricular geometries. On the right, surface scar projections of dense and heterogeneous scars at different projection distances from the endocardial border of in vivo (A) and ex vivo (B) CMR images. The median (red and green lines) and interquartile range (red and green shadows) of registered very low and low voltage-derived scars (<0.5 mV and <1.5 mV, respectively) are also represented. (C, D, left panel) Same representative registered voltage maps as in A (in vivo geometry), B (ex vivo geometry), using a very low voltage cut-off ≤0.1 mV. On the right, same data as in A, B using the ≤0.1 mV cut-off criterion for very low voltage-derived scars. Right panels show data from the entire group of animals (n = 10). Ao, aorta; CMR, cardiac magnetic resonance; MA, mitral annulus.
Adjusting voltage criteria for dense scar tissue to ≤0.1 mV dramatically decreased voltage-derived dense scar areas (Figure 3C). As a result, neither in vivo nor ex vivo CMR-derived scar areas resembled such small voltage-derived dense scar areas at any of the projection distances (Figure 3C,D).
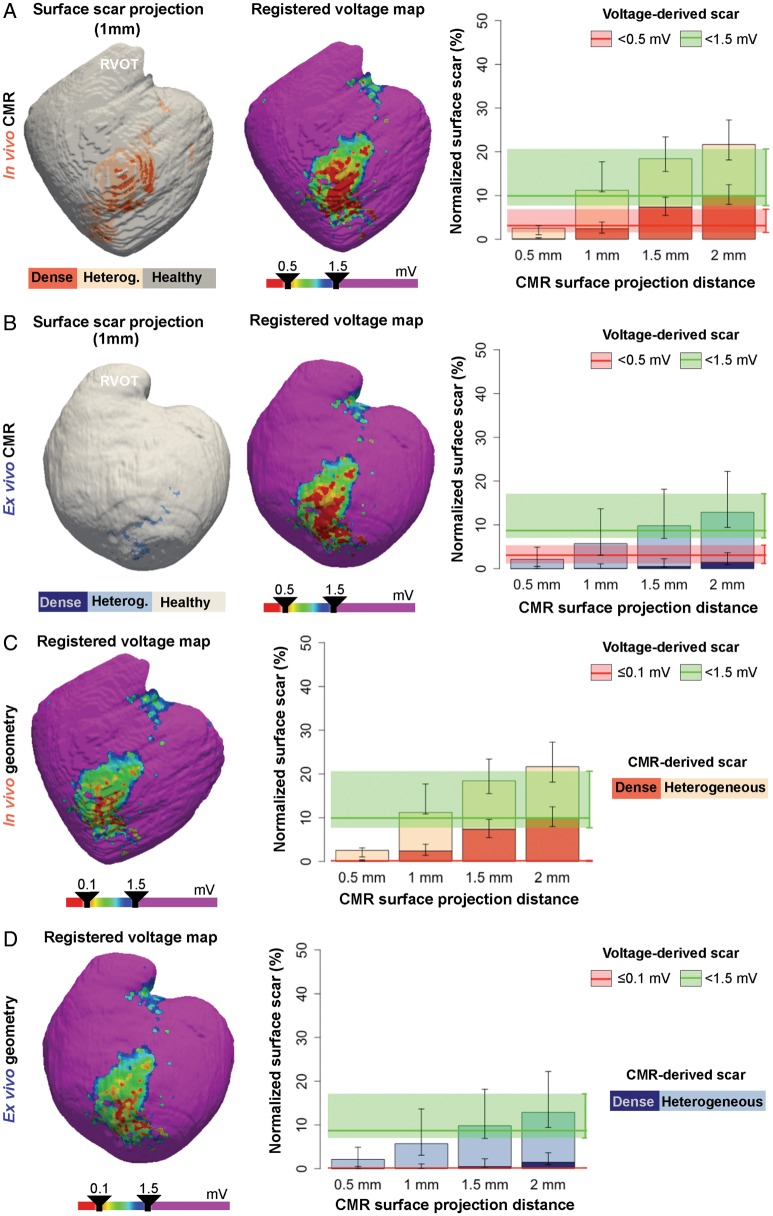
Epicardial scar areas from in vivo and ex vivo CMR images showed similar patterns, with progressively larger heterogeneous and dense scar areas as the surface projection distance increased (Figure 4A,B). Thus, the epicardium of in vivo and ex vivo CMR images showed small scar areas at 0.5 mm of surface projection distance [normalized scar: 2.53% (1.04, 3.11%) and 2.12 (0.48, 4.89%), respectively] compared with voltage-derived epicardial scar areas [9.93% (7.70%, 20.63%), and 8.70% (7.01, 17.11%) for normalized in vivo and ex vivo voltage map registrations, respectively, Figure 4A,B]. The latter highlights the potential effect of fat on epicardial voltage amplitudes,8 which was minimized in fine epicardial segmentations, especially from ex vivo high-resolution sequences (Figure 4A). Decreasing the dense scar cut-off to ≤0.1 mV almost eliminated the entire epicardial voltage-derived dense scar, (Figure 4C,D) similarly to the effect observed in the LV endocardium (Figure 3C,D).
Figure 4.
Epicardial scar comparisons between registered voltage maps and CMR images. (A, B, left panel) Representative case of surface scar projections from in vivo (A) and ex vivo (B) CMR images, and registered voltage maps (middle-panel) using a very low voltage cut-off <0.5 mV onto the epicardial geometries. On the right, surface scar projections of dense and heterogeneous scars at different projection distances from the epicardial border of in vivo (A) and ex vivo (B) CMR images. The median (red and green lines) and interquartile range (red and green shadows) of registered very low and low voltage-derived scars (<0.5 mV and <1.5 mV, respectively) are also represented. (C, D, left panel) Same representative registered voltage maps as in A (in vivo geometry), B (ex vivo geometry), using a very low voltage cut-off ≤0.1 mV. On the right, same data as in A, B using the ≤0.1 mV cut-off criterion for very low voltage-derived scars. Right panels show data from the entire group of animals (n = 10). CMR, cardiac magnetic resonance; RVOT, right ventricular outflow tract.
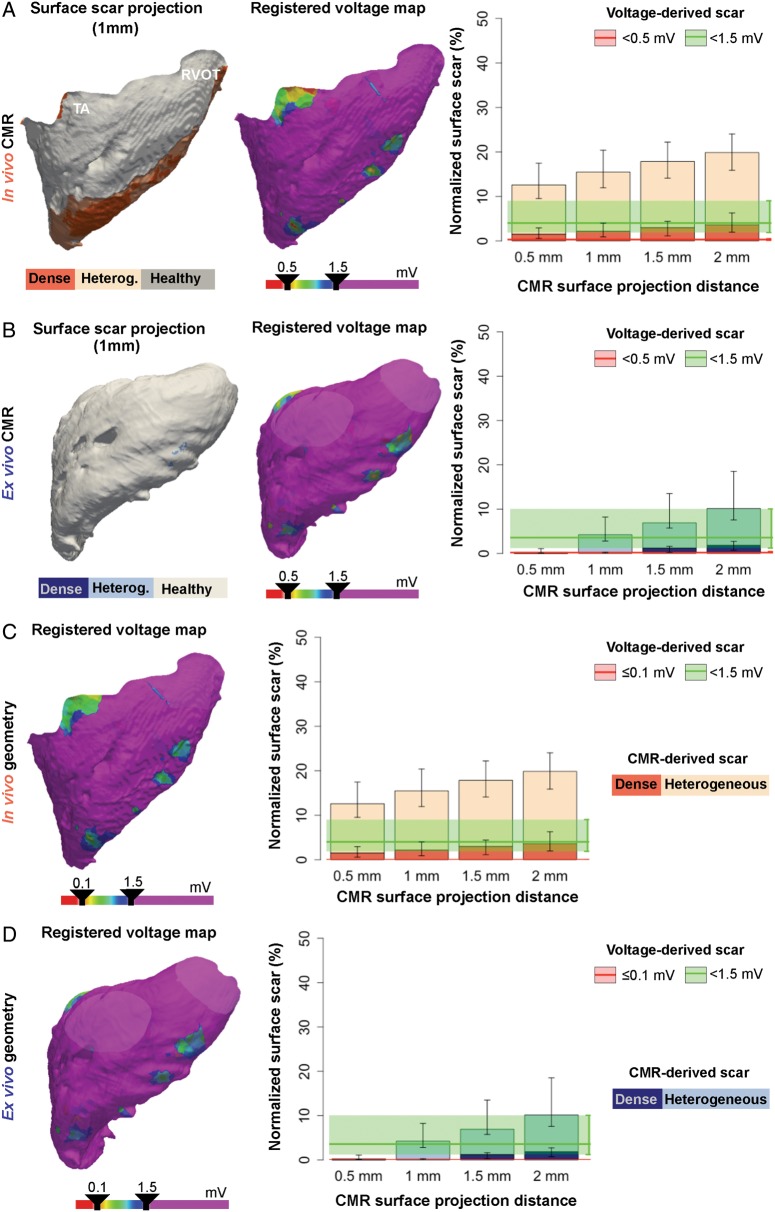
The much thinner RV wall showed a different scenario, in which endocardial voltage-derived scar areas were consistently smaller than in vivo CMR-derived scar areas at all the surface projection distances (Figure 5A). Scar comparisons using ex vivo high-resolution images showed that RV voltage maps resembled CMR-derived scar areas at 1 mm of surface projection distance (Figure 5B). Decreasing the dense scar cut-off from <0.5 mV to ≤0.1 mV did not affect comparisons, since changes in normalized voltage-derived dense scar areas were negligible (Figure 5C,D).
Figure 5.
Right ventricular scar comparisons between registered voltage maps and CMR images. (A, B, left panel) Representative case of surface scar projections from in vivo (A) and ex vivo (B) CMR images, and registered voltage maps (mid-panel) using a very low voltage cut-off <0.5 mV onto the right ventricular geometries. On the right, surface scar projections of dense and heterogeneous scars at different projection distances from the endocardial border of in vivo (A) and ex vivo (B) CMR images. The median (red and green lines) and interquartile range (red and green shadows) of registered very low and low voltage-derived scars (<0.5 mV and <1.5 mV, respectively) are also represented. (C, D, left panel) Same representative registered voltage maps as in A (in vivo geometry), B (ex vivo geometry), using a very low voltage cut-off ≤0.1 mV. On the right, same data as in A, B using the ≤0.1 mV cut-off criterion for very low voltage-derived scars. Right panels show data from the entire group of animals (n = 10). CMR, cardiac magnetic resonance; RVOT, right ventricular outflow tract; TA, tricuspid annulus.
Biventricular scar interpretation using bipolar voltage mapping and cardiac magnetic resonance imaging
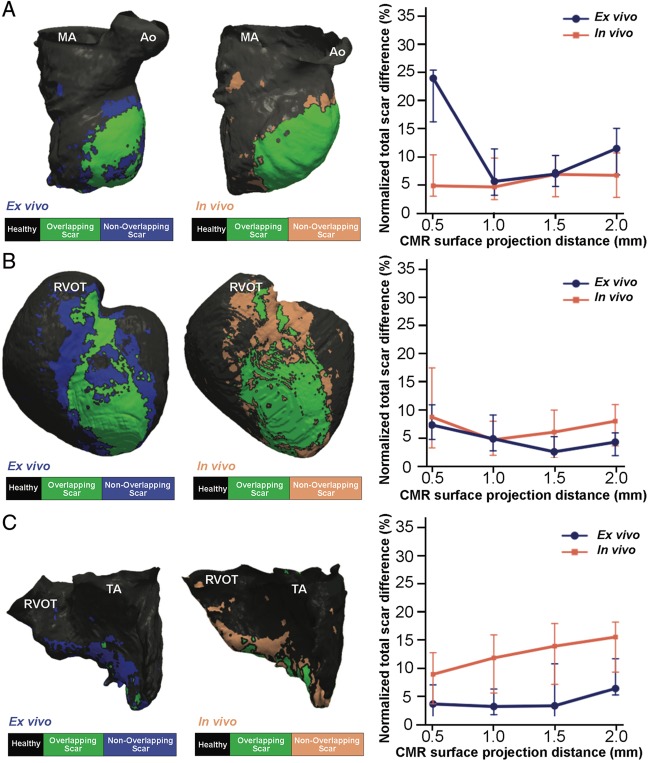
Normalized total scar areas from in vivo and ex vivo CMR sequences at the 1 mm surface projection distance showed the minimum difference (range 4.0–5.1%) compared with voltage-derived scar areas either from the LV endocardium or the epicardium (Figure 6A,B). Voltage-derived scar areas from the RV were also consistent with the 1 mm surface projection distance using ex vivo CMR images [normalized difference 3.10% (1.65, 6.24%), Figure 6C]. However, the optimal correlation of voltage-derived RV scar areas using lower resolution images from in vivo LGE-CMR was documented at the minimum (0.5 mm) evaluated surface projection distance [normalized difference 8.84% (3.58, 12.70%), Figure 6C].
Figure 6.
Scar differences among registered voltage maps and CMR images at different surface projection distances. (A–C, left panels) Overlapping scar regions (in green) between registered voltage maps onto the in vivo and ex vivo CMR geometries (A, LV; B, epicardium; C, RV) and CMR-derived scars. No overlapping scar regions, either voltage-derived or CMR-derived, are shown in blue. Right panels show normalized total scar differences (|voltage-derived scar – surface-projected CMR scar|/LV, RV, or epicardial surface) using sequential surface projection distances from in vivo and ex vivo CMR images. CMR, cardiac magnetic resonance; LV, left ventricle; RV, right ventricle. Ao, aorta; CMR, cardiac magnetic resonance; MA, mitral annulus; RVOT, right ventricular outflow tract; TA, tricuspid annulus.
A similar interpretation was also valid for normalized dense scar areas using 0.5 mV as voltage cut-off (Supplementary material online, Figure S8). The 0.5 mm surface projection distance using in vivo LGE-CMR images showed a slightly smaller difference [4.25% (1.32, 4.63%)] than the 1 mm criterion [9.23% (6.14, 9.82%)] compared with voltage-derived dense scar areas from the LV endocardium.
Overall, biventricular voltage-derived scar areas and surface scar projections from in vivo LGE-CMR sequences showed larger normalized scar areas than ex vivo T1 mapping images [12.87% (4.59, 27.15%), 18.51% (11.25, 24.61%), and 9.30% (3.84, 19.59%), respectively], despite using 1-mm distance for surface projection of CMR-derived scar areas.
Discussion
We characterized the voltage-derived MI scar of the entire ventricles using bipolar recordings and a conventional mapping/ablation catheter. The voltage maps correlated with surface scar projections from in vivo and ex vivo CMR sequences at ∼1 mm from the endocardial or epicardial borders. Overall, normalized scar differences among techniques were ∼5% using the optimal surface projection distance from CMR sequences. Bipolar recordings provided average information of ∼1-mm deep of the mapped territories, which failed to distinguish specific regions within low voltage territories that could be identified as non-enhanced healthy myocardium using high-resolution images. In vivo LGE-CMR sequences showed larger scar areas than ex vivo high-resolution sequences at surface projection distances <1 mm, which demonstrates that partial volume limitations affect lower resolution images, especially in the thinner wall of the RV.
Substrate characterization after MI has been used to guide therapeutic interventions as catheter-based ablation of ventricular tachycardia.1,15 Substrate-based procedures are commonly characterized by long radiofrequency delivery times and large ablated areas,15 which may achieve lower recurrence rates during follow-up compared with a more conservative approach.15 However, our results indicate that bipolar voltage mapping using a conventional mapping/ablation catheter lacks specificity for detailed scar characterization. Thus, potentially surviving endocardial layers within low voltage areas of the LV endocardium would be classified as scar, even though high-resolution images would identify them as non-enhanced healthy myocardium. Mapping resolution can be increased using multipolar catheters with smaller electrodes size,16 which reduces the estimated scar extension and identifies regions of viable myocardium within very low voltage areas. However, estimated scar extensions using multipolar catheters and 1-mm electrodes may still provide slightly larger scar areas than ex vivo CMR studies focused on the LV endocardium.16 Moreover, voltage mapping is not the only criterion to identify abnormal substrates, as electrogram morphology is also affected by catheter electrode size.7 Thus, multipolar catheters with smaller electrodes may show healthy looking, sharp, and high-voltage electrograms in regions where larger electrode sizes show overt abnormal electrograms.16
In vivo, LGE-CMR has been used also to identify the abnormal substrate and conduction channels based on signal intensity criteria.1,17 However, our results demonstrate that even state-of-the-art in vivo 3D sequences are limited in the ability to identify areas of normal tissue within heterogeneous or dense scar areas. The latter is reflected by the larger normalized scar regions estimated from in vivo sequences at surface projection distances <1 mm compared with ex vivo CMR-derived scar areas. Such differences are related to larger partial volume effects in lower resolution images,5 which become even more relevant in thinner structures such as the RV wall (Figure 5). Importantly, scar areas quantification using two different techniques may resemble each other at surface projection distances closer to in vivo CMR resolutions and electrode size resolutions. However, this does not mean that the underlying complex substrate can be properly identified as demonstrated with higher resolution ex vivo sequences. Moreover, substrate characterization using LGE-CMR images is also affected by signal intensity thresholding, which varies among series and there is a lack of uniform consensus on the methodology to classify scar tissue.1,6,17 Therefore, tissue classification as healthy, heterogeneous, or dense scar is particularly sensitive to sampling bias, which would substantially change imaging interpretation of viable tissue and potential conduction channels within scar areas. Altogether the foregoing explains why CMR-based scar tissue characterization remains controversial and has not been incorporated as a standard tool to guide ablation in clinical practice.18 We have minimized such imaging limitations using highly precise and time-consuming (∼28 to 48 h) whole heart myocardial segmentations along with comprehensive characterization of signal intensity thresholdings from in vivo and ex vivo sequences before selecting specific criteria (Figure 2). The latter enabled us to understand not only frequently obtained results using different imaging approaches, but more importantly specific technical limitations that may affect clinical interpretation.
Despite limitations, clinical substrate-based ablation procedures may benefit from incorporating CMR-derived 3D reconstructions of patient-specific infarct-related substrates in electroanatomic mapping systems. Importantly, surface scar projections should be obtained after accurate myocardial segmentation using the 1-mm distance criterion. The latter will aid cardiac electrophysiologists to localize the region of interest (e.g. endocardium or epicardium) and plan the procedure accordingly. Imaging data in combination with bipolar voltage mapping using multipolar catheters with small electrodes size (0.4–1 mm) will substantially improve substrate characterization within the infarct territory.16 However, other details like identification of potential ventricular tachycardia channels based on relatively large and manual variations in signal intensity thresholds for scar characterization,1 will be sensitive to lack of specificity.
Substrate characterization and 3D patient-/animal-specific reconstructions have been also used to generate computational models aiming at predicting arrhythmia risk or target areas during ventricular tachycardia ablation.19 In such models scar segmentation and tissue characterization are crucial steps, since electrophysiological properties assigned to healthy, dense scar, or heterogeneous scar regions will be substantially different.19 In fact, the morphology and size of the heterogeneous scar areas have been described as the main determinants of 3D re-entrant locations and the number of potential re-entrant sources.19,20 Therefore, current LGE-CMR sequences may have important limitations to accurately reconstruct patient-specific substrates, specially using 2D sequences and low resolution acquisitions,19 which are more sensitive to partial volume effects.5 The latter would theoretically affect the computational scenarios; therefore any related potential therapeutic strategy. Such weaknesses notwithstanding, CMR technology is rapidly improving and soon will probably allow for briefer acquisition times and higher resolution sequences, which will also improve the performance and clinical value of computational models.
Limitations
Histopathology analyses were not performed to confirm the presence of viable myocardial tracts within voltage-derived dense scar regions. However, it is not surprising to observe that small layers of viable myocardium would not be detected with low resolution techniques (i.e. bipolar mapping using a 3.5-mm tip catheter or in vivo LGE-CMR) compared with high-resolution ex vivo CMR imaging or multipolar catheters with small electrodes size.5,16 Relatively large areas of epicardial fat are common in patients with structural heart disease,8 while in the pig model such areas were mainly limited to the interventricular course of the LAD coronary artery (Figure 6B). Lower epicardial fat content may have favoured epicardial substrate characterization using in vivo LGE-CMR compared with other scenarios in the presence of larger fatty areas. Cardiac magnetic resonance sequences using fat suppression or computed tomography studies can provide additional value to increase CMR-based scar characterization in the epicardium.8
Although ex vivo CMR studies provided detailed characterization of the underlying ventricular scar tissue after MI, the sequences may still have limitations in thinner myocardial walls such as the atria. Therefore, future studies should address the optimal resolutions during acquisition to achieve consistent and comparable results among series aiming to study the atrial walls.
Conclusions
Current state-of-the-art in vivo LGE-CMR sequences and high-density catheter-based voltage mapping using standard linear mapping/ablation catheters show limitations to provide detailed characterization of post-MI scar tissue compared with high-resolution ex vivo post-contrast T1 mapping. The latter has implications on substrate-based strategies and imaging-guided procedures, which may reflect the lack of specificity.
Supplementary Material
Acknowledgements
We thank the technical support of all staff members at the animal facilities in CNIC.
Funding
The CNIC (Madrid, Spain) is supported by the Ministry of Economy, Industry and Competitiveness (MEIC) and the Pro CNIC Foundation; The CNIC and the BSC (Barcelona, Spain) are Severo Ochoa Centers of Excellence (SEV-2015-0505 and SEV-2011-0067, respectively); Instituto de Salud Carlos III, Fondo Europeo de Desarrollo Regional (RD12/0042/0036, CB16/11/00458), Spanish Ministry of Economy and Competitiveness (MINECO) (SAF2016-80324-R, PI16/02110, and DTS17/00136), and by the European Commission [ERA-CVD Joint Call (JTC2016/APCIN-ISCIII-2016), Grant no. AC16/00021]; Fundación Interhospitalaria para la Investigación Cardiovascular (FIC, Madrid, Spain) and the heart rhyhtm section of the Spanish Society of Cardiology (DFR), in part; R01 Grant HL122352 from the National Heart Lung and Blood Institute, USA, National Institutes of Health to J.J.; CompBioMed project, H2020-EU.1.4.1.3 European Union’s Horizon 2020 research and innovation program, (Grant no. 675451 to J.A.-S.); D.G.L. has received financial support through the ‘la Caixa’ Fellowship Grant for Doctoral Studies, ‘la Caixa’ Banking Foundation, Barcelona, Spain.
Conflict of interest: none declared.
References
- 1. Andreu D, Penela D, Acosta J, Fernandez-Armenta J, Perea RJ, Soto-Iglesias D. et al. Cardiac magnetic resonance-aided scar dechanneling: influence on acute and long-term outcomes. Heart Rhythm 2017;14:1121.. [DOI] [PubMed] [Google Scholar]
- 2. Nuhrich JM, Kaiser L, Akbulak RO, Schaffer BN, Eickholt C, Schwarzl M. et al. Substrate characterization and catheter ablation in patients with scar-related ventricular tachycardia using ultra high-density 3-D mapping. J Cardiovasc Electrophysiol 2017;28:1058–67. [DOI] [PubMed] [Google Scholar]
- 3. Amado LC, Gerber BL, Gupta SN, Rettmann DW, Szarf G, Schock R. et al. Accurate and objective infarct sizing by contrast-enhanced magnetic resonance imaging in a canine myocardial infarction model. J Am Coll Cardiol 2004;44:2383–9. [DOI] [PubMed] [Google Scholar]
- 4. Santangeli P, Marchlinski FE.. Substrate mapping for unstable ventricular tachycardia. Heart Rhythm 2016;13:569–83. [DOI] [PubMed] [Google Scholar]
- 5. Schuleri KH, Centola M, George RT, Amado LC, Evers KS, Kitagawa K. et al. Characterization of peri-infarct zone heterogeneity by contrast-enhanced multidetector computed tomography: a comparison with magnetic resonance imaging. J Am Coll Cardiol 2009;53:1699–707. [DOI] [PMC free article] [PubMed] [Google Scholar]
- 6. Flett AS, Hasleton J, Cook C, Hausenloy D, Quarta G, Ariti C. et al. Evaluation of techniques for the quantification of myocardial scar of differing etiology using cardiac magnetic resonance. JACC Cardiovasc Imaging 2011;4:150–6. [DOI] [PubMed] [Google Scholar]
- 7. Josephson ME, Anter E.. Substrate mapping for ventricular tachycardia assumptions and misconceptions. JACC Clin Electrophysiol 2015;1:341–52. [DOI] [PubMed] [Google Scholar]
- 8. Piers SR, van Huls van Taxis CF, Tao Q, van der Geest RJ, Askar SF, Siebelink HM. et al. Epicardial substrate mapping for ventricular tachycardia ablation in patients with non-ischaemic cardiomyopathy: a new algorithm to differentiate between scar and viable myocardium developed by simultaneous integration of computed tomography and contrast-enhanced magnetic resonance imaging. Eur Heart J 2013;34:586–96. [DOI] [PubMed] [Google Scholar]
- 9. Fernandez-Jimenez R, Sanchez-Gonzalez J, Aguero J, Garcia-Prieto J, Lopez-Martin GJ, Garcia-Ruiz JM. et al. Myocardial edema after ischemia/reperfusion is not stable and follows a bimodal pattern: imaging and histological tissue characterization. J Am Coll Cardiol 2015;65:315–23. [DOI] [PubMed] [Google Scholar]
- 10. Lloyd CD. Assessing the effect of integrating elevation data into the estimation of monthly precipitation in Great Britain. J Hydrol 2005;308:128–50. [Google Scholar]
- 11. Messroghli DR, Radjenovic A, Kozerke S, Higgins DM, Sivananthan MU, Ridgway JP.. Modified Look-Locker inversion recovery (MOLLI) for high-resolution T1 mapping of the heart. Magn Reson Med 2004;52:141–6. [DOI] [PubMed] [Google Scholar]
- 12. Sethian JA. A fast marching level set method for monotonically advancing fronts. Proc Natl Acad Sci USA 1996;93:1591–5. [DOI] [PMC free article] [PubMed] [Google Scholar]
- 13. Besl PJ, McKay ND.. A method for registration of 3-D shapes. IEEE Trans Pattern Anal Mach Intell 1992;14:239–56. [Google Scholar]
- 14. Tschabrunn CM, Roujol S, Nezafat R, Faulkner-Jones B, Buxton AE, Josephson ME. et al. A swine model of infarct-related reentrant ventricular tachycardia: electroanatomic, magnetic resonance, and histopathological characterization. Heart Rhythm 2016;13:262–73. [DOI] [PMC free article] [PubMed] [Google Scholar]
- 15. Di Biase L, Santangeli P, Burkhardt DJ, Bai R, Mohanty P, Carbucicchio C. et al. Endo-epicardial homogenization of the scar versus limited substrate ablation for the treatment of electrical storms in patients with ischemic cardiomyopathy. J Am Coll Cardiol 2012;60:132–41. [DOI] [PubMed] [Google Scholar]
- 16. Tschabrunn CM, Roujol S, Dorman NC, Nezafat R, Josephson ME, Anter E.. High-resolution mapping of ventricular scar: comparison between single. Circ Arrhythm Electrophysiol 2016;9:e003841.. [DOI] [PMC free article] [PubMed] [Google Scholar]
- 17. Perez-David E, Arenal A, Rubio-Guivernau JL, del Castillo R, Atea L, Arbelo E. et al. Noninvasive identification of ventricular tachycardia-related conducting channels using contrast-enhanced magnetic resonance imaging in patients with chronic myocardial infarction: comparison of signal intensity scar mapping and endocardial voltage mapping. J Am Coll Cardiol 2011;57:184–94. [DOI] [PubMed] [Google Scholar]
- 18. Al-Khatib SM, Stevenson WG, Ackerman MJ, Bryant WJ, Callans DJ, Curtis AB. et al. AHA/ACC/HRS guideline for management of patients with ventricular arrhythmias and the prevention of sudden cardiac death: executive summary: a report of the American College of Cardiology/American Heart Association Task Force on Clinical Practice Guidelines and the Heart Rhythm Society. Circulation 2017. Oct 30. pii: CIR.0000000000000548. [Google Scholar]
- 19. Arevalo HJ, Vadakkumpadan F, Guallar E, Jebb A, Malamas P, Wu KC. et al. Arrhythmia risk stratification of patients after myocardial infarction using personalized heart models. Nat Commun 2016;7:11437.. [DOI] [PMC free article] [PubMed] [Google Scholar]
- 20. Ringenberg J, Deo M, Filgueiras-Rama D, Pizarro G, Ibanez B, Peinado R. et al. Effects of fibrosis morphology on reentrant ventricular tachycardia inducibility and simulation fidelity in patient-derived models. Clin Med Insights Cardiol 2014;8:1–13. [DOI] [PMC free article] [PubMed] [Google Scholar]
Associated Data
This section collects any data citations, data availability statements, or supplementary materials included in this article.


