

Summary
Monocytic leukemia zinc-finger protein (MOZ) has been found to form fusion proteins with many regulators in acute myeloid leukemia (AML). However, the molecular functions and underlying mechanism of MOZ in AML is not well understood. Here, clinical MOZ expression analysis combined with data integration from the TCGA and GEO databases indicated that a low level of MOZ was associated with poor prognosis. MOZ knockdown inhibited monocyte differentiation and increased resistance to chemotherapeutic drug-induced apoptosis in THP-1 or U937 cells. In addition, we found that genetic silencing of MOZ suppressed AP-1 and AKT activity in the context of lipopolysaccharide stimulation, resulting in diminished M1 activation of macrophages. We further showed that MOZ was a validated target of miR-223 and functioned as a repressor of miR-223 expression. Our study indicates that a molecular network involving MOZ and miR-223 contributes to the monocyte differentiation and polarization program, which is deregulated in AML.
Subject Areas: Biological Sciences, Molecular Biology, Molecular Mechanism of Gene Regulation
Graphical Abstract
Highlights
-
•
Low MOZ is associated with poor prognosis in patients with AML
-
•
Silencing of MOZ makes AML cells exhibit “stem-like” characters
-
•
MOZ promotes monocyte-to-macrophage development and M1 polarization
-
•
MOZ is a direct target of miR-223 and functions as a repressor of miR-223
Biological Sciences; Molecular Biology; Molecular Mechanism of Gene Regulation
Introduction
Monocytes that originate from hematopoietic stem cells in the bone marrow have been considered the systemic reservoir of myeloid precursors for the renewal of macrophages and dendritic cells (DCs) (Iwasaki and Akashi, 2007). Numerous master regulators, including PU.1, C/EBPα, FLT3, and miR-223, have been reported to participate in monocyte differentiation (Friedman, 2007, Gilicze et al., 2014). However, somatic mutation or genetic variation of these master regulators in monocytes often causes hyperplasia and blocks cellular differentiation, resulting in the clinical entity acute monocytic leukemia (AMoL) (Palmisano et al., 2008, Renneville et al., 2008). As immune effector cells, macrophages are directly derived from monocytes under inflammatory conditions (Ginhoux and Jung, 2014). In response to different stimuli, macrophages can be induced to differentiate along two main functional pathways: classical (M1) activation induced by interferon-γ or Toll-like receptor (TLR) agonists and alternative (M2) activation induced by Th2 cytokines such as interleukin (IL)-4 or IL-13 (Italiani and Boraschi, 2014). M1 macrophages produce high levels of pro-inflammatory factors and inducible NO synthase (iNOS), which are critical for eradicating bacterial, viral, and fungal infections. M2 macrophages are characterized by the high expression of markers of alternative activation, such as arginase-1 (Arg-1) and IL-10, which participate in the response to parasitic infection, tissue remodeling, and tumor progression (Wang et al., 2014). At the molecular level, many transcription factors (TFs), such as nuclear factor (NF)-κB, AP-1, and PU.1, participate in TLR-induced M1 activation, whereas STAT3 and C/EBPβ are involved in the polarization of macrophages to the M2 phenotype (Lawrence and Natoli, 2011, Murray and Wynn, 2011, Mosser and Edwards, 2008). The epigenetic modifiers JMJD3 and HDACs have also been reported to participate in M2 activation (Ivashkiv, 2013).
Monocytic leukemia zinc-finger protein (MOZ) is a founding member of the MYST family of lysine acetyltransferases, together with Ybf2/Sas3, Sas2, and TIP60 (Snyder and Glass, 2000). MOZ has intrinsic histone acetyltransferase (HAT) activity, increasing the acetylation of H3K14 and H3K9, leading to chromatin remodeling (Carlson and Glass, 2014, Champagne et al., 2001). MOZ appears to function as a cofactor for AML1 (RUNX1), PU.1, and p53-mediated gene expression (Kitabayashi et al., 2001, Rokudai et al., 2013, Katsumoto et al., 2006). Recurrent translocations within the MOZ gene are associated with AMoL (Troke et al., 2006). Fusion proteins such as MOZ-TIF2 and MOZ-NCOA3 retain the N-terminal portion of MOZ and show aberrant functionality, which affects histone modification and gene regulation (Deguchi et al., 2003, Esteyries et al., 2008). In line with the evidence linking MOZ to leukemia, some studies have highlighted the essential role of MOZ in the development and maintenance of hematopoietic stem cells (Katsumoto et al., 2006, Perez-Campo et al., 2013, Sheikh et al., 2016). Owing to the lack of a mouse model (the MOZ−/− genotype is embryonic lethal), the molecular functions of MOZ involved in monocyte differentiation and macrophage activation are poorly understood.
MicroRNA (miRNAs) are short, endogenous, single-stranded RNA molecules that regulate gene expression at the posttranscriptional level (Bartel, 2004). Recent studies have shown that a range of miRNAs have critical functions in the regulation of inflammatory responses in macrophages and monocytes (Lu and Liston, 2009, Gilicze et al., 2014). miR-223 was in the first cadre of miRNAs discovered to be highly expressed in myeloid cells. The expression of miR-223 is regulated by a combination of factors, including PU.1, E2F1, GATA1, C/EBPα, and C/EBPβ (Fukao et al., 2007, Pulikkan et al., 2010, Eyholzer et al., 2010, Zhou et al., 2015). miR-223 has been proved to play an important role in granulocyte differentiation by targeting E2F1, and deregulated miR-223 is associated with acute myeloid leukemia (AML) progression (Pulikkan et al., 2010). Before IKKα and STAT3 were confirmed as validated targets of miR-223 in recent studies, it was believed that miR-223−/− macrophages have a stronger response to lipopolysaccharide (LPS) stimulation.
Our initial observation of the significantly reduced MOZ expression in patients with AMoL prompted us to investigate the potential effect of MOZ on AMoL pathogenesis. In this study, knockdown of MOZ in THP-1 cells blocked phorbol myristate acetate, a specific activator of Protein Kinase C (PMA)-induced differentiation and conferred apoptotic resistance to chemotherapeutic-drug-induced cell death. Loss of MOZ diminished TLR-induced M1 activation of macrophages. Our results also demonstrate that MOZ is a validated target and transcriptional repressor of miR-223. Thus our study shows that monocyte differentiation and macrophage activation are regulated by the MOZ-miR-223 network, in which MOZ functions as a key regulator of differentiation and polarization, interlinked with miR-223 in a mutual negative feedback loop.
Results
Low Expression of MOZ Is Associated with Poor Prognosis in AML Cases
The pathogenesis of AML involves the abnormal proliferation and blocked differentiation of a clonal population of myeloid stem cells. Various biomarkers for AML have been identified, such as FLT3-ITD, NPM1 mutants, and C/EBPα mutants. Based on previous reports, MOZ has been found to be fused to other moderators (NCOA3, TFII, p300, etc.) in AMoL caused by chromosome translocation (Esteyries et al., 2008, Carapeti et al., 1997, Chaffanet et al., 2000). However, the specific role of MOZ in AML pathogenesis is not well understood. Here, we applied an integrated approach and analyzed multidimensional data from AML cases in the TCGA and GEO databases to investigate the relationship between MOZ and AML. As shown in Figure 1A, we found low expression of MOZ in FLT3-TKD, FLT3-ITD, and NPM1 mutant groups, as well as high expression in a C/EBPα mutant group. Given that FLT3-TKD and FLT3-ITD mutants were associated with poor outcomes in AML, whereas improved prognosis was noted in C/EBPα mutant patients, our results suggested that low expression of MOZ was associated with aggravated AML progression. In addition, we performed a correlation analysis between MOZ and well-defined AML biomarkers in AML cases in the TCGA cohort. As shown in Figure 1B, we found that MOZ was inversely associated with various markers. In addition, we compared the MOZ expression among different subgroups of AML based on the French–American–British(FAB) classification system. Interestingly, we found that the expression of MOZ was lowest in the M5 group in TCGA or GEO cohorts, as presented in Figure 1C. To determine whether the monocyte proportion in leukemia contributed to the observed low expression of MOZ in the M5 group, we compared the log2-transformed expression value of MOZ in different AML cases grouped by the proportion of monocytes. Indeed, as shown in Figures 1D and 1A, a high percentage of monocytes was associated with low MOZ expression. To exclude the possibility of intrinsic expression differences, we compared the expression of MOZ in monocytes and other lymphocytes. No significant difference was observed between CD14+ monocytes and CD14- lymphocytes (derived from peripheral blood mononuclear cells), as shown in Figure 1D, suggesting that MOZ was not heterogeneously expressed in diverse cell groups, at least in hematopoietic-derived cell subgroups. Furthermore, M5 patients younger than 65 years with low expression of MOZ in the TCGA cohorts with normal karyotypes showed worsened overall survival, whereas GEO cohorts showed the same trend (Figure 1F). Collectively, integrated analysis of the TCGA and GEO cohorts suggested that low MOZ was strongly associated with poor clinical outcomes in AMoL.
Figure 1.

Low Expression of MOZ Is Associated with Poor Prognosis in TCGA and GEO Cohorts
(A) Statistical analysis of MOZ expression in somatic mutant and normal groups in the GEO or TCGA cohorts.
(B) Correlation analysis between MOZ and AML-related biomarker expression in the TCGA database using SPSS.
(C) MOZ expression in different subgroups of AML based on the FAB classification system.
(D) Comparison of MOZ expression in definite groups with differential proportions of monocytes.
(E) Isolated CD14+ monocytes and eluted lymphocytes from human peripheral blood mononuclear cells s were used for determining the mRNA level of MOZ by quantitative PCR.
(F) Survival analysis of MOZ in patients with AML (M5 subtype younger than 65 years) in TCGA (hazard ratio [HR] = 4.01) or GEO cohorts (HR = 1.37) was performed using Kaplan-Meier methods. ∗p < 0.05; ∗∗p < 0.01; ∗∗∗p < 0.001; NS, not significant.
MOZ Knockdown Aggravates AMoL Progression
To validate the correlation between AMoL development and MOZ expression, we examined the MOZ transcription level in peripheral blood samples from patients with AMoL and healthy volunteers. By using unique primers that were designed to abandon the samples containing MOZ fusion fragments caused by chromosome translocation, we found that MOZ expression was significantly reduced in AMoL samples, as presented in Figure 2A. Compared with the level in purified monocytes from healthy individuals, a lower level of MOZ was observed in THP-1 cells, which are broadly used as a model for monocyte development and pathogenesis in leukemia research (Figure 2A). As altered MOZ expression was observed in AMoL, we sought to determine the expression of MOZ during normal monocyte differentiation. As shown in Figures 2B and 2D, sustaining increased MOZ expression was observed during cytokine-induced primary monocyte development. Similar results were obtained in PMA-induced or 1,25(OH)2-VitD3 (VD3)-induced THP-1 transformation (Figures 2C and S1A). In addition, MOZ was also upregulated in PMA- and VD3-induced U937, which is another monocytic AML cell line (Figure S1B). These results suggest that there is a causal connection between MOZ expression and monocyte fate. To address this hypothesis, we established a stable transfected THP-1 or U937 cell line expressing short hairpin RNA against MOZ transcripts (designated as shMOZ), and the efficiency of knockdown was confirmed (Figures 2E and S1D). In our experiments, we found that the stem cell maker CD34 was up-regulated in shMOZ cells, whereas loss of MOZ reduced CD38 or CD11b expression when compared with control cells (Figures 2F and S1C). In addition, MOZ knockdown arrested the cell cycle in THP-1 cells as evidenced by more cells in the G0 phase (Figure 2G). Similar results were observed in U937/shMOZ cells, which exhibited decreased proliferation activity (Figure S1E). Vimentin and E-cadherin are well-characterized differentiation-related markers (Mor-Vaknin et al., 2003, Van den Bossche et al., 2015). Here, we found that the level of vimentin, which is down-regulated by induction with PMA, was higher in shMOZ than in control cells, whereas PMA-induced up-regulation of E-cadherin was significantly lower in shMOZ cells. In addition, shMOZ cells exhibited an impaired differentiation progression, based on lower PMA-induced adherence and limited production of reactive oxygen species (ROS) triggered by LPS stimulation compared with that in control cells (Figures 2I and S1I). Furthermore, the loss of MOZ conferred apoptosis resistance to THP-1 cells or U937 against cisplatin-induced cell death (Figures 2J, S1F, and S1G, statistical results shown on the right). Besides, Wright-Giemsa staining showed that higher nuclear-cytoplasmic ratio was present in MOZ knockdown cell (Figure S1H). Taken together, these data confirm the critical role of MOZ in monocyte development and show that loss of MOZ blocks normal differentiation and facilitates AMoL pathogenesis.
Figure 2.

Knockdown of MOZ Promotes AMoL Development
(A) Sorted monocytes from peripheral blood of patients with AML or healthy individuals (left) or immortal THP-1 cells (right) were lysed for quantitative PCR (qPCR), using MOZ-specific primers.
(B–D) Monocytes from mouse bone marrow or human peripheral blood and THP-1 cells were treated with M-CSF (20 ng/mL), GM-CSF (100 ng/mL), or PMA (10 μg/mL) for the indicated time periods. qPCR was performed to determine MOZ expression, normalized to GAPDH (B and C). Representative western blot (D) of MOZ is shown.
(E) The efficiency of MOZ knockdown in THP-1 cells is shown.
(F) shMOZ stable-transfected THP-1 cells and control cells were labeled with anti-CD34 or anti-CD38 antibodies conjugated with fluorescein isothiocyanate or phycoerythrin (PE) and analyzed using flow cytometry.
(G) THP-1 shMOZ or control cells were cultured for 24 hr, fixed, and permeabilized with ethanol (100%) overnight. Sequentially, the cells were stained with propidium iodide (PI) at the indicated concentration and examined for cell division using fluorescence-activated cell sorting (FACS).
(H) THP-1 shMOZ or control cells treated with PMA (10 μg/mL) at the indicated times were analyzed for E-cadherin and vimentin expression by western blot, and GAPDH was used as the internal control.
(I) The cellular shape of paired cells treated with PMA for 24 hr was visualized by light microscopy (up). Paired cells pretreated with PMA (10 μg/mL, 12 hr) were stimulated with or without LPS for an additional 12 hr. Then the cells were incubated with DCFH-DA (10 μM) for another 4 hr and subjected to analysis by FACS.
(J) Paired cells were treated with cisplatinum at the indicated concentration for 24 hr. Then the cells were stained with annexin-V and PI for FACS analysis.
Data represent one of three independent experiments. Data show means ± SEM. *p < 0.05; **p < 0.01; NS, not significant.
Furthermore, we also used specific inhibitor (MOZ-IN-3) targeting against MOZ to evaluate the role of MOZ in U937. As shown in Figure S2B, U937 treated with MOZ-IN-3 for 15 days had higher nuclear-cytoplasmic ratio induced with PMA or VD3 when compared with non-treated cells. Also, enhanced anti-apoptosis activity to chemotherapeutic-drug-induced cell death was observed in U937 treated with MOZ-IN-3 (Figures S2C and S2D). In line with the observation in MOZ knockdown U937, these results confirmed that MOZ activity was critical for monocyte functions.
Dysregulated MOZ Has Strong Connection with Mutated Myeloid-Related Regulators in AML
To uncover the reason why MOZ is expressed at a low level in AML, especially in AMoL, we screened the sequence 3 kb upstream of the proximal TSS (transcription start site) of the human MOZ gene for regulatory elements and corresponding factors using various software available online as detailed in Figure 3A. Subsequently, the predicted TFs with high scores were organized and ranked for GO analysis. As shown in Figure 3B, the identified TFs were strongly associated with AML pathogenesis. Based on the knowledge of somatic mutation in some master genes contributing to tumorigenesis, we analyzed the mutant frequency of predicted TFs in various cancer cases in the TCGA cohort. As shown in Figure 3C, we found that most of these factors possess ≥10% mutant rate among the 500 most mutant cases in the TCGA database. Furthermore, gene co-expression analysis performed using cytoscape software (GeneMINIA module) indicated that MOZ expression was strongly connected with these chosen TFs, especially SP1, SPI-1, and EST-1 (Figure 3D). In addition, the co-expression network comprised by these TFs and the 10 factors with the highest mutation rate in AML indicated that they shared extensive functional properties (Figure 3E). Thus based on the above bioinformatic analysis, it is reasonable to assume that impaired MOZ expression in AMoL might be attributable to the abnormal activity of AML-related regulators caused by somatic mutation or deregulation mediated by other modulators.
Figure 3.

Bioinformatics Analysis of the MOZ Promoter
(A) A 3-kb sequence located upstream of the proximal TSS of the MOZ gene was taken for predicating putative transcription factors (TFs) using various software or databases (COMPEL, JASPAR, PROMO 3.0, FANTOM project, and Ensembl), and the threshold was >0.9 or >90, according to different software.
(B) GO analysis of predicated TFs.
(C) The mutant frequency of predicated TFs in AML cases in TCGA cohorts.
(D) A co-expression network was constructed between MOZ (KAT6A) and predicated TFs using cytoscape software.
(E) The genes with the highest mutant rate in AML cases were used for co-expression analysis with predicated TFs using cytoscape software.
Loss of MOZ Diminishes the M1 Activation of Macrophage
The above results show that MOZ plays an important role in determining monocyte fate (normal differentiation versus AML pathogenesis). As immune effector cells, macrophages are derived directly from monocytes under normal or inflammatory conditions (Varol et al., 2015). To determine whether MOZ takes part in macrophage functions, we measured the expression of MOZ in activated macrophages induced by TLR agonists. As shown in Figures 4A and 4B, MOZ was clearly up-regulated after ligand stimulation. It is well accepted that TLR ligands (LPS, poly I:C, or PAM3CK4) induce M1 polarization, whereas the cytokines IL-4 and IL-13 polarize cells to the M2 phenotype, initiating the tolerance reaction (Wang et al., 2014). Here, IL-4 induced the down-regulation of MOZ expression but elevated arginase expression in knockdown cells, indicating that the loss of MOZ was favorable for M2 polarization (Figures 4C and S1A). To further explore the functions of MOZ in macrophages, we generated a puromycin-resistant RAW264.7 cell line that was stably transfected with the expression cassette of a small interfering RNA targeting MOZ transcripts and pac gene coding for an enzyme that degrades puromycin (Figure 4D). MOZ knockdown macrophages (designed as shMOZ) showed lower production of pro-inflammatory factors such as IL-1β, tumor necrosis factor (TNF) α, and IL-6 in the context of LPS stimulation than control cells (Figures 4E and 4F). Similar results were obtained in bone-marrow-derived macrophages (BMDMs) transfected with siMOZ (Figure S1B). However, the anti-inflammatory factor IL-10, representing the alternative activation (M2) phenotype, was higher in shMOZ cells (Figures 4E and 4F). An oxidative burst, producing various highly reactive oxygen derivatives that are critical components of the antimicrobial repertoire of macrophages, can be induced by many external stimuli, such as bacteria, fungi, and viruses (Forman and Torres, 2002). To investigate whether MOZ regulates antimicrobial reactions in macrophages, we first examined the LPS-induced oxidation level using the classical agent dichloro-dihydro-fluorescein diacetate (DCFH-DA) for indicating the amount of ROS. Consistent with reduced iNOS expression in shMOZ cells (Figure S1C), MOZ knockdown significantly suppressed the production of ROS in macrophages (Figure 4G). To assess the role of MOZ in macrophage phagocytosis, we constructed GFP-expressing bacteria using a prokaryotic expression system that was added to the culture media of macrophages. As shown in Figures 4H and S1C, lower GFP intensity was observed in shMOZ cells, suggesting that the loss of MOZ attenuated the ability of macrophages to undergo phagocytosis. The bactericidal reaction, as a sequence of events occurring in M1 macrophages, is critical for protecting the body from infection (Banerjee et al., 2013). Here, we found that MOZ knockdown significantly diminished the bactericidal activity of macrophages, consistent with the effects of MOZ on M1 macrophage functional modulation. Taken together, these data demonstrate that MOZ regulates the cellular functions associated with the M1 phenotype.
Figure 4.

Loss of MOZ Diminishes M1 Activation of Macrophages
(A–C) Macrophage cell lines (J774.1 and RAW264.7) or primary BMDMs were incubated with or without LPS (100 ng/mL) for different time periods, and MOZ expression was then quantified using qPCR (A). RAW264.7 cells treated with various TLR agonists (PAM3CK4 5 μM, Poly I:C 10 μg/mL) for 6 hr were examined for MOZ expression by qPCR (B). BMDMs were treated with LPS (100 ng/mL) or IL-4 (20 ng/mL) for different time periods and were monitored for MOZ expression by qPCR (C). Genetic deletion of MOZ in RAW264.7 cells (designated as shMOZ) was confirmed for the efficiency of knockdown using qPCR, western blot, or hybridization.
(E and F) Pro-inflammatory factor expression was determined by qPCR at the transcription level (E) or by ELISA for protein production (F) in paired cells treated with LPS (100 ng/mL) for the indicated time periods.
(G) Pretreated RAW 264.7 shMOZ or control cells treated with LPS (100 ng/mL) for 6 hr were incubated with DCFH-DA (10 μM) for an additional 4 hr and subjected to fluorescence-activated cell sorting. Shown on the right are the statistical results.
(H) Raw264.7 shMOZ or shcon cells were co-cultured with GFP-expressing bacteria (GFP bacteria, E. coli) for 4 hr, and the GFP intensity was then detected using FACS. Data represent one experiment of three independent trials.
(I) shMOZ or control cells were pretreated with LPS (100 ng/mL) for 12 hr, and live E. coli was sequentially added for another 2 hr. Then the supernatant was collected and diluted at the indicated times and cultured on agar plates for 24 hr at 37°C. The bacterial colonies were counted, and the colony-forming unit of E. coli from the supernatant was determined. Similar results were obtained from three independent experiments.
Data show the mean ± SEM. *p < 0.05, **p < 0.01, ***p < 0.001; NS, not significant.
MOZ Positively Regulates the TLR Signaling Pathway and Histone Modification Events
Macrophage priming with LPS initiates multiple signal transduction events, including NF-κB, mitogen-activated protein kinase (MAPK), and PI3K/AKT, which are ultimately converted into cytokine production and M1 polarization (Wang et al., 2014). To investigate whether MOZ affects the signaling events downstream of TLR4/LPS, we assessed the phosphorylation level of AKT, p65, Erk, p38, and JNK in LPS-stimulated macrophages. As shown in Figure 5A, knockdown of MOZ slightly affected the phosphorylation level of p65, but significantly decreased the phosphorylation of AKT and MAPKs. However, MOZ did not appear to regulate the expression of total protein of Erk, p38, JNK, and AKT, as evidenced by the similar bands observed in shMOZ and control cells (Figure 5A). In addition, reporter assays provided the same results with regard to the attenuation of AKT and MAPK signals in shMOZ cells, whereas MOZ did not affect the activity of NF-κB or STAT3 (Figure 5B). Thus these results suggest that MOZ regulates AKT and MAPK activity, which are crucial for M1 polarization.
Figure 5.

MOZ Knockdown Impairs Multi-pathway Activity and Attenuates Epigenetic Modification of Histone H3
(A) Stably transfected RAW264.7 cells with short hairpin RNA (shRNA) targeting MOZ mRNA or control shRNA and six-well-plate-cultured BMDMs that were transiently transfected with small interfering RNA (siRNA) against MOZ or scramble siRNA (20 μM) for 48 hr were treated with LPS (100 ng/mL) at the indicated time points. After stimulation, cells were collected and lysed for immunoblotting analysis.
(B) Foxo1-luc, NF-κB-luc, AP-1-luc, and STATs-luc reporter plasmids were co-transfected with pRL vectors into LPS-pretreated shMOZ or control cells. The luciferase activity was measured and normalized against Renilla luciferase activity.
(C) The phosphorylation of histone H3 was determined by western blot analysis in shMOZ or control cells (up). Co-immunoprecipitation analysis was conducted to detect the acetylation level of H3 in paired cells (down).
(D) Chromatin immunoprecipitation analysis using anti-phosphorylated/acetylated H3 antibody to pull down DNA fragments from shMOZ or control cells that were amplified for real-time PCR for determining the enrichment of regulatory elements of the IL1B and TNFA genes.
(E) Intracellular IL-1β expression was detected using western blot in paired cells treated with LPS (100 ng/mL) at the indicated time points.
Data are pooled from at least three independent experiments. Data show the mean ± SEM. **p < 0.01; NS, not significant.
Previous research has shown that MOZ can acetylate lysine-9 residues in histone H3, resulting in condensed chromatin transforming into a more relaxed structure that is associated with greater levels of gene transcription (Snyder and Glass, 2000). To determine whether MOZ regulates the histone acetylation involved in M1 polarization, we examined the acetylation level of H3 histone in LPS-stimulated shMOZ or control cells. As shown in Figure 5C, the level of acetylated and phosphorylated H3 histone was clearly reduced in shMOZ cells. In addition, chromatin immunoprecipitation assays suggested that acetylated histones binding to the enhancer of pro-inflammatory genes including IL1B and TNFA were significantly reduced in shMOZ cells (Figure 5D). In line with this finding, decreased IL-1β production was found in shMOZ cells incubated with LPS for different periods of time (Figure 5E). Thus these results demonstrate that MOZ positively regulates multiple pathways and H3 histone acetylation to promote M1 polarization.
MOZ Is a New and Reliable Target of miR-223
The literature indicates that miR-223 is highly expressed in myeloid cell linages and participates in AML progression (Kuchenbauer et al., 2010). To investigate the role of miR-223 in AML, we first analyze the expression of miR-223 in AML cases based on TCGA database. Contrary to MOZ, miR-223 expression was expressed in M4/M5 patients or >20% group (Figures S3A and S3B), and low expression of miR-223 was associated with favorable prognosis (Figure S3C). To detect the expression of miR-223 or its precursor in patients with clinical AML, we designed specific primers to amplify a fragment containing miR-223, as described in Figure S5A. In accordance with previous reports, we found that the precursor or mature miR-223 was more highly expressed in AML samples or THP-1 cells than in healthy samples (Figures 6A and 6B). Besides, integrated data from TCGA suggested that miR-223 had inverse correlation with MOZ expression (Figure S3D). To confirm this, we examined miR-223 and MOZ expression during monocyte development. As shown in Figure 6C, miR-223 was decreased, whereas MOZ was up-regulated during PMA-, granulocyte-macrophage colony-stimulating factor (GM-CSF)-, or macrophage colony-stimulating factor (M-CSF)-induced monocyte-to-macrophage differentiation. Furthermore, we established miR-223 overexpression (designated as pre-miR-223) or knockdown (designated as sponge) cell lines (Figure S3E). Overexpression of miR-223 decreased the nuclear-cytoplasmic ratio, whereas knockdown of miR-223 increased the ratio in U937 (Figure S3J). Meanwhile, overexpression of miR-223 resulted in increased growth of U937 in soft agar containing 8 μg/mL cisplatin, whereas less growth colonies were observed after miR-223 knockdown (Figure S3K). Similar results were obtained from the CCK8 assay, which was used for analyzing the cell viability of parental U937 and the transfectants cells treated with chemotherapeutic drugs (Figures S3H and S3I). Also, overexpression of miR-223 in cells led to lower proliferation activity, whereas miR-223 knockdown promoted U937 proliferation (Figure S3L). All together, these results suggest that miR-223 promotes AML progression and inhibits monocyte differentiation.
Figure 6.

miR-223 Down-regulates MOZ Expression
(A) Total RNA was extracted from isolated and purified monocytes from AML patients or helthy volunteers following to be reverse transcribed into cDNA by using random primers or stem-loop RT primers. The cDNA was used for determing the expression precursor or mature miR-223 by using qPCR. (B) THP-1 cells or monocytes from healthy volunteers was lysed by Tirzol reagent, and total RNA was reverse transcribed into cDNA. Precursor miR-223 was examined by using qPCR.
(C) miR-223 and MOZ expressions were monitored during PMA-, GM-CSF-, or M-CSF-induced monocyte differentiation at the indicated time points by qPCR.
(D) Induced human macrophage derived from monocytes (MDMs) were treated with LPS (100 ng/mL) or IL-4 (20 ng/mL) for the indicated time periods, and miR-223 and MOZ expressions were then determined by qPCR.
(E) Schematic representation of the MOZ gene and the conserved regulatory elements in the 3′ UTR.
(F and G) RAW264.7 cells were transiently transfected with 20 nM miR-223 mimics or control mimics and 20 nM miR-223 inhibitors or control inhibitors. At day 3 after transfection, the cells were collected and analyzed for MOZ expression by qPCR (F) or western blot (G).
(H and I) The alignment of miR-223 and its target sites in the 3′ UTR of the human MOZ gene and the introduced mutated nucleotides for the reporter assay are shown (H). A total of 200 ng psiCheck2-hMOZ-3′ UTR-WT or psiCheck2-hMOZ-3′ UTR-mut (hMOZ-3′UTR or hMOZ-3′ UTR-mut) was co-transfected with 200 ng miR-223 overexpression plasmids into HEK293 cells. After 24 hr, Renilla luciferase activity was measured and normalized to firefly luciferase activity (I).
(J) RAW264.7 cells were transfected with 20 nM siMOZ, miR-223 mimics, or scramble small interfering RNA. At day 3 after transfection, live E. coli was added to the media for another 4 hr, and the supernatant was then diluted and cultured on Luria broth agar plates at 37°C for 16 hr. The bacterial colonies were enumerated, and the colony-forming unit of E. coli from supernatants was determined.
Data are pooled from at least three independent experiments. Data show the mean ± SEM. *p < 0.05, **p < 0.01, ***p < 0.001; NS, not significant.
In macrophages, miR-223 has been shown to suppress the expression of M1 phenotype and promote transition to the M2 phenotype (Li et al., 2010, Haneklaus et al., 2012). In agreement with previous reports, we found that miR-223 was also markedly reduced during LPS-induced M1 polarization, whereas M2 polarization induced elevated miR-223 (Figure 6D). Considering the expression pattern of MOZ and miR-223 in AML or stimulated macrophage, we speculated that MOZ may be a potential target of miR-223. To this end, we analyzed the 3′ UTR of MOZ sequence using TargetScan 5.1, and we found that miR-223 was one of the conserved miRNAs targeting MOZ mRNA (Figure 6E). To validate this finding, we transfected macrophages with either synthesized miR-223 mimics or miR-223 inhibitor mimics and their corresponding scrambled controls for determining the effect on MOZ expression. As shown in Figures 6F and 6G, we found that miR-223 inhibited MOZ expression, whereas antagonizing miR-223 function by miR-223 inhibitor mimics enhanced MOZ expression. Overexpression of the precursor transcript of miR-223 resulted in reduced MOZ (Figures S3F and S5E). Besides, MOZ expression was up-regulated in U937 transfected with miR-223 sponge (Figure S3G). Reporter gene assays also demonstrated that MOZ was a validated target of miR-223 (Figures 6H and 6I). To assess whether miR-223 shares functional properties with MOZ in macrophages, BMDM cells were transfected with miR-223 mimics, siMOZ, or scramble RNA and were then examined for bactericidal activity. As shown in Figure 6J, like siMOZ, miR-223 mimics significantly suppressed bactericidal activity, suggesting that MOZ mediates the effect of miR-223 on M1 polarization.
MOZ Negatively Regulates miR-223 Expression
The critical role of PU.1 in regulating miR-223 expression has been well documented (Fukao et al., 2007). MOZ has also been reported to be a co-activator of PU.1 or RUNX1, participating in the regulation of some genes (Katsumoto et al., 2006, Kitabayashi et al., 2001). To examine whether MOZ contributes to the regulation of miR-223 in macrophages, we compared the transcriptional level of precursor or mature miR-223 in shMOZ and control cells. As expected, knockdown of MOZ enhanced the expression of miR-223 (Figures 7A and 7B and S5B/C/D). To uncover the mechanism underlying the regulation of miR-223 by MOZ, the 5′-flanking genomic region of the proximal promoter of pri-miR-223 was analyzed using JASPAR software (version: JASPAR, 2014 serve). We found a putative RUNX1-binding motif close to the confirmed PU.1-binding element on the conserved cis-acting regulatory element of the pri-miR-223 gene, and a set of reporter vectors were generated as shown in Figure 7C. Relative reporter activity for each reporter vector was examined using a dual luciferase reporter assay in shMOZ or control cells. As shown in Figure 7D, pri-miR-223−760 reporter activity was significantly higher in shMOZ cells, and a mutated putative RUNX1-binding site still exhibited enhanced activity in shMOZ cells. However, when mutation was introduced into the PU.1-binding sites, the pri-miR-223PU.1−del reporter activity was considerably reduced and there was no difference between shMOZ and control cells. Furthermore, to exclude the possibility that MOZ regulates PU.1 expression, which sequentially affects miR-223, we examined the expression of PU.1 and RUNX1 at the transcript level in shMOZ cells. As shown in Figure 7E, there was no significant alteration of PU.1 or RUNX1 in shMOZ cells. Collectively, these results demonstrate that MOZ suppresses miR-223 expression by regulating the promoter activity of pri-miR-223, and that the PU.1-binding element on the promoter is critical for this regulation. The details of the underlying mechanism remain to be elucidated in future studies.
Figure 7.

MOZ Functions as a Repressor of the miR-223 Gene
(A and B) MOZ knockdown up-regulated miR-223 expression. Precursor or mature miR-223 level was analyzed in RAW264.7 shMOZ or control cells (A) and THP-1 shMOZ or control cells (B) by qPCR.
(C) Schematic representation of different miR-223 promoter constructs used for reporter assays.
(D) Indicated reporter plasmids were co-transfected with pRL into shMOZ or control cells. After 24 hr, the firefly luciferase activity was measured and normalized to the Renilla luciferase activity.
(E) PU.1 and RUNX1 levels were determined in shMOZ or shcon cells using qPCR.
Data are presented as the mean ± SEM from three independent experiments. Similar results were obtained in three independent experiments. *p < 0.05, **p < 0.01, ***p < 0.001; NS, not significant.
Discussion
Previous studies have shown that MOZ fusion proteins, including MOZ-TIF2, MOZ-CBP, and MOZ-NCOA3, are associated with myeloid cancer progression (Deguchi et al., 2003, Giles et al., 1998, Esteyries et al., 2008). However, the precise role of MOZ in AML pathogenesis is not well documented. Mutant analysis of the COSMIC database showed that the somatic mutation rate of MOZ is low (0.37% in hematopoietic and lymphoid tissues). Therefore it is unlikely that somatic mutation is attributable to the deregulation of MOZ in AML progression, although we cannot exclude the deregulation of MOZ fusions in partial patients. In addition, integrated analysis of AML in TCGA or GEO cohorts indicated that MOZ expression is the lowest in the M5 subgroup of AML and is associated with poor prognosis. Therefore combined with the observation that MOZ is up-regulated during normal monocyte development, the aberrant expression of MOZ in AML indicates that MOZ expression is strongly related to monocyte fate. A bioinformatic approach to the analysis of the promoter of the MOZ gene predicated a list of TFs with high mutation rates in AML pathogenesis, providing valuable insight into how MOZ is deregulated in AML. In our present work, we found that MOZ knockdown blocked PMA-induced monocyte differentiation and conferred apoptotic resistance to chemotherapeutic-agent-induced cell death. Thus our results reveal that loss of MOZ facilitates the neoplastic transformation of monocytes.
Derived from monocytes, macrophages undergo different activation pathways, categorized as the M1 and M2 phenotypes, in response to different external stimuli. Bacteria- or LPS-induced M1 polarization increases iNOS expression and promotes inflammatory responses mediated by up-regulated pro-inflammatory factors, whereas the M2-polarized phenotype induced by IL-4 enforces Arg-1 and IL-10 expression associated with anti-inflammatory reactions (Italiani and Boraschi, 2014). In this study, polarized M1 macrophages showed increased MOZ expression, whereas MOZ was down-regulated in IL-4-induced M2 macrophages. Knockdown of MOZ markedly attenuated the M1 activation of macrophages, as demonstrated by the reduced pro-inflammatory expression and impaired capability of phagocytosis and bacterial killing in MOZ-silenced macrophages. Together, these data suggest that MOZ plays a role in controlling the plasticity of macrophage polarization. Therefore any deregulation of MOZ could diminish the ability of macrophages to adjust their differentiation state, which is necessary for macrophages to mount a proper response to environmental cues. Conceivably, a failure of proper polarization will lead to pathologic conditions.
Intrinsic multi-faceted pathways, including the PI3K/AKT, MAPK, and NF-κB pathways, play important regulatory roles in macrophage polarization (Luyendyk et al., 2008, Kang et al., 2008, Liu et al., 2014). Upon stimulation, the receptors convert external signals into an intracellular cascade of reactions that ultimately lead to downstream transcriptional events. AKT1 kinase has been reported to regulate mitochondrial ROS production in macrophages, which induces mitophagy and modulates apoptotic resistance (Larson-Casey et al., 2016). In our experiments, we found that the loss of MOZ reduced phospho-AKT in response to LPS stimulation, which could explain the lower level of ROS in MOZ knockdown cells, at least partially. MOZ has been demonstrated as a co-activator for NF-κB in regulating NF-κΒ-dependent promoters, and the physical interaction between p65 and MOZ has been proved in vitro (Chan et al., 2007). However, in macrophages, we did not find that MOZ affected the activity of NF-κB in the context of LPS stimulation. The discrepancy between this previous study and ours could be explained by the different cell systems used (macrophage versus tumor cell lines), and the relatively low affinity of MOZ for p65 exhibited in earlier studies does not definitively show that this functional complex exists, especially in immune cells. MAPKs have at least three distinct signaling modules, including Erk, JNK, and p38 kinases that can phosphorylate the TFs c-Jun or c-Fos and induce the activation of c-Jun/c-Fos (AP-1) to shape M1 macrophage polarization (Liu et al., 2014). In our work, the impaired activity of Erk and JNK kinases, as well as the attenuated AP-1 activity, in MOZ knockdown cells suggested that MOZ could regulate the MAPK pathway to control the plasticity of macrophage polarization. However, the underlying mechanism of MOZ-mediated AKT or MAPK pathway regulation remains to be studied in the future.
Epigenetic modification plays a pivotal role in controlling the plasticity of macrophage polarization. The effector molecules involved in epigenetic regulation, including CBP, MOF, HDAC3, and JMJD2, have been proved to be important in regulating macrophage differentiation states (Ivashkiv, 2013). MOZ has been reported to acetylate histones H3 and H4, resulting in the chromosome configuration transformation that is required for gene transcription. Indeed, we also found that MOZ regulated the phosphorylation and acetylation of H3, which is critical for pro-inflammatory factor expression. Although detailed information about how MOZ regulates pro-inflammatory factor expression (i.e., whether MOZ-mediated signal transduction and epigenetic modification are synergistic or independent for this process) remains to be explored, our data clearly demonstrate that MOZ plays multi-functional roles in macrophage activation.
miR-223, which is specifically expressed in the myeloid compartment, plays a pivotal role in limiting inflammation to prevent collateral damage during infection and in preventing oncogenic myeloid transformation. Many myeloid-related master regulators have been identified as the targets of miR-223, including C/EBPβ, E2F1, IGF1R, IKKα, NFI-A, and STAT3. Some of these targets are responsible for granulopoiesis. For example, E2F1 and NFI-A have been reported to be suppressed by miR-223 at the posttranscriptional level, as well as act as repressor of miR-223 gene during granulocyte differentiation (Fazi et al., 2005, Pulikkan et al., 2010). Also, IKKα and C/EBPβ as the targets of miR-223 have been identified to be critical for the differentiation of macrophage or DC (Zhou et al., 2015). Zhou et al. have reported that the miR-223/C/EBPβ axis is essential for intestine homeostasis mediated by macrophage or DC. In this article, the authors have demonstrated that miR-223 deletion significantly promoted the differentiation and activation of monocyte-derived dendritic cell (MoDC). Of note, decreased Ly6C+ monocytes, which differentiate into intestinal CX3CR1high macrophage, and the tendency of increased granulocyte in miR-223-deficient mice suggests that the miR-223/C/EBPβ axis has an important role in deciding the direction of differentiation from bone marrow (BM) granulocyte and monocyte precursors (GMPs) as reported by Zhou et al. Also, in this article, the authors find that the number of bone-marrow-derived inflammatory DCs from miR-223−/− mice induced by GM-CSF and IL-4 in vitro is much higher than from wild-type mice, suggesting that miR-223 suppresses monocyte-to-DC development. However, whether miR-223 affects monotype-to-macrophage differentiation is not mentioned by Zhou et al. Another report has shown that miR-223 is decreased during macrophage differentiation, releasing repression of its target IKKα (Li et al., 2010). In addition, miR-223 has been proved to diminish M1 macrophage polarization by targeting STAT3 (Chen et al., 2012). In line with these reports, our results showed that miR-223 was decreased during monocyte differentiation and M1 polarization. Also, like E2F1, MOZ, as a target of miR-223, was found to be a repressor of miR-223 expression. Our initial work provides a new auto-regulatory loop mediated by MOZ and miR-223 in monocyte development and macrophage activation. As mentioned above, these identified targets of miR-223 have their distinct roles in myeloid cell functions. Although we cannot rule out the possibility of other targets of miR-223 that are involved in miR-223-mediated monocyte differentiation and macrophage activation in our study, the unique role of MOZ in monocyte development provides a reliable evidence for the dysregulated miR223/MOZ blocking the normal development and promoting AML (M4/M5) pathogenesis, at least partially. And whether these targets have cross talking in miR-223-derived differentiation or inflammation remain to be uncovered in future works (Figure 8).
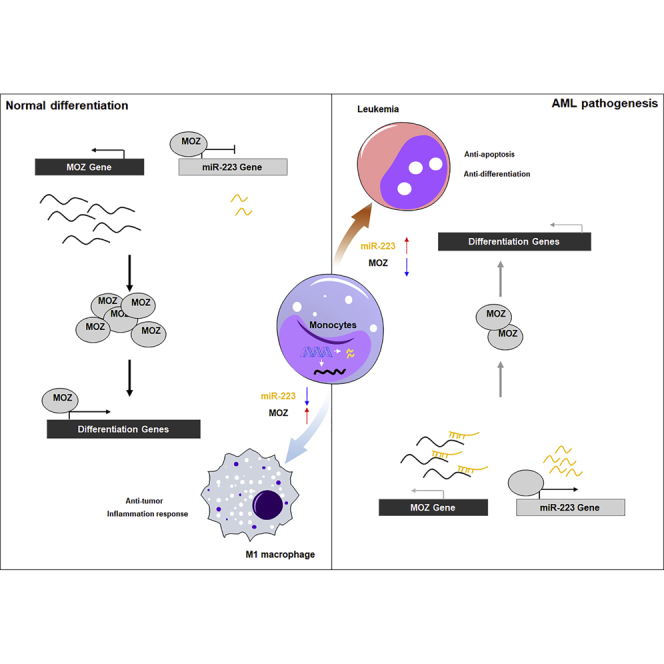
Figure 8.

Schematic Representation of a Model for the Role of MOZ and miR-223 in Normal Monocyte Differentiation and in AMoL
During normal monocyte differentiation (top panel), some master factors promote MOZ expression, which represses miR-223 gene transcription through PU.1-binding sites on the promoter. The decreased miR-223 expression further leads to the accumulation of MOZ, which is critical for M1-related gene expression. When the master factors are deregulated by various mechanisms in AMoL (bottom panel), transactivation of MOZ is inhibited, which results in the accumulation of miR-223. The increased miR-223 suppresses MOZ expression through a negative feedback loop, resulting in a block of monocyte differentiation.
A previous report has shown that MOZ regulates miR-223 expression in the context of sulfatide stimulation in hepatocellular carcinoma cells (Dong et al., 2014). In this article, sulfatide has been shown to induce the disassociation of MOZ from the promoter of pre-miR-223 gene and down-regulation of miR-223 expression. However, there is no direct evidence about MOZ attachment on the promoter being essential for miR-223 gene transcription. Whether MOZ regulates miR-223 directly in hepatocellular carcinoma (HCC) by affecting the acetylation of histone or C/EBPα needs to be uncovered in the future. In our study, MOZ suppresses miR-223 expression through conserved PU.1-binding sites in the promoter of miR-223, mechanistically. Although MOZ has been demonstrated to bind with PU.1 to facilitate PU.1-dependent transcription activity in vitro (Katsumoto et al., 2006), the lack of further investigation of this process in vivo or in other cell systems cannot exclude alternative methods by which MOZ regulates PU.1-mediated transcriptional events. Based on the finding that PU.1 expression is not affected by MOZ, we consider two possible mechanisms for MOZ in regulating miR-223: one is through the inhibitory effect of MOZ on PU.1-mediated gene transcription through physical interaction and the second is by affecting other modulators involved in PU.1-initiated transcription assembly on the miR-223 promoter that are affected by MOZ. Of course, the detailed underlying mechanism for how MOZ regulates miR-223 remains to be elaborated in subsequent work.
Limitations of the Study
We want to knock out MOZ in U937 or THP-1 using CRISPR-Cas9 system; however, the efficiency of transfection is very low and we do not obtain the positive clones after several rounds of screening. Also, we try to establish AML mouse model using NOD-SCID mice to make our conclusions more convincing. However, the model in which mice were injected with THP-1 or U937 according to the well-documented protocol as reported in other literatures failed. Besides, although we had proved connection between MOZ and miR-223, we could not distinguish which is the initiator (did MOZ down-regulation in AML result in increased miR-223 or did miR-223 up-regulation result in decreased MOZ) in the regulation loop in AML pathogenesis. Another limitation is that we cannot prove how MOZ regulated signaling pathways in macrophage. We do not know whether MOZ-regulated signaling pathways resulted in cytokine expression, or MOZ regulated the cytokine expression, which induces the activation of signaling pathways.
Methods
All methods can be found in the accompanying Transparent Methods supplemental file.
Acknowledgments
This work was supported by the China Postdoctoral Science Foundation (2016M592060) and the Anhui Provincial Natural Science Foundation (No# 1808085MH262). We thank Ying Zhou and Baoling Sun for valuable suggestions.
Author Contributions
Conceptualization, M.J. and J.Z.; Methodology, M.J. and J.Z.; Investigation, M.J., J.Z., L.Q., and Y.M.; Writing – Original Draft, M.J. and J.Z.; Writing – Review & Editing, M.J.; Funding Acquisition, M.J. and J.Z.; Resources, H.L. and R.L.; Supervision, M.J. and L.Q.
Declaration of Interests
The authors declare no competing interests.
Published: January 25, 2019
Footnotes
Supplemental Information includes Transparent Methods, five figures, and one table and can be found with this article online at https://doi.org/10.1016/j.isci.2018.12.016.
Supplemental Information
References
- Banerjee S., Xie N., Cui H., Tan Z., Yang S., Icyuz M., Abraham E., Liu G. MicroRNA let-7c regulates macrophage polarization. J. Immunol. 2013;190:6542–6549. doi: 10.4049/jimmunol.1202496. [DOI] [PMC free article] [PubMed] [Google Scholar]
- Bartel D.P. MicroRNAs: genomics, biogenesis, mechanism, and function. Cell. 2004;116:281–297. doi: 10.1016/s0092-8674(04)00045-5. [DOI] [PubMed] [Google Scholar]
- Carapeti M., Aguiar R.C.T., Goldman J.M., Cross N.C.P. A novel fusion between MOZ and the nuclear receptor coactivator TIF2 in AML with the inv(8)(p11q13) Blood. 1997;90:1420. [Google Scholar]
- Carlson S., Glass K.C. The MOZ histone acetyltransferase in epigenetic signaling and disease. J. Cell Physiol. 2014;229:1571–1574. doi: 10.1002/jcp.24617. [DOI] [PMC free article] [PubMed] [Google Scholar]
- Chaffanet M., Gressin L., Preudhomme C., Soenen-Cornu V., Birnbaum D., Pebusque M.J. MOZ is fused to p300 in an acute monocytic leukemia with t(8;22) Genes Chromosomes Cancer. 2000;28:138–144. doi: 10.1002/(sici)1098-2264(200006)28:2<138::aid-gcc2>3.0.co;2-2. [DOI] [PubMed] [Google Scholar]
- Champagne N., Pelletier N., Yang X.J. The monocytic leukemia zinc finger protein MOZ is histone acetyltransferase. Oncogene. 2001;20:404–409. doi: 10.1038/sj.onc.1204114. [DOI] [PubMed] [Google Scholar]
- Chan E.M., Chan R.J., Comer E.M., Goulet R.J., Crean C.D., Brown Z.D., Fruehwald A.M., Yang Z., Boswell H.S., Nakshatri H., Gabig T.G. MOZ and MOZ-CBP cooperate with NF kappa B to induce expression of NF kappa B-dependent genes. Blood. 2007;110:271a. doi: 10.1016/j.exphem.2007.07.015. [DOI] [PubMed] [Google Scholar]
- Chen Q.Y., Wang H., Liu Y., Song Y.J., Lai L.H., Han Q., Cao X.T., Wang Q.Q. Inducible MicroRNA-223 Down-regulation promotes TLR-triggered IL-6 and IL-1 beta production in macrophages by targeting STAT3. PLoS One. 2012;7:e42971. doi: 10.1371/journal.pone.0042971. [DOI] [PMC free article] [PubMed] [Google Scholar]
- Deguchi K., Ayton P.M., Carapeti M., Kutok J.L., Snyder C.S., Williams I.R., Cross N.C.P., Glass C.K., Cleary M.L., Gilliland D.G. MOZ-TIF2-induced acute myeloid leukemia requires the MOZ nucleosome binding motif and TIF2-mediated recruitment of CBP. Cancer Cell. 2003;3:259–271. doi: 10.1016/s1535-6108(03)00051-5. [DOI] [PubMed] [Google Scholar]
- Dong Y.W., Wang R., Cai Q.Q., Qi B., Wu W., Zhang Y.H., Wu X.Z. Sulfatide epigenetically regulates miR-223 and promotes the migration of human hepatocellular carcinoma cells. J. Hepatol. 2014;60:792–801. doi: 10.1016/j.jhep.2013.12.004. [DOI] [PubMed] [Google Scholar]
- Esteyries S., Perot C., Adelaide J., Imbert M., Lagarde A., Pautas C., Olschwang S., Birnbaum D., Chaffanet M., Mozziconacci M.J. NCOA3, a new fusion partner for MOZ/MYST3 in M5 acute myeloid leukemia. Leukemia. 2008;22:663–665. doi: 10.1038/sj.leu.2404930. [DOI] [PubMed] [Google Scholar]
- Eyholzer M., Schmid S., Schardt J.A., Haefliger S., Mueller B.U., Pabst T. Complexity of miR-223 regulation by CEBPA in human AML. Leuk. Res. 2010;34:672–676. doi: 10.1016/j.leukres.2009.11.019. [DOI] [PubMed] [Google Scholar]
- Fazi F., Rosa A., Fatica A., Gelmetti V., de Marchis M.L., Nervi C., Bozzoni I. A minicircuitry comprised of microRNA-223 and transcription factors NFI-A and C/EBPalpha regulates human granulopoiesis. Cell. 2005;123:819–831. doi: 10.1016/j.cell.2005.09.023. [DOI] [PubMed] [Google Scholar]
- Forman H.J., Torres M. Reactive oxygen species and cell signaling: respiratory burst in macrophage signaling. Am. J. Respir. Crit. Care Med. 2002;166:S4–S8. doi: 10.1164/rccm.2206007. [DOI] [PubMed] [Google Scholar]
- Friedman A.D. Transcriptional control of granulocyte and monocyte development. Oncogene. 2007;26:6816–6828. doi: 10.1038/sj.onc.1210764. [DOI] [PubMed] [Google Scholar]
- Fukao T., Fukuda Y., Kiga K., Sharif J., Hino K., Enomoto Y., Kawamura A., Nakamura K., Takeuchi T., Tanabe M. An evolutionarily conserved mechanism for microRNA-223 expression revealed by microRNA gene profiling. Cell. 2007;129:617–631. doi: 10.1016/j.cell.2007.02.048. [DOI] [PubMed] [Google Scholar]
- Giles R.H., Dauwerse J.G., Breuning M.H. Detection of CBP and MOZ rearrangements in acute myeloid leukemia with t(8;16) Blood. 1998;92:78a. [Google Scholar]
- Gilicze A.B., Wiener Z., Toth S., Buzas E., Pallinger E., Falcone F.H., Falus A. Myeloid-derived microRNAs, miR-223, miR27a, and miR-652, are dominant players in myeloid regulation. Biomed. Res. Int. 2014;2014:870267. doi: 10.1155/2014/870267. [DOI] [PMC free article] [PubMed] [Google Scholar]
- Ginhoux F., Jung S. Monocytes and macrophages: developmental pathways and tissue homeostasis. Nat. Rev. Immunol. 2014;14:392–404. doi: 10.1038/nri3671. [DOI] [PubMed] [Google Scholar]
- Haneklaus M., Gerlic M., Kurowska-Stolarska M., Rainey A.A., Pich D., Mcinnes I.B., Hammerschmidt W., O'Neill L.A.J., Masters S.L. Cutting edge: miR-223 and EBV miR-BART15 regulate the NLRP3 inflammasome and IL-1 beta production. J. Immunol. 2012;189:3795–3799. doi: 10.4049/jimmunol.1200312. [DOI] [PubMed] [Google Scholar]
- Italiani P., Boraschi D. From monocytes to M1/M2 macrophages: phenotypical vs. functional differentiation. Front. Immunol. 2014;5:514. doi: 10.3389/fimmu.2014.00514. [DOI] [PMC free article] [PubMed] [Google Scholar]
- Ivashkiv L.B. Epigenetic regulation of macrophage polarization and function. Trends Immunol. 2013;34:216–223. doi: 10.1016/j.it.2012.11.001. [DOI] [PMC free article] [PubMed] [Google Scholar]
- Iwasaki H., Akashi K. Myeloid lineage commitment from the hematopoietic stem cell. Immunity. 2007;26:726–740. doi: 10.1016/j.immuni.2007.06.004. [DOI] [PubMed] [Google Scholar]
- Kang Y.J., Chen J., Otsuka M., Mols J., Ren S., Wang Y., Han J. Macrophage deletion of p38alpha partially impairs lipopolysaccharide-induced cellular activation. J. Immunol. 2008;180:5075–5082. doi: 10.4049/jimmunol.180.7.5075. [DOI] [PubMed] [Google Scholar]
- Katsumoto T., Aikawa Y., Iwama A., Ueda S., Ichikawa H., Ochiya T., Kitabayashi I. MOZ is essential for maintenance of hematopoietic stem cells. Genes Dev. 2006;20:1321–1330. doi: 10.1101/gad.1393106. [DOI] [PMC free article] [PubMed] [Google Scholar]
- Kitabayashi I., Aikawa Y., Nguyen L.A., Yokoyama A., Ohki M. Activation of AML1-mediated transcription by MOZ and inhibition by the MOZ-CBP fusion protein. EMBO J. 2001;20:7184–7196. doi: 10.1093/emboj/20.24.7184. [DOI] [PMC free article] [PubMed] [Google Scholar]
- Kuchenbauer F., Berg T., Mah S.M., Mirkovic-Hosle M., Salmi A., Ruschinann J., Muranyi A., Agiropoulos B., Rouhi A., Starczynowski D.T. Mir-223 is dispensable for the onset of acute myeloid leukemia. Blood. 2010;116:222–223. [Google Scholar]
- Larson-Casey J.L., Deshane J.S., Ryan A.J., Thannickal V.J., Carter A.B. Macrophage Akt1 kinase-mediated mitophagy modulates apoptosis resistance and pulmonary fibrosis. Immunity. 2016;44:582–596. doi: 10.1016/j.immuni.2016.01.001. [DOI] [PMC free article] [PubMed] [Google Scholar]
- Lawrence T., Natoli G. Transcriptional regulation of macrophage polarization: enabling diversity with identity. Nat. Rev. Immunol. 2011;11:750–761. doi: 10.1038/nri3088. [DOI] [PubMed] [Google Scholar]
- Li T., Morgan M.J., Choksi S., Zhang Y., Kim Y.S., Liu Z.G. MicroRNAs modulate the noncanonical transcription factor NF-kappa B pathway by regulating expression of the kinase IKK alpha during macrophage differentiation. Nat. Immunol. 2010;11:799–U48. doi: 10.1038/ni.1918. [DOI] [PMC free article] [PubMed] [Google Scholar]
- Liu Y.C., Zou X.B., Chai Y.F., Yao Y.M. Macrophage polarization in inflammatory diseases. Int. J. Biol. Sci. 2014;10:520–529. doi: 10.7150/ijbs.8879. [DOI] [PMC free article] [PubMed] [Google Scholar]
- Lu L.F., Liston A. MicroRNA in the immune system, microRNA as an immune system. Immunology. 2009;127:291–298. doi: 10.1111/j.1365-2567.2009.03092.x. [DOI] [PMC free article] [PubMed] [Google Scholar]
- Luyendyk J.P., Schabbauer G.A., Tencati M., Holscher T., Pawlinski R., Mackman N. Genetic analysis of the role of the PI3K-Akt pathway in lipopolysaccharide-induced cytokine and tissue factor gene expression in monocytes/macrophages. J. Immunol. 2008;180:4218–4226. doi: 10.4049/jimmunol.180.6.4218. [DOI] [PMC free article] [PubMed] [Google Scholar]
- Mor-Vaknin N., Punturieri A., Sitwala K., Markovitz D.M. Vimentin is secreted by activated macrophages. Nat. Cell Biol. 2003;5:59–63. doi: 10.1038/ncb898. [DOI] [PubMed] [Google Scholar]
- Mosser D.M., Edwards J.P. Exploring the full spectrum of macrophage activation. Nat. Rev. Immunol. 2008;8:958–969. doi: 10.1038/nri2448. [DOI] [PMC free article] [PubMed] [Google Scholar]
- Murray P.J., Wynn T.A. Obstacles and opportunities for understanding macrophage polarization. J. Leukoc. Biol. 2011;89:557–563. doi: 10.1189/jlb.0710409. [DOI] [PMC free article] [PubMed] [Google Scholar]
- Palmisano M., Grafone T., Renzulli M., Ottaviani E., Testoni N., Paolini S., Papayannidis C., Baccarani M., Martinelli G. Molecular and chromosomal alterations: new therapies for relapsed acute myeloid leukemia. Hematology. 2008;13:1–12. doi: 10.1179/102453308X315753. [DOI] [PubMed] [Google Scholar]
- Perez-Campo F.M., Costa G., Lie-A-Ling M., Kouskoff V., Lacaud G. The MYSTerious MOZ, a histone acetyltransferase with a key role in haematopoiesis. Immunology. 2013;139:161–165. doi: 10.1111/imm.12072. [DOI] [PMC free article] [PubMed] [Google Scholar]
- Pulikkan J.A., Dengler V., Peramangalam P.S., Zada A.A.P., Muller-Tidow C., Bohlander S.K., Tenen D.G., Behre G. Cell-cycle regulator E2F1 and microRNA-223 comprise an autoregulatory negative feedback loop in acute myeloid leukemia. Blood. 2010;115:1768–1778. doi: 10.1182/blood-2009-08-240101. [DOI] [PMC free article] [PubMed] [Google Scholar]
- Renneville A., Roumier C., Biggio V., Nibourel O., Boissel N., Fenaux P., Preudhomme C. Cooperating gene mutations in acute myeloid leukemia: a review of the literature. Leukemia. 2008;22:915–931. doi: 10.1038/leu.2008.19. [DOI] [PubMed] [Google Scholar]
- Rokudai S., Laptenko O., Arnal S.M., Taya Y., Kitabayashi I., Prives C. MOZ increases p53 acetylation and premature senescence through its complex formation with PML. Proc. Natl. Acad. Sci. U S A. 2013;110:3895–3900. doi: 10.1073/pnas.1300490110. [DOI] [PMC free article] [PubMed] [Google Scholar]
- Sheikh B.N., Yang Y.Q., Schreuder J., Nilsson S.K., Bilardi R., Carotta S., Mcrae H.M., Metcalf D., Voss A.K., Thomas T. MOZ (KAT6A) is essential for the maintenance of classically defined adult hematopoietic stem cells. Blood. 2016;128:2307–2318. doi: 10.1182/blood-2015-10-676072. [DOI] [PubMed] [Google Scholar]
- Snyder C.S., Glass C.K. MOZ is a histone acetyltransferase and encodes both transcriptional repression and transcriptional activation domains. Blood. 2000;96:673a. [Google Scholar]
- Troke P.J.F., Kindle K.B., Collins H.M., Heery D.M. MOZ fusion proteins in acute myeloid leukaemia. Transcription. 2006;73:23–39. doi: 10.1042/bss0730023. [DOI] [PubMed] [Google Scholar]
- Van den Bossche J., Laoui D., Naessens T., Smits H.H., Hokke C.H., Stijlemans B., Grooten J., de Baetselier P., van Ginderachter J.A. E-cadherin expression in macrophages dampens their inflammatory responsiveness in vitro, but does not modulate M2-regulated pathologies in vivo. Sci. Rep. 2015;5:12599. doi: 10.1038/srep12599. [DOI] [PMC free article] [PubMed] [Google Scholar]
- Varol C., Mildner A., Jung S. Macrophages: development and tissue specialization. Annu. Rev. Immunol. 2015;33:643–675. doi: 10.1146/annurev-immunol-032414-112220. [DOI] [PubMed] [Google Scholar]
- Wang N., Liang H.W., Zen K. Molecular mechanisms that influence the macrophage M1-M2 polarization balance. Front. Immunol. 2014;5:614. doi: 10.3389/fimmu.2014.00614. [DOI] [PMC free article] [PubMed] [Google Scholar]
- Zhou H., Xiao J., Wu N., Liu C., Xu J., Liu F., Wu L. MicroRNA-223 regulates the differentiation and function of intestinal dendritic cells and macrophages by targeting C/EBPbeta. Cell Rep. 2015;13:1149–1160. doi: 10.1016/j.celrep.2015.09.073. [DOI] [PubMed] [Google Scholar]
Associated Data
This section collects any data citations, data availability statements, or supplementary materials included in this article.