Abstract
Objective:
Oxidative stress plays an important role in the onset of many neuronal and peripheral disorders. We examined the feasibility of obtaining semiquantitative fluorescent images of reactive oxygen species (ROS) generation in mouse brain and kidney utilizing a planar laser scanner and dihydroethidium (DHE).
Methods:
To investigate ROS generation in brain, sodium nitroprusside was injected into the striatum. Dihydroethidium was injected into the tail vein. After DHE injection, tissue slices were analyzed utilizing a planar laser scanner. For kidney study, cis-diamminedichloroplatinum [II] (cisplatin) was intraperitoneally administrated into mice.
Results:
Clear and semiquantitative fluorescent images of ROS generation in the mouse brain and kidney were obtained. Furthermore, the fluorescence intensity was stable and not affected by fading. Sodium nitroprusside induced approximately 6 times the fluorescence accumulation in the brain. Cisplatin caused renal injury in all mice, and in comparison with control mice, more than 10 times fluorescence accumulation was observed in the renal medulla with tubular necrosis and vacuolization.
Conclusions:
We successfully obtained ex vivo semiquantitative fluorescent images of ROS generation utilizing a planar laser scanner and DHE. This simple method is useful for ROS detection in several ROS-related animal models and would be applicable to a variety of biochemical processes.
Keywords: fluorescent imaging, dihydroethidium, reactive oxygen species, sodium nitroprusside, cisplatin, ex vivo
Introduction
Reactive oxygen species (ROS) play an important role as regulatory mediators in signaling processes under physiological conditions, and relatively low ROS concentrations are maintained by the redox regulation system.1 However, the persistent production of excessive amounts of ROS induces a disturbance in redox homeostasis. Therefore, ROS are implicated in the onset of many neurodegenerative disorders and the development of adverse renal and/or cardiac side effects for cancer chemotherapy. Therefore, the development of the method for in vivo ROS imaging is an important subject for both basic and clinical research.
For in vivo ROS imaging, fluorescence, magnetic resonance, and radioisotopic imaging have been frequently used. Fluorescence molecular tomography (FMT) and multiphoton fluorescence microscopy have revolutionized in vivo fluorescence imaging. Both methodologies exhibit high sensitivity and high time resolution. Fluorescence molecular tomography is easily adaptable in small animal experiments. However, FMT is applicable only for subsurface imaging and its spatial resolution is low. Multiphoton fluorescence microscopy requires extremely advanced training to use. The apparatuses required to perform FMT and multiphoton fluorescence microscopy are considerably expensive. Magnetic resonance imaging exhibits high spatial resolution; however, this modality provides low sensitivity and the apparatuses is also expensive. With respect to radioisotopic imaging, we recently reported a novel radical trapping radiotracer, [3H]hydromethidine ([3H]DHM), to obtain ROS images.2 Utilizing [3H]DHM and autoradiography, we detected the ROS generation in the sodium nitroprusside (SNP)-injected mouse brain and showed that the radiotracer [3H]DHM is useful for ROS detection.2 However, since [3H]DHM is unstable in aqueous solution, animal experiments should be performed within 1 to 2 hours after the preparation of the injectate to ensure high radiochemical purity. A special facility for radioactive compounds is also required for the experiments.
In this study, we examined a simple procedure for imaging the ROS generation in intact animals utilizing a planar laser scanner, Fluoro-Imaging Analyzer System (FLA-7000; Fuji Film Co, Tokyo, Japan) and a fluorescent probe, dihydroethidium (DHE). An FLA-7000 is a fast and versatile laser scanner, which allows sensitive and quantitative measurements for both radiation and fluorescence. An FLA-7000 is commonly employed to obtain autoradiogram from tissue slices. However, only gel samples such as Western blotting were provided for quantitative measurements of fluorescence. Dihydroethidium, a DHM-related compound, is a lipophilic membrane-permeable compound that is converted to an oxidized membrane-impermeable charged compound by superoxide radicals. Dihydroethidium exhibits blue fluorescence in the cytosol until oxidized, when it intercalates within the DNA and stains the nucleus bright fluorescent red.3 When systemically administered to animals, DHE distributes rapidly into various tissues, including the brain, and, if not oxidized, is cleared from the tissues and excreted.4
For ROS generation model in intact animals, we adopted SNP-induced mouse brain damage and cis-diamminedichloroplatinum [II] (cisplatin)-induced renal damage. In both cases, we obtained images of excess ROS generation in lesioned areas.
Material and Methods
Animals
All the animal experiments were approved by the Institutional Animal Care and Use Committee, Division of Health Sciences, Graduate School of Medicine, Osaka University. Adult male ICR mice (8 weeks old) were obtained from Japan SLC Inc (Shizuoka, Japan). Animals were housed on a 12-hour light-dark cycle with free access to food and water.
Surgery and Microinjection of SNP
Surgery preparation and SNP (Sigma-Aldrich, St. Louis, Missouri) injection were performed according to previously described protocols.5,6 For implantation of guide cannulas in the striatum, the animal was anaesthetized with isoflurane (induction 5%, maintenance 2%). Next, the head of the animal was placed in a stereotaxic apparatus. Bilateral 26-gauge stainless steel guide cannulas fitted with 30-gauge stainless steel obturators were placed into the striatum at the following position: 1.75 mm lateral to the midline, 1.0 mm anterior to the bregma, and 1.0 mm below the cortical surface. The guide cannulas were then fixed to the skull with acrylic cement and stainless steel screw. After the surgery, the animals were allowed to recover for several days. Sodium nitroprusside, dissolved in saline, was injected (0.25 µL/min, 4 minutes) through a 30-gauge cannula (3.5 mm below the cortical surface) into the left striatum of each animal while the animal was awake. Simultaneously, saline solution was injected into the right striatum. Subsequently, animals were subjected to ex vivo DHE experiments.
Cisplatin Treatment
Cisplatin (30 mg/kg, dissolved in saline; Tokyo Chemical Industry Co, Ltd, Tokyo, Japan) was intraperitoneally administered. Control animals received an equal volume of saline instead of the cisplatin solution.
Dihydroethidium Administration and ROS Detection With a Planar Laser Scanner
Dihydroethidium (AdipoGen AG, Liestal, Switzerland) was administered through the tail vein at 60- or 120-minute postinjection of SNP or 3-day postinjection of cisplatin. The animals were then killed at 1 or 60 minutes (SNP), or 3 hours (cisplatin) by decapitation under brief anesthesia. The tissues were quickly removed and frozen. Tissue slices (20-µm thickness) were prepared using a cryostat and were scanned using a 532-nm excitation laser and a 580-nm long-pass detection filter with a Fluoro-Imaging Analyzer System (FLA-7000). The exposure time is a few nanoseconds per pixel. The fluorescence intensity in the slices were determined as the linear arbitrary units (LAUs) corrected for background ([LAU-background]/area [mm2]) with the Multi Gauge Analysis Software version 3.0 (Fuji Film Co). The background value was obtained from the fluorescence intensity of the region of glass slide where the tissue slice was absent.
Blood–Brain Barrier Permeability
Evans Blue (Wako Pure Chemical Industries, Ltd, Osaka, Japan) dye solution (2% wt/vol, 5 mL/kg) was administered through the tail vein at 1-hour postinjection of SNP (20 nmol). The stain was allowed to circulate for 1 hour, then the animals were deeply anaesthetized and perfused transcardially with ice-cold saline. The brains were removed and sliced by 1 mm width using Brain matrix (RWD Life Science Inc, San Diego, California).
Lipid Peroxidation Assay
Malondialdehyde (MDA) level in mouse striatum 2 hours after SNP (20 nmol) injection was analyzed using MDA assay kit (Northwest Life Science Specialties, LLC, Vancouver, Washington) according to the manufacturer’s instructions.
Immunohistochemistry
For immunohistochemical study, the animals were deeply anaesthetized at 120-minute postinjection of SNP (60 minutes after DHE administration) and perfused transcardially with ice-cold saline followed by 4% paraformaldehyde solution. The brains were removed and postfixed with paraformaldehyde solution, placed in a 30% sucrose solution. Serial coronal sections (20-µm thickness) were obtained with a cryostat and thaw-mounted on glass slide. The antibodies used in this study were the following: mouse monoclonal anti-neuron-specific nuclear protein (NeuN, 1:500; Merck Millipore Co, Darmstadt, Germany) and rabbit polyclonal anti-Iba1 antibody (Iba-1, 1:5000; Wako Pure Chemicals Industries, Ltd, Osaka, Japan). After overnight incubation of the brain sections with the antibodies at room temperature, the primary antibodies were visualized with Cy2 (1:500; Jackson ImmunoResearch, Newmarket, United Kingdom) or Alexa Fluor 488 (1:500; Thermo Fisher Scientific, Inc. Massachusetts) labeled secondary antibody. Fluorescent images were captured with a 3-laser confocal microscope (Nikon Co, Tokyo, Japan).
Histochemistry
The renal slices were stained with hematoxylin and eosin. The stained sections were then visualized using a Nikon Eclipse 80i microscope (Nikon Co), and the images were captured using the NIS-Elements BR 2.30 software (Nikon Co).
Statistical Analysis
All values were expressed as the mean (standard deviation; for each group). According to the Student paired or unpaired t test, P values less than .05 were considered to represent statistical significance.
Results
Reactive Oxygen Species Detection in the SNP-Treated Mouse Brain
Clear fluorescent images of ROS generation in the SNP-injected mouse brain were obtained utilizing the planar laser scanner. First, we adopted 60 minutes after the DHE injection as the measurement time, referencing previous reports.2,7 Sodium nitroprusside (20 nmol) induced fluorescent signals in both the striatum and cerebral cortex (Figure 1). The fluorescence intensity ([LAU-background]/area [mm2]) derived from the mouse brain slice in the SNP- and saline-injected striatum was 23 867 (9761) and 4083 (833), respectively (n = 5, P < .05, the Student paired t test). In the 3 nmol SNP-injected mouse brain, the fluorescence intensity in the SNP-injected striatum was comparable to that of the saline-injected striatum.
Figure 1.
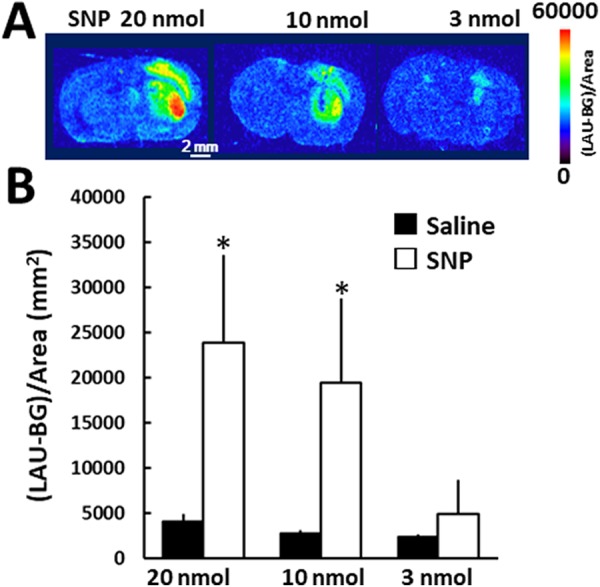
Fluorescence accumulation in the SNP-injected mouse brain. A, Sodium nitroprusside was injected into the striatum on the right side of the image, and saline was simultaneously injected into the contralateral striatum. Dihydroethidium was administered through the tail vein 60 minutes after the SNP injection. Bar = 2 mm. B, Quantitative analysis of the fluorescence images. The ROIs were identified based on highly fluorescent areas of the SNP-injected striatum and the contralateral area. Mean (standard deviation), n = 4-5. *denotes P < .05, between the saline- and the SNP-injected side using the Student paired t test. ROIs indicates regions of interest; SNP, sodium nitroprusside.
To confirm the stability of fluorescent quantitative values, we measured the same brain slices (SNP and saline injected brain) 40 times within 1 hour. There was no distinct difference in fluorescence intensity between the first and 40th obtained images (Supplemental Figure 1). The fluorescence intensity ([LAU-background]/area [mm2]) in each region of interest ranged from 3393 to 69 716 at the initial measurement. Compared to the initial measurements, the relative value of the 40th measurement for the initial measurement was 103.8% (3.7%). The result indicated that the fluorescence intensity is stable and not affected by the fading, which often occurs during microscopic observation.
While Hall et al obtained fluorescent images with FMT in 50 mg/kg of DHE-treated mice,7 in the present study, we found lower ratios between the SNP-treated striatum and the control (saline-treated) striatum at the same dosage than that at 5 mg/kg of DHE-treated mice, due to high fluorescent signals in the normal area (Supplemental Figure 2). Therefore, we chose 5 mg/kg of DHE for the present study.
Fluorescent Signal of the Early Period of DHE Administration
Figure 2 shows the fluorescent signals at early period of DHE administration (1 minute, 5 mg/kg). The fluorescent accumulation 1 minute after DHE administration was almost the half that of 60 minutes after DHE administration in the mouse brain. The fluorescence intensity ([LAU-background]/area [mm2]) derived from the mouse brain slice in the SNP- and saline-injected striatum was 11 748 (7001) and 2042 (529), respectively (n = 5, P < .05, the Student paired t test).
Figure 2.
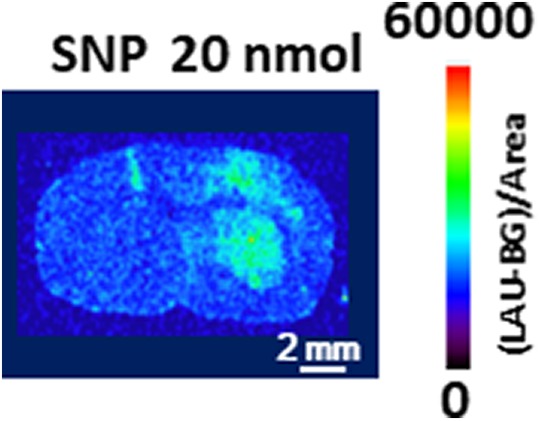
Fluorescence accumulation in the SNP-injected mouse brain 1 minute after dihydroethidium injection. Sodium nitroprusside was injected into the striatum on the right side of the image, and saline was simultaneously injected into the contralateral striatum. Dihydroethidium was administered through the tail vein at 120 minutes after the SNP injection. Bar = 2 mm. SNP indicates sodium nitroprusside.
Blood–Brain Barrier Permeability
The photographs of the SNP (20 nmol)-injected mouse brain was shown in Supplemental Figure 3. Sodium nitroprusside (20 nmol) injection did not induce the blood–brain barrier disruption 2 hours after SNP injection.
Immunohistochemistry
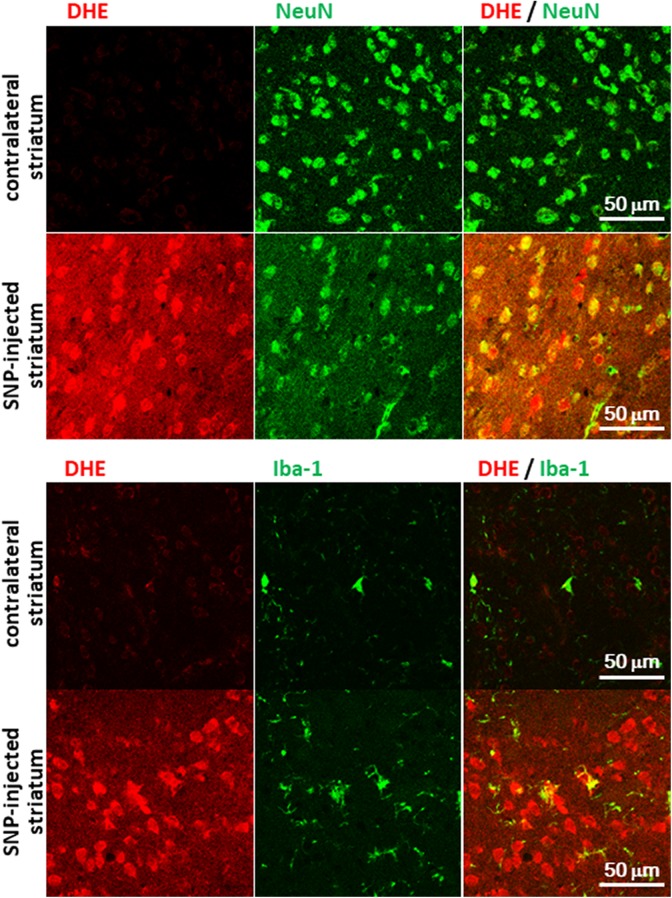
To confirm the fluorescence at a cellular level, we observed the SNP (20 nmol)-injected brain slice with immunohistochemical staining under a 3-laser confocal microscope. In brain slices from the SNP-injected striatum, an increase in fluorescence derived from DHE administration (5 mg/kg) was observed under the fluorescence microscope (Figure 3), as well as under the planar laser scanner. The majority of the DHE-positive cells were colocalized with the neuronal marker NeuN, and a few DHE-positive cells were colocalized with Iba-1, a marker for microglia (Figure 3).
Figure 3.
The SNP injected brain slice with immunohistochemical staining under a 3-laser confocal microscope. Bar = 50 μm. SNP indicates sodium nitroprusside.
Lipid Peroxidation in SNP-Injected Mouse Brain
Figure 4 shows the MDA levels 2 hours after the saline or SNP (20 nmol)-injected striatum. The MDA levels (nmol/g tissue) derived from the mouse brain in the SNP- and saline-injected striatum was 147.7 (39.7) and 70.8 (10.6), respectively (n = 4, P < .05, the Student paired t test).
Figure 4.
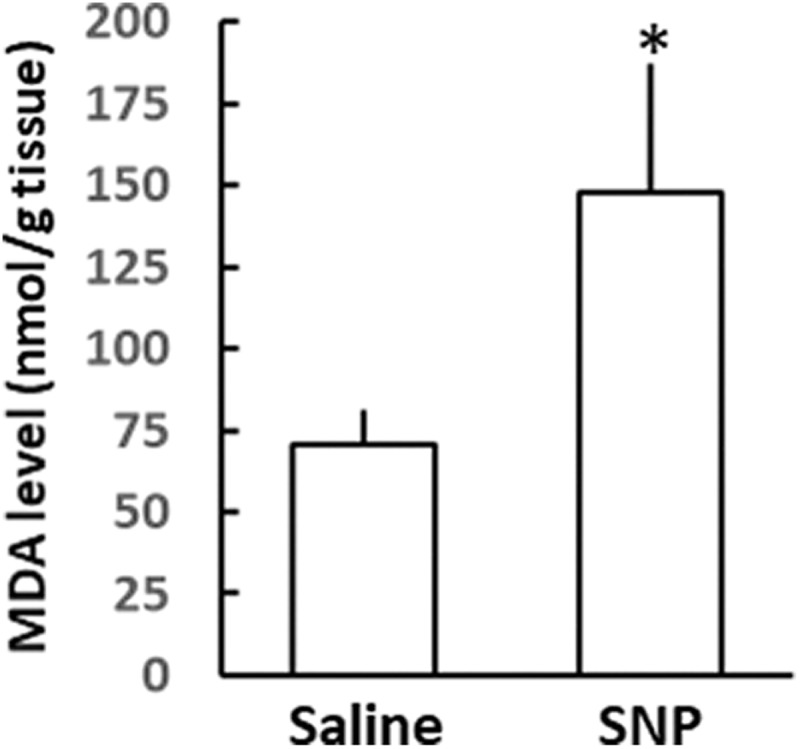
Lipid peroxidation in saline or SNP-injected mouse striatum. Malondialdehyde levels were measured at 2 hours after SNP injection. Mean (standard deviation), n = 4. *denotes P < .05, between the saline- and the SNP-injected side using the Student paired t test. SNP indicates sodium nitroprusside.
Reactive Oxygen Species Detection in the Cisplatin-Treated Mouse Kidney
A relatively homogeneous distribution of fluorescence was observed in saline-treated mouse kidneys (7471 [633] [LAU-background]/area [mm2], n = 4, Figure 5). The cisplatin treatment caused high fluorescence accumulation in 3 of 6 tested animals both in the renal medulla (10 8750 [23 175], n = 3, P < .05 vs control subjects) and the cortex (28 216 [4928], n = 3, P < .05 vs control subjects) as shown in Figure 5. However, half of the cisplatin-treated mice did not show significant alteration in fluorescence accumulation (8061 [2982], n = 3). Hematoxylin and eosin staining revealed that the renal medulla with strong fluorescence accumulation showed widespread tubular necrosis and vacuolization, while the renal medulla with normal fluorescence accumulation showed less tubular necrosis and swelling of the cells.
Figure 5.
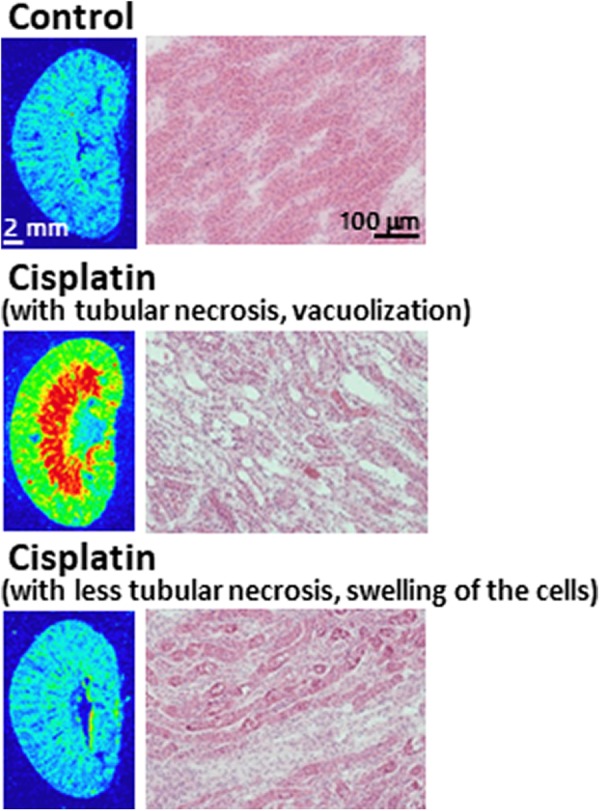
Accumulation of fluorescence in the cisplatin administered kidney. Kidney histology in hematoxylin and eosin–stained sections of the medulla.
Discussion
In this study, we applied a planar laser scanner to obtain semiquantitative ex vivo fluorescent images of ROS production in the brain and kidney with high spatial resolution (50 µm) by scanning a glass slide. While the planar laser scanner is frequently used for autoradiography, the planar laser scanner is exclusively used for gel samples such as Western blotting for fluorescent analyses. To the best of our knowledge, this study is the first report showing semiquantitative ex vivo fluorescent images utilizing the planar laser scanner. Fluorescence observation are generally hampered by fading, and the absolute value is often different from experiment to experiment. In the present study, the fluorescence fading was not observed during measurements. This maintenance of fluorescence signal was likely due to its short irradiation time, only a few nanoseconds per pixel. Due to an adjusted irradiation time, we can obtain a stable semiquantitative fluorescence values under the same experimental conditions. Additionally, we can easily evaluate the ROS generation between experimental conditions. Furthermore, this method allowed us to measure a number of glass slides on its sample scan stage (20 cm by 40 cm) in one scanning, which provides the quantifiable quality improvement especially in the comparison between slides from 1 individual.
Our simple ex vivo method to obtain fluorescent images and semiquantitative results closely resembles autoradiography, a radioisotopic imaging method. Both methodologies provide the same level of spatial resolution (50 µm). However, in the case of autoradiography, it is necessary to collect the radiation data on the imaging plate before image acquisition. It took 2 weeks to collect sufficient radiation data for ex vivo ROS imaging in our previous study using [3H]DHM, while we obtained the ex vivo fluorescent images within 10 minutes of forming tissue slices in the course of this study. Moreover, to accomplish autoradiography, a special facility for radioisotope handling is required. Hence, our ex vivo method of obtaining fluorescent images utilizing the planar laser scanner is a methodology that can obtain semiquantitative ex vivo images rapidly by a simple operation.
The iron ions in SNP are responsible for the ROS production through Fenton reaction.8 Microinjection of SNP into the striatum caused a neuronal cell death due to iron or iron-induced hydrogen peroxide.9,10 Our study also showed more than twice as much as lipid peroxides in mouse striatum 2 hours after SNP (20 nmol) injection. In 5 mg/kg of DHE-injected animals, we observed high fluorescence accumulation in neuronal cells in the SNP-treated striatum, as has been observed in our previous study using [3H]DHM.2 However, when a large amount of DHE was administrated (50 mg/kg), the fluorescence intensity ratios between the SNP-treated striatum and the saline-treated striatum was reduced, due to higher background intensity caused by the slow elimination rate of the fluorescent probe from the brain. In this study, we also detected ex vivo ROS generation 1 minute after DHE administration in the SNP-injected mouse brain, though the fluorescent signal 1 minute after DHE is about half of that at 60 minutes. This short-term uptake and retention in brain is useful for monitoring dynamic changes in ROS generation in an acute progressive disease such as cerebral infarction. In addition, it is also useful for rapid assessment of therapy.
For taking ROS images in the kidney, we selected 3 hours after the DHE injection as the measurement time. Because kidneys are the principal organs for excreting water-soluble substances, DHE and its metabolites in the kidney are expected to be retained longer than that in brain. Our previous report also shows that the renal radioactivity at 60 minutes after the [3H]DHM injection is approximately 10 times higher than those in the brain2 and the fluorescence intensities in normal mice kidneys were reduced to approximately 50% and 30% at 3 and 6 hours after the DHE injection, in comparison with the value at 1 hour after the DHE injection (data not shown). The excessive ROS generation images were obtained in the renal medulla and cortex with widespread tubular necrosis and vacuolization, as revealed by hematoxylin and eosin staining. Kidneys with less tubular necrosis, swelling of the cells, conversely showed no significant alteration in fluorescence accumulation. These individual differences of fluorescence accumulation in cisplatin-treated mice corresponded to the severity of renal damage. Our study shows that ROS generation induced by peripheral neurotoxicity is also visualized utilizing the planar laser scanner and DHE. Furthermore, we found it possible to estimate ROS generation by the degree of cell damage. In this study, we applied an acute kidney injury model using a single high dose of cisplatin to estimate ROS generation. A chronic kidney disease model using repeated low dosing of cisplatin11 is an important issue for future study.
Although our ROS imaging utilizing the planar laser scanner cannot provide subcellular spatial resolution and high temporal resolution as obtained using multiphoton fluorescence microscopy, this ex vivo imaging system allows us to detect and quantitate the fluorescence signals inside the tissue greater than 5 mm from its surface, having a spatial resolution without anesthesia. Anesthetics cause alteration in physiological responses12 and cerebral blood flow and metabolism13 and often exhibit neuroprotective effects after traumatic brain injury.14 Therefore, a method for convenient, quantitative fluorescence measurement of conscious animals is useful.
Here, we described a simple method for semiquantitative ROS imaging in living animals with the fluorescent probe DHE. Many fluorescent probes that can be used for in vivo fluorescence imaging have been developed. This ex vivo imaging procedure is readily translatable to other fluorescence probes and animal disease models and can be widely applied for other biological process imaging. Multitracer techniques with both fluorescent-labeled and radiolabeled probes in the same animal would allow more detailed analysis of the diseased states of the animals even with wide individual variations, such as in cerebral ischemia. Recently, fluorescent imaging in clinical surgery is being used. Our simple method for quantitative fluorescence imaging in small animals will mediate between clinical evidence and basic research.
From the current data, DHE has been demonstrated to be suitable probe for ex vivo ROS detection in both the brain and peripheral tissue. Unfortunately, the planar laser scanner is applied only for ex vivo imaging. For in vivo imaging, development of DHE radiolabeled analogs for positron-emission tomography or single-photon emission computerized tomography is also required. Recently novel positron-emission tomography probes for detecting ROS in central nervous system15 and heart16 is reported. And we are presently working on these projects.
Conclusions
The present study shows validity of ex vivo semiquantitative fluorescent images of ROS generation utilizing the planar laser scanner and DHE. This simple method for ROS detection in awake freely moving animals is useful in several ROS-related animal models and for studying physiological and pathological role of ROS. Our method would be applicable to a variety of biological processes.
Supplemental Material
Supplemental Material, Supplemental_Figure_1,2,3 for A Simple Ex Vivo Semiquantitative Fluorescent Imaging Utilizing Planar Laser Scanner: Detection of Reactive Oxygen Species Generation in Mouse Brain and Kidney by Rie Hosoi, Sota Sato, Miho Shukuri, Yuka Fujii, Kenichiro Todoroki, Yasushi Arano, Toshihiro Sakai, and Osamu Inoue in Molecular Imaging
Acknowledgments
The authors thank Dr Tomoko Namba (Osaka University) and Dr Masaru Horio (Osaka University) for their helpful suggestions about histochemical study in kidney.
Authors’ Note: All animal studies were approved by the Institutional Animal Care and Use Committee, Division of Health Sciences, Graduate School of Medicine, Osaka University. All applicable international, national, and/or institutional guidelines for the care and use of animals were followed.
Declaration of Conflicting Interests: The author(s) declared no potential conflicts of interest with respect to the research, authorship, and/or publication of this article.
Funding: The author(s) disclosed receipt of the following financial support for the research, authorship, and/or publication of this article: This work was supported by the JSPS KAKENHI Grant Number JP15K09956.
Supplemental Material: Supplemental material for this article is available online.
References
- 1. Dröge W. Free radicals in the physiological control of cell function. Physiol Rev. 2002;82(1):47–95. [DOI] [PubMed] [Google Scholar]
- 2. Abe K, Takai N, Fukumoto K, et al. In vivo imaging of reactive oxygen species in mouse brain by using [3 H]hydromethidine as a potential radical trapping radiotracer. J Cereb Blood Flow Metab. 2014;34(12):1907–1913. [DOI] [PMC free article] [PubMed] [Google Scholar]
- 3. Bucana C, Saiki I, Nayar R. Uptake and accumulation of the vital dye hydroethidine in neoplastic cells. J Histochem Cytochem. 1986;34(9):1109–1115. [DOI] [PubMed] [Google Scholar]
- 4. Murakami K, Kondo T, Kawase M, et al. Mitochondrial susceptibility to oxidative stress exacerbates cerebral infarction that follows permanent focal cerebral ischemia in mutant mice with manganese superoxide dismutase deficiency. J Neurosci. 1998;18(1):205–213. [DOI] [PMC free article] [PubMed] [Google Scholar]
- 5. Inoue O, Yanamoto K, Fujiwara Y, Hosoi R, Kobayashi K, Tsukada H. Sensitivities of benzodiazepine receptor binding and muscarinic acetylcholine receptor binding for the detection of neural cell death caused by sodium nitroprusside microinjection in rat brain. Synapse. 2003;49(2):134–141. [DOI] [PubMed] [Google Scholar]
- 6. Hosoi R, Okada M, Hatazawa J, Gee A, Inoue O. Effect of astrocytic energy metabolism depressant on 14C-acetate uptake in intact rat brain. J Cereb Blood Flow Metab. 2004;24(2):188–190. [DOI] [PubMed] [Google Scholar]
- 7. Hall DJ, Han SH, Chepetan A, Inui EG, Rogers M, Dugan LL. Dynamic optical imaging of metabolic and NADPH oxidase-derived superoxide in live mouse brain using fluorescence lifetime unmixing. J Cereb Blood Flow Metab. 2012;32(1):23–32. [DOI] [PMC free article] [PubMed] [Google Scholar]
- 8. Rauhala P, Khaldi A, Mohanakumar KP, Chiueh CC. Apparent role of hydroxyl radicals in oxidative brain injury induced by sodium nitroprusside. Free Radic Biol Med. 1998;24(7-8):1065–1073. [DOI] [PubMed] [Google Scholar]
- 9. Yanamoto K, Hosoi R, Uesaka Y, Abe K, Tsukada H, Inoue O. Intrastriatal microinjection of sodium nitroprusside induces cell death and reduces binding of dopaminergic receptors. Synapse. 2003;50(2):137–143. [DOI] [PubMed] [Google Scholar]
- 10. Nazari QA, Mizuno K, Kume T, Takada-Takatori Y, Izumi Y, Akaike A. In vivo brain oxidative stress model induced by microinjection of sodium nitroprusside in mice. J Pharmacol Sci. 2012;120(2):105–111. [DOI] [PubMed] [Google Scholar]
- 11. Sharp CN, Doll MA, Dupre TV, et al. Repeated administration of low-dose cisplatin in mice induces fibrosis. Am J Physiol Renal Physiol. 2016;310:F560–F568. [DOI] [PMC free article] [PubMed] [Google Scholar]
- 12. Hosoi R, Matsumura A, Mizokawa S, et al. MicroPET detection of enhanced 18F-FDG utilization by PKA inhibitor in awake rat brain. Brain Res. 2005;1039(1-2):199–202. [DOI] [PubMed] [Google Scholar]
- 13. Uematsu M, Takasawa M, Hosoi R, Inoue O. Uncoupling of flow and metabolism by chloral hydrate: a rat in-vivo autoradiographic study. Neuroreport. 2009;20(3):219–222. [DOI] [PubMed] [Google Scholar]
- 14. Statler KD, Kochanek PM, Dixon CE. Isoflurane improves long-term neurologic outcome versus fentanyl after traumatic brain injury in rats. J Neurotrauma. 2000;17(12):1179–1189. [DOI] [PubMed] [Google Scholar]
- 15. Wilson AA, Sadovski O, Nobrega JN, et al. Evaluation of a novel radiotracer for positron emission tomography imaging of reactive oxygen species in the central nervous system. Nucl Med Biol. 2017;53:14–20. [DOI] [PubMed] [Google Scholar]
- 16. Chu W, Chepetan A, Zhou D, et al. Development of a PET radiotracer for non-invasive imaging of the reactive oxygen species, superoxide, in vivo. Org Biomol Chem. 2014;12(25):4421–4431. [DOI] [PMC free article] [PubMed] [Google Scholar]
Associated Data
This section collects any data citations, data availability statements, or supplementary materials included in this article.
Supplementary Materials
Supplemental Material, Supplemental_Figure_1,2,3 for A Simple Ex Vivo Semiquantitative Fluorescent Imaging Utilizing Planar Laser Scanner: Detection of Reactive Oxygen Species Generation in Mouse Brain and Kidney by Rie Hosoi, Sota Sato, Miho Shukuri, Yuka Fujii, Kenichiro Todoroki, Yasushi Arano, Toshihiro Sakai, and Osamu Inoue in Molecular Imaging


