

Abstract

Real-time, isothermal, digital nucleic acid amplification is emerging as an attractive approach for a multitude of applications including diagnostics, mechanistic studies, and assay optimization. Unfortunately, there is no commercially available and affordable real-time, digital instrument validated for isothermal amplification; thus, most researchers have not been able to apply digital, real-time approaches to isothermal amplification. Here, we generate an approach to real-time digital loop-mediated isothermal amplification (LAMP) using commercially available microfluidic chips and reagents and open-source components. We demonstrate this approach by testing variables that influence LAMP reaction speed and the probability of detection. By analyzing the interplay of amplification efficiency, background, and speed of amplification, this real-time digital method enabled us to test enzymatic performance over a range of temperatures, generating high-precision kinetic and end-point measurements. We were able to identify the unique optimal temperature for two polymerase enzymes while accounting for amplification efficiency, nonspecific background, and time to threshold. We validated this digital LAMP assay and pipeline by performing a phenotypic antibiotic susceptibility test on 17 archived clinical urine samples from patients diagnosed with urinary tract infections. We provide all the necessary workflows to perform digital LAMP using standard laboratory equipment and commercially available materials. This real-time digital approach will be useful to others in the future to understand the fundamentals of isothermal chemistries, including which components determine amplification fate, reaction speed, and enzymatic performance. Researchers can also adapt this pipeline, which uses only standard equipment and commercial components, to quickly study and optimize assays using precise, real-time digital quantification, accelerating development of critically needed diagnostics.
In this paper, we describe a methodology to use commercially available chips, reagents, and microscopes to perform real-time digital LAMP. We use this methodology to perform a mechanistic study of digital isothermal amplification and apply the lessons learned to perform a phenotypic antibiotic susceptibility test (AST).
Microfluidics-based diagnostics for infectious diseases are advancing as a result of using nucleic acid testing, making them amenable to the point of care (POC) and limited-resource settings where they will have clinical impact. Isothermal amplification methods in particular show promise for simplifying nucleic acid-based POC diagnostics by circumventing the stringent thermal cycling requirements of PCR.1 One isothermal method that is being actively pursued in bioanalytical chemistry and the field of diagnostics is loop-mediated isothermal amplification (LAMP).2−6
LAMP and other isothermal technologies are fast and sensitive, but when performed in a bulk format in microliter volumes (e.g., in a tube), they provide only semiquantitative (log-scale) resolution or presence/absence measurements.7−15 As a result, when optimizing an assay, it is difficult to quantify how small changes in assay conditions (e.g., in primers, reagents, or temperature) impact the reaction’s speed and analytical sensitivity. To reliably understand these effects with high precision would require hundreds of bulk experiments per condition.16 For the field to be able to take full advantage of the capabilities of LAMP, researchers need to be able to optimize reaction conditions by understanding and testing the variables that may influence reaction speed and probability of detection. Furthermore, the semiquantitative measurements yielded by bulk isothermal methods are insufficient for analyses requiring precise quantification, such as phenotypic antibiotic susceptibility testing.17,18
These problems can be solved using “digital” approaches, which partition single target molecules in large numbers of compartments and give a binary (presence/absence) readout for each compartment. These “digital” approaches thus allow determination of the efficiency of the amplification reaction19 and provide absolute quantification with high resolution. Digital isothermal measurements have been used to quantify viral load for HCV,16,20,21 HIV,19,20 and influenza,22 perform bacterial enumeration,23−25 optimize primers,16 and test for phenotypic antibiotic susceptibility18 using LAMP18−28 and RPA.29
Real-time digital formats are especially valuable for examining the variables that most affect nonspecific amplification and the speed of amplification. Many excellent approaches for end-point19,20,22−28 and real-time16,18,21 digital LAMP (dLAMP) have been published. Despite the value that real-time dLAMP can bring to diagnostics, this method is difficult to implement, especially for those without a background in microelectromechanical systems or microfluidics, because there is no commercial system for real-time, digital isothermal amplification. To achieve statistical significance, a meaningful study might require dozens of experiments; such studies are difficult to perform without a commercial source of chips. Consequently, the few LAMP mechanistic studies that have been performed were not done with high precision. Further, those who would most benefit from optimized digital isothermal reactions (e.g., those working on POC diagnostics) cannot efficiently improve them.
Here, we demonstrate how to generate high-precision kinetic and end-point measurements using a real-time dLAMP assay that is performed completely with commercially available and open-source components (Figure 1). We use this real-time information to investigate dLAMP reactions mechanistically, including the interplay of efficiency, speed, and background amplification as a function of reaction temperature and time on two enzymes. To illustrate one application of using real-time dLAMP to improve a clinically relevant assay, we optimized the assay conditions for a phenotypic AST using the real-time dLAMP pipeline and used the optimized protocol to compare our AST of 17 clinical urine samples to the gold-standard method.
Figure 1.
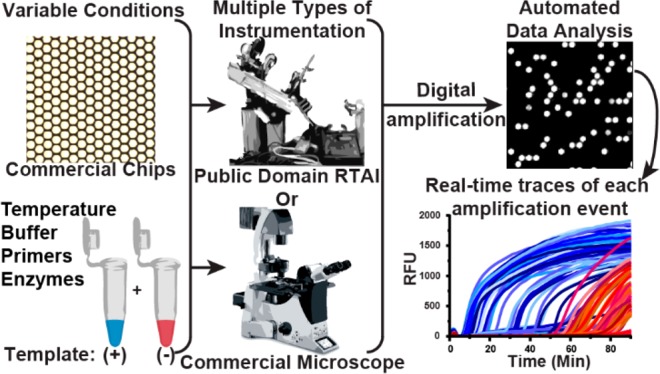
A schematic of the pipeline for performing multiplexed, real-time, digital loop-mediated isothermal amplification (LAMP) using only commercially available and/or open source components. Microfluidic chips and reagents (e.g., primers, enzymes, buffer composition) can be purchased commercially. Multiple instrument configurations can be used to capture results, e.g., a customized real-time instrument (instructions for building publicly available30) or any commercial microscope. Data analysis is automated using a MATLAB script (Supporting Information, S-I).
Experimental Section
Microfluidic chips used in this paper were sourced from Applied Biosystems, Foster City, CA, USA, ref A26316, “QuantStudio 3D Digital PCR 20k Chip Kit V2.”
LAMP Reagents
Our amplification target was the Escherichia coli 23S ribosomal gene, which we used previously as a target to perform rapid AST on clinical samples.18 Primers were purchased through Integrated DNA Technologies (San Diego, CA, USA) and were described previously.18 Final primer concentrations were identical for all experiments: 1.6 μM FIP/BIP, 0.2 μM FOP/BOP, and 0.4 μM LoopF/LoopB.
LAMP experiments using Bst 3.0 (Figure 2; Figure 3b,d,e,f,h–j; Figure 4) contained the following final concentrations, optimized previously:18 1× Isothermal Amplification Buffer II (New England BioLabs (NEB), Ipswich, MA, USA; ref B0374S, containing 20 mM Tris-HCl 10 mM (NH4)2SO4, 150 mM KCl, 2 mM MgSO4, 0.1% Tween 20 pH 8.8 at 25 °C), 4 mM additional MgSO4 (beyond 2 mM from buffer), 1.4 mM Deoxynucleotide Solution Mix. Primers: 1.6 μM FIP/BIP, 0.2 μM FOP/BOP, and 0.4 μM LoopF/LoopB, 1 mg/mL BSA (New England BioLabs, ref B90005), 320 U/mL Bst 3.0, Ambion RNase cocktail (ThermoFisher, Waltham, MA, USA; ref AM2286, 5 U/mL RNase A, 400 U/mL TNase T1), 2 μM SYTO 9 (ThermoFisher, ref S34854), and approximately 660 copies/μL template in Ambion nuclease-free water (ThermoFisher, ref AM9932).
Figure 2.
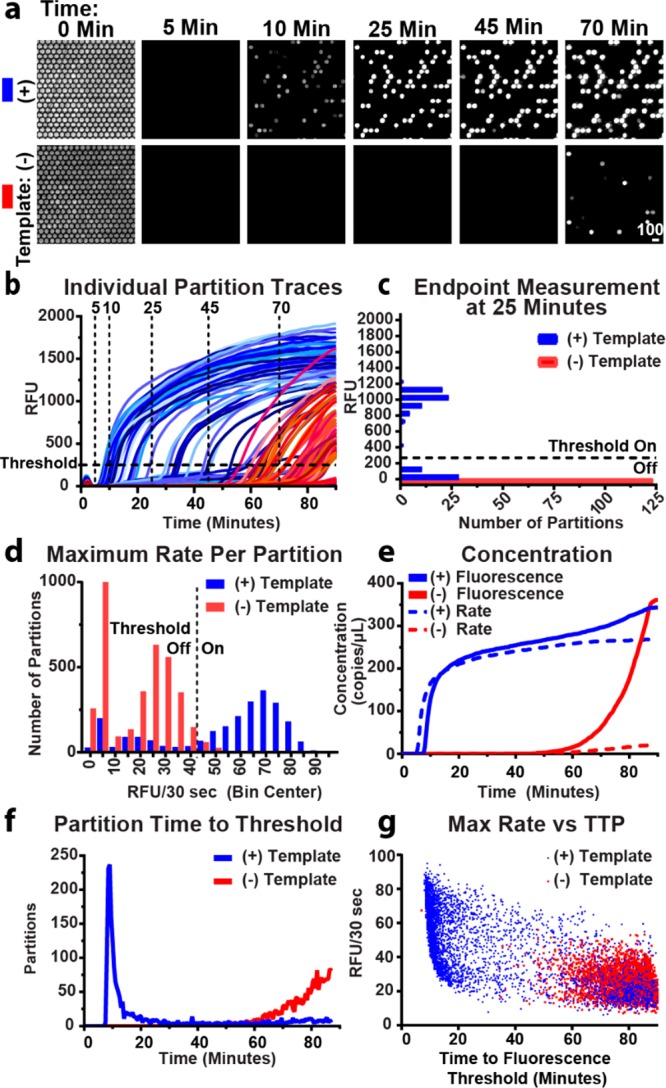
Experimental demonstration of the real-time digital LAMP (dLAMP) approach using the commercially available enzyme Bst 3.0. Experiments were run at 70 °C and imaged using a commercial microscope. (a) A time course of fluorescence images from a subset of 350 partitions out of 20000 partitions undergoing dLAMP reactions (intensity range 920–1705 RFU). (b) Fluorescence intensity for a subset of partitions over time. Blue traces indicate partitions containing template; red traces indicate fluorescence in the absence of template (i.e., nonspecific amplification). Partitions turn “on” at the time point when the curve passes the threshold at 250 RFU. Vertical traces correspond to time points illustrated in (a) and generate end-point measurements. (c) An “end-point” measurement taken on a subset of partitions at 25 min. Bin width is 100 RFU. Fluorescence threshold is 250 RFU. (d) A histogram of the maximum observed change in fluorescence of individual partitions using the full chip. Rate threshold is 45 RFU/30 s. (e) Change in observed bulk concentration over time from the full chip using fluorescence intensity as threshold (solid lines) and rate (dashed lines). (f) Time at which individual partitions in (b) cross the fluorescence intensity threshold. (g) Maximum rate per partition plotted by time to fluorescence intensity threshold.
Figure 3.

Evaluation of reaction conditions (enzymes and temperature) using real-time digital LAMP. (a,b) Amplification efficiency (percent template copies detected out of copies loaded) of Bst 2.0 (a) and Bst 3.0 (b) as a function of temperature. Green boxes indicate the optimal temperature range for the greatest probability of template detection. (c,d) Nonspecific amplification in template-free buffer samples using Bst 2.0 (c) and Bst 3.0 (d) for conditions matching (a) and (b). (e,f) Distribution of time to fluorescence threshold using Bst 2.0 (e) and Bst 3.0 (f). (g) The fractional cumulative distribution function (CDF) compares the enzymes at their optimal temperatures (68 °C). (h) Fractional CDF plots of Bst 3.0 rate at three temperatures. Error bars are SD. For all data sets, N = 3 chips (technical replicates). CDF plots are the sum of three technical replicates.
Figure 4.

Phenotypic antibiotic susceptibility tests of 17 clinical urine samples from patients infected with a urinary tract infection containing E. coli. Susceptibility to the antibiotics nitrofurantoin and ciprofloxacin were tested using dLAMP conditions optimized using digital real-time experiments (Figure 3). Urine samples were exposed to media without antibiotic (control) or media with an antibiotic (treated) for 15 min, and then concentrations of nucleic acids were quantified to calculate a control:treated (C:T) ratio. Samples were categorized by dLAMP as susceptible (above the susceptibility threshold) or resistant (below the threshold). All samples were categorized in agreement with the clinical gold-standard method.
LAMP experiments using Bst 2.0 (Figure 3a,c,e,g) contained the following final concentrations, optimized as shown in Supporting Information, Figure S3: 1× Isothermal Amplification Buffer (New England BioLabs; ref B0537S, containing 20 mM Tris-HCl 10 mM (NH4)2SO4, 50 mM KCl, 2 mM MgSO4, 0.1% Tween 20 pH 8.8 at 25 °C), additional 6 mM MgSO4 (New England BioLabs; ref B1003S), 1.4 mM Deoxynucleotide Solution Mix (New England BioLabs; ref N0447S). Primers: 1.6 μM FIP/BIP, 0.2 μM FOP/BOP, and 0.4 μM LoopF/LoopB, 1 mg/mL BSA (New England BioLabs; ref B90005), 320 U/mL Bst 2.0 (New England BioLabs; ref M0537S), Ambion RNase cocktail (ThermoFisher, ref AM2286, 5 U/mL RNase A, 400 U/mL TNase T1), 2 μM SYTO 9 (ThermoFisher, ref S34854), and approximately 660 copies/μL template in Ambion nuclease-free water (ThermoFisher; ref AM9932).
Template E. coli DNA was extracted from exponential-phase cultures grown in BBL Brain–Heart Infusion media (BD, Franklin Lakes, NJ, USA; ref 221813) using QuickExtract DNA Extraction Solution (Lucigen, Middleton, WI, USA; ref QE09050) as described previously.18 Serial 10-fold dilutions were prepared in Tris-EDTA buffer (5 mM Tris-HCl, 0.5 mM EDTA, pH 8.0) containing 2 U/mL RNase A and 80 U/mL RNase T1 (ThermoFisher; ref AM2286). DNA dilutions were quantified as described previously18 using the QX200 droplet digital PCR (ddPCR) system (Bio-Rad Laboratories, Hercules, CA, USA).
Phenotypic Antibiotic Susceptibility Testing (AST) on Clinical Samples
For the phenotypic AST, we adopted a workflow described previously17,18 and used archived nucleic acid extractions from a previous study.18 Briefly, clinical urine samples from patients with urinary tract infections (UTI) were split and diluted into equal volumes of media with or without the presence of an antibiotic. Samples were incubated for 15 min at 37 °C, a nucleic acid extraction was performed, and these samples were archived at −80 °C until use. LAMP was performed on the archived samples to quantify the number of copies of the E. coli 23S ribosomal gene.
We tested our optimized assay on 17 archived clinical UTI samples containing ≥5 × 10⁴ CFU/mL E. coli that had been categorized previously using the gold-standard broth microdilution AST (five ciprofloxacin-susceptible, five ciprofloxacin-resistant, four nitrofurantoin-susceptible, and three nitrofurantoin-resistant).
We assessed samples as phenotypically “resistant” or “susceptible” by calculating the ratio of the concentration of 23S in the control and antibiotic-treated sample, which we call the control:treated (C:T) ratio. The C:T ratio was calculated 10 min after beginning to heat the LAMP reaction. A threshold of 1.1 was established previously,17,18 so samples with C:T ratios >1.1 indicated that there was DNA replication in the untreated (control) group but not in the antibiotic-treated samples; these samples were identified as susceptible to the antibiotic. Samples with C:T ratios of <1.1 indicated that DNA replication occurred in both the control and antibiotic-treated samples; these samples were identified as resistant to the antibiotic.
Results and Discussion
Workflow Summary of Real-Time Digital LAMP
To evaluate a pipeline for real-time dLAMP experiments, we chose commercially sourced microfluidic chips sold for end-point digital PCR applications. The chips consist of an array of 20000 uniform partitions (Figure 1), each 60 μm in diameter and an estimated 0.75 nL internal volume, which is similar to the volumes typically used in dLAMP.16,18,20−23,25,26,28 These chips are loaded by pipetting the sample mixture (in our case containing the LAMP reagents: buffer components, enzymes, template, and primers) into the plastic “blade” provided with the chips and dragging the blade at a 70–80° angle to the chip to load the sample mixture by capillarity. This is followed by drying and evaporation of the surface layer for 20 s at 40 °C and application of the immersion fluid. Manual loading requires some skill, although a machine can be purchased to perform the task; typically, we were able to load ∼18000 out of the 20000 partitions. We performed our evaluation using two different enzyme mixtures, Bst 2.0 and Bst 3.0. Our amplification target (Figure 1) was the E. coli 23S ribosomal gene that we previously used as a target to perform rapid AST on clinical samples.18
The instrumentation requirements for real-time isothermal capabilities include a heater that can hold a stable temperature and optical components with high spatial resolution that are capable of imaging the fluorescence intensity of the 20000 individual partitions of the chip over time (Figure 2a). Here, we investigated two approaches: using a standard laboratory microscope (Leicia DMI-6000B), and using the RTAI,30 which is composed of a thermocycler, optical components, a camera, and a light source.
We generated a custom MATLAB script to analyze the digital real-time data (details in Supporting Information, S-I). The software follows the change in fluorescence in individual partitions over time. From these data, we extracted each partition’s time to a fluorescence intensity threshold and calculated the bulk template concentration. In our demonstration, we loaded the acquired images into FIJI31 as a time-stack series and manually separated the images of the individual chips to be analyzed separately. To process each chip’s image stack, we used the custom MATLAB script that tracks the mean intensity of each partition over the course of each experiment. This script could be run with only minor modifications with images obtained from different instruments.
To calculate the bulk template concentration over time, we (1) identified the partitions that did or did not contain reaction solution, (2) tracked the partitions that met a minimum fluorescence intensity, and (3) used the previous information to calculate the concentration of template in the bulk solution.
A summary of the script is as follows: (i) load the images into memory, (ii) count the total number of partitions before heating, (iii) identify positive partitions after the conclusion of the experiment, (iv) track the intensity of positive partitions for each image frame, (v) apply Gaussian smoothing and baseline subtraction, (vi) save the data, and (vii) repeat for each image stack. The output of the script contains: the raw traces of individual partitions over time, baseline corrected traces of individual partitions over time (Figure 2b), the number of partitions exceeding the manually defined minimum fluorescence intensity threshold with time (Figure 2f), and the maximum relative rate in RFU per 30 s for individual partitions (Figure 2d). These data provide all the necessary information to conduct the analyses detailed in Figure 2.
Digital, Real-Time Experiments to Quantify LAMP Performance
We next sought to experimentally evaluate this pipeline (Figure 1). First, we established whether the fluorescence from LAMP reactions could be reliably measured from individual partitions over time (Figure 2a). We used LAMP reagents for Bst 3.0, commercial chips, a resistive heater held at 70 °C, and a commercial microscope. Although the microscope is capable of collecting all 20000 partitions on one chip in a single image, for simplicity, in Figure 2a, we cropped the image to include only 350 of the 20000 partitions. Before turning on the heater (t = 0), we measured the autofluorescence from SYTO 9 to quantify the total number of partitions loaded with reaction solution. (To calculate template concentration using the Poisson distribution,32,33 we must know the total number of partitions containing the reaction mixture.) Autofluorescence from SYTO 9 decreases as the chip is heated and is completely eliminated within 3 min. The heater used on the microscope reaches reaction temperature within 120 s. In less than 10 min, an increase in fluorescence was observed within some of the individual partitions, indicating amplification of individual template molecules inside those partitions. Because of the stochastic nature of amplification initiation, some of the partitions fluoresced later.
In the negative-control (no template) partitions, fluorescence was not observed for the first 45 min. However, we began to observe nonspecific amplification after ∼60 min. In these experiments, the negative control contains only 0.05× Tris-EDTA buffer in place of template and represents a best-case scenario. We attribute amplification in the absence of template to primer dimers and other nonspecific LAMP products.
Second, we asked if the signal from nonspecific amplification was sufficiently delayed to differentiate it from the signal arising from specific amplification in the presence of template. To answer this question, we generated real-time fluorescence curves by plotting the change in fluorescence of individual partitions as a function of time (Figure 2b). We observed specific amplification (blue curves) beginning to initiate at ∼7 min and nonspecific amplification beginning to initiate at ∼50 min (red curves) and concluded that we could discriminate specific and nonspecific amplification by time.
Third, we asked whether enzymatic heterogeneity16,21,34 of specific amplification can be quantified to differentiate specific from nonspecific amplification. We plotted the maximum change of fluorescence achieved by each partition of the full chip per 30 s interval (Figure 2d). For the negative-control sample (red bars), we observed nonspecific amplification following a bimodal distribution of rates, with a first peak with little to no rate of fluorescence increase and a second peak at ∼25 RFU per 30 s. For the sample containing template (blue bars), rates for specific amplification were heterogeneous and centered around a rate of 70 RFU/30 s. We note that in PCR, which is gated by temperature cycling, there is no equivalent concept of “rate” as long as replication of DNA occurs faster that the duration of each elongation step. We found in our dLAMP experiments that the rate of specific amplification was greater than nonspecific amplification. Hence, tracking amplification in real-time made it possible to distinguish true positives from false positives (nonspecific amplification).
Fourth, we asked if the distribution in time to fluorescence threshold is sufficiently narrow to discriminate specific and nonspecific amplification. By plotting the number of “on” partitions (i.e., partitions that crossed the fluorescence intensity threshold defined in Figure 2b) against time, we generated a distribution curve (Figure 2f) that illustrates the number of partitions that turn on per time point. This is related to the derivative of the change in concentration over time. This plot contains the time to threshold of all partitions within the entire chip, rather than a subset, to minimize sampling bias. In the sample containing template (blue curve), most partitions reached the threshold in 7–20 min, whereas the negative-control sample (red curve) had little nonspecific amplification until approximately 60 min. Graphing time to threshold (Figure 2f) illustrates the overall reaction’s speed (defined as the location of the peak or mode time to threshold) and efficiency (proportional to the area under the curve and illustrated in Figure 2e as the calculated concentration). In our experiment, the peak of the sample containing template was narrow and well separated from the nonspecific amplification of the negative control (Figure 2f), indicating sufficiently low heterogeneity in amplification rate and time to initiation of the reaction.
Fifth, we asked how the calculated bulk concentration changes over time. To answer this question, we generated end-point-style measurements for each 30 s time point and calculated how the concentration changed over time. To demonstrate how to generate a single end-point-style measurement, we selected one time point (25 min) and plotted RFU as a factor of the number of partitions (Figure 2c). Partitions were classified as either “on” (>250 RFU threshold) or “off” (<250 RFU threshold). Partitions that are defined as having turned “on” contain a template molecule that amplified, whereas partitions that are ”off” either lack a template molecule or have not yet begun amplification. The sum of the partitions passing the threshold out of the total number of partitions with solution was used to determine a precise bulk concentration of template in the sample using the Poisson equation, as has been documented elsewhere.32,33 We plotted the calculated concentration as it changed over time in Figure 2e (solid lines).
When the aim is to determine a precise concentration, we need to determine the best time at which to stop the assay. Deciding the best time to end the assay is complicated because each reaction initiates stochastically,16,21 causing the calculated concentration to asymptotically approach the true concentration (Figure 2e). It would be ideal for the calculated concentration to rapidly rise to the true bulk concentration and plateau near the true concentration; however, the reaction should be stopped before the rise in nonspecific amplification (observed in our example starting at 60 min; red curves, Figure 2e,f). We tested whether there is heterogeneity in amplification rate (i.e., whether partitions with slow amplification rates take longer to reach the fluorescence intensity threshold than partitions with fast amplification rates) and found that initiation time was stochastic, but the reaction rates for true and false positives were consistent (Figure 2g). Hence, two molecules could have the same TTP yet initiate at different moments, resulting in variable amplification rates.
Combining information about the concentration of template (Figure 2e) and the time it takes for partitions to turn “on” (Figure 2f) can be used to inform the choice of an optimal assay length for end-point measurements for situations where real-time quantification is not feasible. For example, in Figure 2, the optimal assay length for an end-point readout would be ∼45 min. This approach allows one to balance stochastic initiation of amplification, overcome enzymatic heterogeneity, and reduce the incidence of false positives caused by nonspecific amplification.
However, in cases where real-time measurements are desirable, thresholding by rate may be used to separate specific and nonspecific amplification. For example, to correct for the observed increase in nonspecific amplification (after 45 min), we implemented a threshold (Figure 2d) on the maximum rate per partition, thus eliminating some of the nonspecific amplification in both the presence and absence of template (compare solid and dashed lines in Figure 2e). For example, the measured value at 60 min is 280 copies per μL (solid line), and the corrected value is 258 copies per μL (dashed line). In the no-template control, at 60 min, the measured value is 16 copies per μL (solid line), whereas the corrected value is 3 copies per μL (dashed line). The correction is more pronounced at 80 min where nonspecific amplification is greater. At 80 min, the measured value in the presence of template is 325 copies per μL and the corrected value 266 copies per μL, indicating that almost 20% of the signal could arise from nonspecific amplification. In the absence of template, the uncorrected value at 80 min is 187 copies per μL, however if the rate is accounted for, then the value can be corrected to 16 copies per μL, thus eliminating the majority of the false positives.
Finally, we note that although we calculated template concentration, the value is precise but could be inaccurate if not all target molecules loaded into the chip undergo amplification (in other words, if efficiency of amplification is not 100%). Thus, we next sought to measure the absolute likelihood of detecting a molecule as a function of reaction condition.
Evaluation of the Effect of Temperature on dLAMP with Two Different Enzymes to Analyze the Interplay of Amplification Efficiency, Background, and Speed of Amplification
After establishing a protocol for generating real-time, digital measurements, we evaluated the absolute amplification efficiency of LAMP as a function of temperature for two different enzymes. We selected two commercial polymerases that worked well for us previously. Both enzymes are in silico homologues on the Bacillus stearothermophilus DNA polymerase I and large fragment. NEB describes Bst 3.0 as an improvement of Bst 2.0 by adding reverse transcriptase activity, increased amplification speed, and increased thermostability. We sought to understand the differences in performance between these two enzymes at the single-template level. For this experiment, we used the previously described RTAI.30 The field of view for this instrument is larger than a microscope, allowing up to six samples to be observed concurrently. Hence, both the positive and negative controls could be collected in triplicate simultaneously. We expect some differences in measurements made on different instruments as a result of differing camera sensitivities and differences in the heating mechanism. Indeed, when we ran a single-concentration amplification reaction under identical conditions and compared measurements from the microscope and the RTAI, we found that there was significant difference (P = 0.03) in amplification efficiency between the two instruments (Supporting Information, Figure S2), with the RTAI generating higher amplification efficiency. Hence, we performed all enzyme–performance comparisons on a single instrument.
Amplification Efficiency
First, we sought to establish the amplification efficiency of dLAMP, i.e., the fraction of template copies loaded that are detected (Figure 3a,b). We calculated the bulk concentration of template molecules from the digital measurement and plotted the observed template concentration as a fraction of template molecules loaded. To calculate the amplification efficiency, we determined template concentration using ddPCR and assumed all template molecules were amplified. Using the real-time component of our measurements, we plotted the percent of copies detected over time compared with ddPCR.
We next asked how temperature impacts amplification efficiency. In general, we observed greater amplification efficiency at longer amplification times, which aligned with our previous observation (Figure 2d,e). Second, when observing at a fixed time, increasing temperature increased amplification efficiency to an optimum (green box in Figure 3a,b) before activity decreased.
Several observations can be made by comparing the results from Bst 2.0 and Bst 3.0 (Figure 3a,b). Although Bst 2.0 and Bst 3.0 have an identical reported optimal incubation temperature in bulk (65 °C), we observed they had different optimal temperature ranges for amplification efficiency (Bst 2.0 at 66–68 °C; Bst 3.0 at 68–70 °C). We detected lower amplification efficiency at higher temperatures with Bst 2.0 compared with Bst 3.0. Bst 2.0 failed to amplify at 72 °C, whereas Bst 3.0 continued amplifying until 76 °C. At short amplification times, (such as 10 min), Bst 3.0 had greater amplification efficiency than Bst 2.0 (42.8% vs 20.8%, respectively). In contrast, at longer amplification times, such at 30 or 45 min, efficiency for the enzymes was similar (77.6% vs 71.5% at 45 min, respectively), although Bst 2.0 had slightly greater amplification efficiency than Bst 3.0.
We hypothesize that increased temperature improved amplification efficiency (presumably by increasing the breathing of dsDNA and facilitating primer annealing) until, at higher temperatures, a combination of enzyme denaturation or failure of the primers to anneal occurred. Our primers had melting temperatures ranging from 56–61 °C, when excluding the secondary FIP and BIP annealing regions, as calculated using OligoCalc.35 We found that chip-to-chip variability was extremely low. Relative error for Bst 2.0 at optimal temperature (68 °C) and 45 min of amplification was ∼2% (Figure 2a), whereas the predicted Poisson noise for a single chip is 0.7%. Achieving such high precision using bulk measurements would require hundreds of experiments. The low variability among these measurements indicates that we were correctly determining whether a partition contained solution and whether it amplified.
Nonspecific Background Amplification
Next, we quantified the amount of nonspecific amplification (Figure 3c,d) as a function of time and temperature. We plotted the number of wells that turned “on” in the absence of template relative to the total number of wells filled with LAMP solution. As previously stated, these nonspecific amplification reactions included buffer in place of template and represented a best-case scenario. We concluded that at least for these idealized conditions, nonspecific amplification in dLAMP was extremely low. For example, a fraction of 0.001 could correspond to 20 partitions turning on from among a total of 20000 possible partitions. For both enzymes, we found the maximum fraction of nonspecific amplification per total partitions was 0.0012 for times 20 min or less. The highest fraction of nonspecific amplification observed was 0.017 at 45 min, corresponding to fewer than 350 nonspecific partitions of the 20000 total (Figure 3c,d). Furthermore, we observed that higher temperatures resulted in lower nonspecific amplification (Figure 3c,d). Finally, at extremely long amplification times (e.g., 60 min amplification, data not shown), Bst 2.0 had lower background than Bst 3.0.
Variations in Speed and Amplification Efficiency
Third, we quantified the variation in speed and amplification efficiency across partitions in the time to reach fluorescence intensity threshold (Figure 3e,f). We first plotted the percent copies detected as a function of time for each temperature. As described previously, these curves represent the distribution in the time to threshold across all partitions and thus illustrate the interplay of (i) detecting a molecule (area under the curve from zero to a given time corresponding to the values plotted in Figure 3a,b), (ii) the speed of the reaction (the time at which the peak reaches a maxima), and (iii) several parameters of peak width summarized in Supporting Information, Table S1. We hypothesize peak width is related to both the enzyme amplification rate, overall amplification efficiency, and the time at which the reaction initiates. Next, we plotted the peak time to threshold (Supporting Information, Figure S1). Images were collected in 30 s intervals, and we report the average of three trials. In some cases, the difference in time to threshold was less than the imaging time interval. For each time point, if fewer than 15 partitions (0.075% of total partitions) were “on,” that time point was not included in the calculation of the mode. For these measurements, at the start of the reaction, the heat block was at 25 °C and the time to threshold included the time for the heat block to come to reaction temperature (∼70 s). Hence, there will be minor differences (seconds) in the time for each reaction to reach the fixed temperature. We do not see evidence that this difference manifests in the mode time to positive (TTP) measurements.
In reactions with Bst 2.0, below 68 °C, mode TTP was narrowly clustered around 9.5 min. At 70 °C, mode TTP increased and the reaction failed to amplify beyond 72 °C. In reactions with Bst 3.0, the mode TTP decreased from 8.2 ± 0.3 (mode ± SD) min at 64 °C to 6.6 ± 0.3 min at 70 °C, then increased with increasing temperature until amplification failed for all partitions at temperatures ≥76 °C. In the negative controls for both enzymes (Supporting Information, Figure S1), amplification either failed or started after 75 min.
Several observations can be made by comparing the results from Figure 3e,f. We found that the optimal temperature for time to threshold corresponded with the optimal temperature for amplification efficiency (Figure 3a,b) and that the optimal temperatures also had the smallest tailing factors, full width at half-maximum (fwhm) and asymmetric factor (i.e., narrowest peak widths) (Figure 3e,f; Supporting Information, Table S1). At optimal efficiency, Bst 3.0 was approximately 2 min faster in mode TTP, had much narrower fwhm, smaller tailing factor, and lower asymmetry than Bst 2.0. Finally, as efficiency decreased, measurements of peak shape and width increased. To the best of our knowledge, this is the first published quantification that explicitly tests and quantifies the time dependence of LAMP efficiency using these enzymes. Real-time digital enables us to identify the time point at which the observed concentration most closely approximates the true concentration thus optimizing the assay duration.
Rates of Amplification (Specific and Nonspecific)
Fourth, we compared the rates of specific and nonspecific amplification between Bst 2.0 and Bst 3.0. The data shown represent the combined rates of three separate trials. We found that nonspecific amplification rates were similar for the two enzymes (Figure 3g, dashed lines), whereas in the presence of template, amplification rates were faster for Bst 2.0 than Bst 3.0 (Figure 3g, solid lines) despite lower efficiency at short times. Differences in camera sensitivity between the microscope (used for real-time images in Figure 2) and the RTAI (used for Figure 3) result in different apparent amplification rates.
We also examined the relationship between temperature, efficiency, and maximum rate. In the case of Bst 3.0, maximum reaction amplification rate does not correspond with optimal efficiency (Figure 3h). A temperature of 64 °C had the fastest amplification rates but suboptimal efficiency (57.3% at 45 min). Optimal amplification efficiency occurs at 68 °C (71.5% at 45 min) but slightly slower amplification rate than 64 °C. At 74 °C, we observed both poor efficiency (32.7% at 45 min) and the slowest reaction rate. We attribute this to a combination of decreased enzymatic velocity and decreased primer annealing. Additionally, we note that different thresholds for amplification rate would be needed for each temperature. This is expected given changes in enzymatic velocity.
Application of the Pipeline to a Phenotypic Antibiotic Susceptibility Test (AST) Using Clinical Samples
We next asked whether we could apply the output of this digital real-time pipeline to perform a rapid phenotypic AST. Specifically, we aimed to categorically sort clinical samples as phenotypically “susceptible” or “resistant” to an antibiotic in agreement with the gold-standard reference method. This study was constructed as a demonstration of the capability of the microfluidic chips and the value gained from using this digital real-time pipeline to optimize reaction conditions; it was not an assessment of the digital AST (dAST) methodology established previously.17,18 We selected the optimal dLAMP conditions for Bst 3.0 based on the measurements of mode TTP and amplification efficiency established in the previous experiments (Figure 3b), 70 °C and a reaction time of 10 min. We used archived clinical urine samples from patients diagnosed with urinary tract infections (UTI) containing E. coli. These samples had been categorized as phenotypically susceptible or resistant to the antibiotics ciprofloxacin or nitrofurantoin using the gold-standard (broth microdilution) method.18 We tested exactly 17 samples and observed 100% categorical agreement with the gold-standard method (0 major errors; 0 minor errors). We conclude that the pipeline presented in this paper performs well and could be used, among other applications, to optimize reaction conditions for speed and sensitivity and apply those conditions to a determination of phenotypic antibiotic susceptibility in clinical samples.
Conclusion
We have presented a pipeline to generate real-time, digital isothermal amplification measurements using only commercial and open-source components. We used this pipeline to examine how small changes in reaction conditions influence the interplay of LAMP efficiency, speed, and background by performing 124 real-time dLAMP experiments. As one practical application of this approach, we determined the optimal reaction conditions for a phenotypic test of antibiotic susceptibility using 17 clinical urine samples from patients diagnosed with urinary tract infections. In all cases, the results of the optimized dLAMP assays were in agreement with the clinical gold-standard AST.
These experiments validate that real-time digital measurements enable tests of enzymatic performance in dLAMP. Generally, we found that each enzyme had a unique optimal temperature for amplification efficiency (probability of detecting a target molecule) and for eliminating nonspecific amplification. This “optimal” temperature produced the fastest mode TTP and the narrowest, most symmetrical distribution curves; interestingly, the optimal temperature did not necessarily yield the fastest amplification rate. Together, these data suggest that amplification efficiency is an interplay of enzymatic rate, diffusive transport, and DNA breathing. When reactions are performed away from optimal temperature, the distribution curves broaden and decrease in total area, resulting in reduced overall amplification efficiency and slower mode TTP, whereas amplification rate decreases with increasing temperature. With regard to the specific enzymes in this study, although efficiency was similar at long amplification times (>20 min), Bst 3.0 had a faster mode TTP than Bst 2.0 by approximately 2 min and more narrow and symmetrical distribution curves. However, Bst 2.0 had faster amplification rates than Bst 3.0, so reactions with Bst 2.0 took longer to initiate but proceeded more rapidly. For both polymerases, nonspecific amplification in buffer was extremely low.
In the future, this pipeline can be used to understand the fundamental pieces of LAMP. The field of diagnostics would benefit from a thorough mechanistic study of LAMP by asking which components determine amplification fate and how components, such as primers and heating rate (Supporting Information, Figure S2), impact reaction and enzymatic speed. This pipeline makes such a mechanistic study possible. For example, in this study, we corrected the observed concentration by separating true positives from background amplification using rate and fluorescence, but we did not explore the origins of nonspecific amplicons, which deserves its own study and development of more precise tools for studies of nonspecific amplification. Finally, this pipeline can be extended to optimize other isothermal amplification chemistries that could be suited to other types of diagnostic assays.
Ultimately, this pipeline will make digital real-time measurements more accessible to researchers, even those who lack microfluidic expertise or specialized equipment. The commercially available chips and reagents used here could be coupled with many combinations of standard laboratory or field equipment such as a hot plate and a fluorescent stereoscope or a chemical heater and a cell phone camera. Although we believe the general trends found in this paper will extend to other primer sets, we hope this pipeline will enable others to study other primer sets and conditions of interest to them.
Acknowledgments
This research was supported in part by the Burroughs Wellcome Fund Innovation in Regulatory Science Award (to R.F.I.) and a grant from the Jacobs Institute for Molecular Engineering for Medicine. Research reported in this publication was also supported by the Department of Health and Human Services (HHS) Office of the Assistant Secretary for Preparedness and Response (ASPR) and the Wellcome Trust under the CARB-X program (federal award no. IDSEP160030-02); the content is solely the responsibility of the authors and does not necessarily represent the official views of the Department of HHS Office of the ASPR. This work is funded in part by CARB-X as a collaboration between Talis Biomedical Corporation and Caltech. This project benefited from the use of instrumentation at the Jim Hall Design and Prototyping Lab at the California Institute of Technology. We thank Travis Schlappi for performing the extractions of the archived clinical samples and Natasha Shelby for contributions to writing and editing this manuscript.
Supporting Information Available
The Supporting Information is available free of charge on the ACS Publications website at DOI: 10.1021/acs.analchem.8b04324.
Summary of MATLAB script functions, real-time data acquisition parameters, limitations of chips used, calculation of peak width metrics equations, mode time to positive, hardware and preheating considerations, optimization of Bst 2.0 buffer composition, and contributions of noncorresponding authors (PDF)
Author Contributions
All authors have given approval to the final version of the manuscript.
The authors declare the following competing financial interest(s): The technology described in this publication is the subject of a patent application filed by Caltech. R.F.I. has a financial interest in Talis Biomedical Corporation.
Supplementary Material
References
- Heid C. A.; Stevens J.; Livak K. J.; Williams P. M. Genome Res. 1996, 6, 986–994. 10.1101/gr.6.10.986. [DOI] [PubMed] [Google Scholar]
- Tanner N. A.; Zhang Y.; Evans T. C. BioTechniques 2012, 53, 81–89. 10.2144/0000113902. [DOI] [PubMed] [Google Scholar]
- Tanner N. A.; Zhang Y.; Evans T. C. BioTechniques 2015, 58, 59–68. 10.2144/000114253. [DOI] [PubMed] [Google Scholar]
- Notomi T.; Okayama H.; Masubuchi H.; Yonekawa T.; Watanabe K.; Amino N.; Hase T. Nucleic Acids Res. 2000, 28, e63. 10.1093/nar/28.12.e63. [DOI] [PMC free article] [PubMed] [Google Scholar]
- Tanner N. A.; Evans T. C. Curr. Protoc. Mol. Biol. 2014, 105, 15.14.11–15.14.14. 10.1002/0471142727.mb1514s105. [DOI] [PubMed] [Google Scholar]
- Becherer L.; Bakheit M.; Frischmann S.; Stinco S.; Borst N.; Zengerle R.; von Stetten F. Anal. Chem. 2018, 90, 4741–4748. 10.1021/acs.analchem.7b05371. [DOI] [PubMed] [Google Scholar]
- Aoi Y.; Hosogai M.; Tsuneda S. J. Biotechnol. 2006, 125, 484–491. 10.1016/j.jbiotec.2006.04.007. [DOI] [PubMed] [Google Scholar]
- Drame P. M.; Fink D. L.; Kamgno J.; Herrick J. A.; Nutman T. B. J. Clin. Microbiol. 2014, 52, 2071–2077. 10.1128/JCM.00525-14. [DOI] [PMC free article] [PubMed] [Google Scholar]
- Mori Y.; Kitao M.; Tomita N.; Notomi T. J. Biochem. Biophys. Methods 2004, 59, 145–157. 10.1016/j.jbbm.2003.12.005. [DOI] [PubMed] [Google Scholar]
- Ball C. S.; Light Y. K.; Koh C.-Y.; Wheeler S. S.; Coffey L. L.; Meagher R. J. Anal. Chem. 2016, 88, 3562–3568. 10.1021/acs.analchem.5b04054. [DOI] [PubMed] [Google Scholar]
- Calvert A. E.; Biggerstaff B. J.; Tanner N. A.; Lauterbach M.; Lanciotti R. S. PLoS One 2017, 12, e0185340 10.1371/journal.pone.0185340. [DOI] [PMC free article] [PubMed] [Google Scholar]
- Poole C. B.; Ettwiller L.; Tanner N. A.; Evans T. C. Jr.; Wanji S.; Carlow C. K. S. PLoS One 2015, 10, e0139286 10.1371/journal.pone.0139286. [DOI] [PMC free article] [PubMed] [Google Scholar]
- Poole C. B.; Tanner N. A.; Zhang Y.; Evans T. C. Jr.; Carlow C. K. S. PLoS Neglected Trop. Dis. 2012, 6, e1948 10.1371/journal.pntd.0001948. [DOI] [PMC free article] [PubMed] [Google Scholar]
- Wheeler S. S.; Ball C. S.; Langevin S. A.; Fang Y.; Coffey L. L.; Meagher R. J. PLoS One 2016, 11, e0147962 10.1371/journal.pone.0147962. [DOI] [PMC free article] [PubMed] [Google Scholar]
- Bhadra S.; Jiang Y. S.; Kumar M. R.; Johnson R. F.; Hensley L. E.; Ellington A. D. PLoS One 2015, 10, e0123126 10.1371/journal.pone.0123126. [DOI] [PMC free article] [PubMed] [Google Scholar]
- Khorosheva E. M.; Karymov M. A.; Selck D. A.; Ismagilov R. F. Nucleic Acids Res. 2016, 44, e10 10.1093/nar/gkv877. [DOI] [PMC free article] [PubMed] [Google Scholar]
- Schoepp N. G.; Khorosheva E. M.; Schlappi T. S.; Curtis M. S.; Humphries R. M.; Hindler J. A.; Ismagilov R. F. Angew. Chem., Int. Ed. 2016, 55, 9557–9561. 10.1002/anie.201602763. [DOI] [PMC free article] [PubMed] [Google Scholar]
- Schoepp N. G.; Schlappi T. S.; Curtis M. S.; Butkovich S. S.; Miller S.; Humphries R. M.; Ismagilov R. F. Sci. Transl. Med. 2017, 9, eaal3693 10.1126/scitranslmed.aal3693. [DOI] [PMC free article] [PubMed] [Google Scholar]
- Sun B.; Shen F.; McCalla S. E.; Kreutz J. E.; Karymov M. A.; Ismagilov R. F. Anal. Chem. 2013, 85, 1540–1546. 10.1021/ac3037206. [DOI] [PMC free article] [PubMed] [Google Scholar]
- Rodriguez-Manzano J.; Karymov M. A.; Begolo S.; Selck D. A.; Zhukov D. V.; Jue E.; Ismagilov R. F. ACS Nano 2016, 10, 3102–3113. 10.1021/acsnano.5b07338. [DOI] [PMC free article] [PubMed] [Google Scholar]
- Sun B.; Rodriguez-Manzano J.; Selck D. A.; Khorosheva E.; Karymov M. A.; Ismagilov R. F. Angew. Chem., Int. Ed. 2014, 53, 8088–8092. 10.1002/anie.201403035. [DOI] [PMC free article] [PubMed] [Google Scholar]
- Hu Y.; Xu P.; Luo J.; He H.; Du W. Anal. Chem. 2017, 89, 745–750. 10.1021/acs.analchem.6b03328. [DOI] [PubMed] [Google Scholar]
- Ma Y.-D.; Chang W.-H.; Luo K.; Wang C.-H.; Liu S.-Y.; Yen W.-H.; Lee G.-B. Biosens. Bioelectron. 2018, 99, 547–554. 10.1016/j.bios.2017.08.026. [DOI] [PubMed] [Google Scholar]
- Ma Y.-D.; Luo K.; Chang W.-H.; Lee G.-B. Lab Chip 2018, 18, 296–303. 10.1039/C7LC01004D. [DOI] [PubMed] [Google Scholar]
- Schuler F.; Siber C.; Hin S.; Wadle S.; Paust N.; Zengerle R.; von Stetten F. Anal. Methods 2016, 8, 2750–2755. 10.1039/C6AY00600K. [DOI] [Google Scholar]
- Gansen A.; Herrick A. M.; Dimov I. K.; Lee L. P.; Chiu D. T. Lab Chip 2012, 12, 2247–2254. 10.1039/c2lc21247a. [DOI] [PMC free article] [PubMed] [Google Scholar]
- Rane T. D.; Chen L.; Zec H. C.; Wang T.-H. Lab Chip 2015, 15, 776–782. 10.1039/C4LC01158A. [DOI] [PMC free article] [PubMed] [Google Scholar]
- Zhu Q.; Gao Y.; Yu B.; Ren H.; Qiu L.; Han S.; Jin W.; Jin Q.; Mu Y. Lab Chip 2012, 12, 4755–4763. 10.1039/c2lc40774d. [DOI] [PubMed] [Google Scholar]
- Shen F.; Davydova E. K.; Du W.; Kreutz J. E.; Piepenburg O.; Ismagilov R. F. Anal. Chem. 2011, 83, 3533–3540. 10.1021/ac200247e. [DOI] [PMC free article] [PubMed] [Google Scholar]
- Selck D. A.; Ismagilov R. F. PLoS One 2016, 11, e0163060 10.1371/journal.pone.0163060. [DOI] [PMC free article] [PubMed] [Google Scholar]
- Schindelin J.; Arganda-Carreras I.; Frise E.; Kaynig V.; Longair M.; Pietzsch T.; Preibisch S.; Rueden C.; Saalfeld S.; Schmid B.; Tinevez J.-Y.; White D. J.; Hartenstein V.; Eliceiri K.; Tomancak P.; Cardona A. Nat. Methods 2012, 9, 676. 10.1038/nmeth.2019. [DOI] [PMC free article] [PubMed] [Google Scholar]
- Kreutz J. E.; Munson T.; Huynh T.; Shen F.; Du W.; Ismagilov R. F. Anal. Chem. 2011, 83, 8158–8168. 10.1021/ac201658s. [DOI] [PMC free article] [PubMed] [Google Scholar]
- Rissin D. M.; Walt D. R. Nano Lett. 2006, 6, 520–523. 10.1021/nl060227d. [DOI] [PubMed] [Google Scholar]
- Rojek M. J.; Walt D. R. PLoS One 2014, 9, e86224 10.1371/journal.pone.0086224. [DOI] [PMC free article] [PubMed] [Google Scholar]
- Kibbe W. A. Nucleic Acids Res. 2007, 35, W43–W46. 10.1093/nar/gkm234. [DOI] [PMC free article] [PubMed] [Google Scholar]
Associated Data
This section collects any data citations, data availability statements, or supplementary materials included in this article.