Abstract
Regorafenib is approved for the treatment of colorectal cancer and hepatocellular carcinoma. In the trial NCT02466802 we have discovered that regorafenib can be safely combined with the PDE5 inhibitor sildenafil in advanced solid tumor patients. The present studies determined whether the approved ERBB1/2/4 and RAS down-regulating drug neratinib, could enhance the lethality of [regorafenib + sildenafil]. Neratinib enhanced [regorafenib + sildenafil] lethality in a greater than additive fashion in colon cancer cells. The drug combination reduced the expression of mutant K-RAS and of multiple histone deacetylase proteins, that required autophagosome formation. It caused GFP or RFP-tagged forms of K-RAS V12 to localize into large intracellular vesicles. Compared to [regorafenib + sildenafil], the three-drug combination caused greater and more prolonged activation of the ATM-AMPK-ULK-1 pathway and caused a greater suppression and prolonged inactivation of mTOR, AKT and p70 S6K. Approximately 70% of enhanced lethality caused by neratinib required ATM-AMPK signaling whereas knock down of Beclin1, ATG5, FADD and CD95 completely prevented the elevated killing effect. Exposure of cells to [regorafenib + sildenafil] reduced the expression of the checkpoint immunotherapy biomarkers PD-L1, ODC and IDO-1 and increased the expression of MHCA, which also required autophagosome formation. Knock down of specific HDAC proteins recapitulated the effects observed using chemical agents. In vivo, using mouse cancer models, neratinib significantly enhanced the anti-tumor efficacy of [regorafenib + sildenafil]. Our data support performing a new three drug phase I trial combining regorafenib, sildenafil and neratinib.
Keywords: autophagy, HDAC, DNA damage
Introduction
The drug regorafenib (Stivarga®), a multi-kinase and chaperone inhibitor, was originally approved for the treatment of colon cancer and more recently for hepatocellular carcinoma (Røed Skårderud et al, 2018; Carr et al, 2013). In 2017 the drug neratinib (NERLYNX®), an irreversible inhibitor of ERBB1/2/4, was approved by the FDA as an adjuvant therapy alongside the anti-ERBB2 antibody Herceptin in ERBB2+ breast cancers (Echavarria et al, 2017). Sildenafil (Viagra®) is a phosphodiesterase 5 (PDE5) inhibitor and was approved to treat erectile dysfunction (Booth et al, 2014). Several years ago, we demonstrated that sildenafil and other PDE5 inhibitors could enhance the lethality of multi-kinase inhibitors such as sorafenib, regorafenib and pazopanib (Tavallai et al, 2015; Booth et al, 2016a; Booth et al, 2016b).5–7 One component of drug-combination lethality was the inhibition of chaperone function which resulted in enhanced endoplasmic reticulum signaling, reduced expression of protective proteins such as MCL-1 and BCL-XL, and the induction of death receptor signaling in parallel with formation of toxic autophagosomes. Based on our pre-clinical data, a phase I trial was initiated in collaboration with Bayer combining regorafenib and sildenafil in advanced solid tumors (NCT02466802). This trial is still recruiting patients at the highest dose level, with no DLTs at present observed.
Our work in 2017 with the ERBB1/2/4 inhibitor neratinib has shown that this agent, when compared to other ERBB receptor inhibitors e.g. gefitinib, erlotinib, lapatinib, afatinib, can not only inhibit the catalytic activity of ERBB1/2/4 but also can cause receptor internalization and degradation, requiring autolysosomes and cathepsin B (Booth et al, 2017a). Subsequent analyses demonstrated that other receptor tyrosine kinases, e.g. c-MET, potentially associated with ERBB receptors in quaternary signaling complexes on the cell surface, could also be down-regulated, although the mechanisms of down-regulation of ERBB1 and c-MET were not identical. Building upon this concept, we discovered that neratinib, especially neratinib combined with an HDAC inhibitor, caused the rapid autolysosomal-dependent degradation of mutant K-RAS and mutant N-RAS proteins (Booth et al, 2017a; Booth et al, 2017b; Booth et al, 2018).
In vivo studies combining [regorafenib + sildenafil] revealed via multiplex assays on tumor tissue and plasma, that the levels of plasma FGF, and ERBB1 and AKT phosphorylation in tumor cells, were biomarkers that were associated with lower levels of cell killing by the [regorafenib + sildenafil] combination (Tavallai et al, 2015). In further studies, the ERBB1/2/4 inhibitor lapatinib significantly enhanced the anti-tumor effect of [regorafenib + sildenafil] in vivo; the ERBB1/2/4 inhibitor afatinib enhanced the anti-tumor effects of [sorafenib + sildenafil] (Booth et al, 2016a). The present studies were performed to determine whether neratinib enhanced the lethality of [regorafenib + sildenafil] in GI tumors, particularly colorectal carcinomas. Our findings reveal that neratinib significantly enhanced the anti-tumor efficacy of [regorafenib + sildenafil] in vitro and in vivo. Collectively our data support performing a new three drug phase I trial in colorectal cancer patients combining regorafenib, sildenafil and neratinib.
Materials and Methods.
Materials.
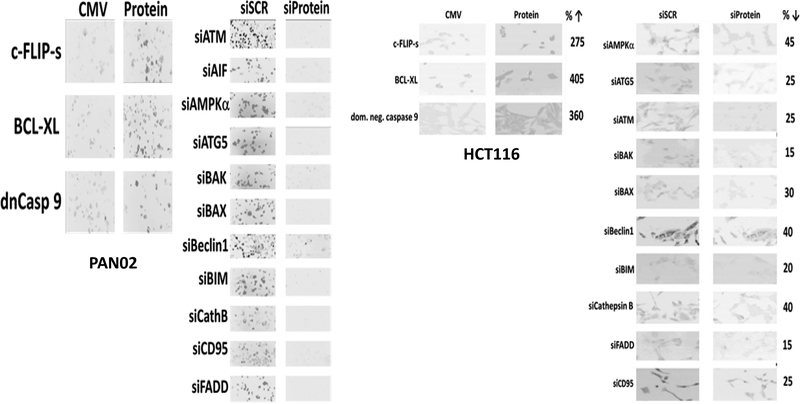
Regorafenib and sildenafil were from Selleckchem (Houston, TX). Neratinib was supplied by Puma Biotechnology Inc. (Los Angeles, CA). Cell culture materials were purchased from GIBCOBRL (GIBCOBRL Life Technologies, Grand Island, NY). Established cell lines were purchased from the ATCC. The ATP assay kit (MAK190–1KT) was from Sigma-Aldrich (St. Louis, MO). The GFP and RFP tagged K-RAS V12 plasmids were provided by Dr. Hancock.12 Commercially available validated short hairpin RNA molecules to knock down RNA / protein levels were from Qiagen (Valencia, CA) (Figure 1). Reagents and the performance of experimental procedures were all as described in: (Tavallai et al, 2015; Booth et al, 2016a; Booth et al, 2016b; Booth et al, 2017a; Booth et al, 2017b; Booth et al, 2018).
Figure 1. Representative images of proteins knocked down or over-expressed in the present studies.
The data are from PAN02 (mouse) cells and HCT116 (human) cells.
Methods.
Culture, Transfection and in vitro exposure of cells to drugs.
All cell lines were cultured at 37 °C (5% (v/v CO2) in vitro using RPMI supplemented with 5% (v/v) fetal calf serum and 10% (v/v) Non-essential amino acids (Tavallai et al, 2015; Booth et al, 2016a; Booth et al, 2016b; Booth et al, 2017a; Booth et al, 2017b; Booth et al, 2018).Cells were transfected with siRNA molecules or plasmids as described in prior manuscripts (Tavallai et al, 2015; Booth et al, 2016a; Booth et al, 2016b; Booth et al, 2017a; Booth et al, 2017b; Booth et al, 2018).
Detection of cell viability, protein expression and protein phosphorylation by immuno-fluorescence using a Hermes WiScan machine.
http://www.idea-bio.com/ (Tavallai et al, 2015; Booth et al, 2016a; Booth et al, 2016b; Booth et al, 2017a; Booth et al, 2017b; Booth et al, 2018). Live / dead assays used a live-dead reagent (Thermo Fisher Scientific, Waltham MA) and we visualized cells at 10X magnification. Green cells = viable; yellow/red cells = dying/dead. For immuno-fluorescence studies, cells were visualized at either 10X or 60X. All immuno-fluorescent images for each individual protein / phospho-protein were taken using the identical machine settings. Images were processed at 9999 dpi using Adobe Photoshop, and figures generated in Microsoft PowerPoint (Tavallai et al, 2015; Booth et al, 2016a; Booth et al, 2016b; Booth et al, 2017a; Booth et al, 2017b; Booth et al, 2018).
Analysis of RNS levels:
RNS levels were determined in a vector 3 plate reader (PerkinElmer Life and Analytical Sciences). Cancer cells were loaded for 30 min with 3-amino,4-aminomethyl-2′,7′-difluorescein (DAF-FM DA, 4 μM) which is sensitive to oxidation by NO. Cells were treated with vehicle control, regorafenib and/or sildenafil and fluorescence measured after 2h. Data are presented corrected for basal fluorescence of vehicle-treated cells.
Assessment of autophagy:
Cells were transfected with a plasmid to express a green fluorescent protein (GFP) and red fluorescent protein (RFP) tagged form of LC3 (ATG8). GFP punctae detect autophagosome formation and RFP punctae detect autolysosome formation (Tavallai et al, 2015; Booth et al, 2016a; Booth et al, 2016b; Booth et al, 2017a; Booth et al, 2017b; Booth et al, 2018).
Animal Studies.
Studies were performed per USDA regulations under VCU IACUC protocol AD20008. Female CT26 mouse colorectal / male PAN02 mouse pancreatic carcinoma cells (2 × 10⁴) were implanted into rear flanks of female BALB/c and male C57/BL6 mice, respectively. Tumors were permitted to form until the mean tumor volume was ~40 mm3. Animals were then segregated into groups with near identical mean volumes and the animals then treated for three days with the indicated therapeutic agents: vehicle control (cremophore); regorafenib (20 mg/kg QD Days 1–3); [regorafenib (20 mg/kg QD Days 1–3 and sildenafil (5 mg/kg QD Days 1–3)]; neratinib (15 mg/kg QD Days 1–3); or the three drugs in combination. Tumor volumes were measured prior to drug administration and every three days after the initiation of therapeutic interventions. (n = 10 mice per group +/−SEM). Before, during and after drug treatment tumors are calipered as indicated in the Figure and tumor volume was assessed up to 24 days later. When the volume of the tumor reached >1,500 mm3, animals were humanely sacrificed, and the normal tissues removed for further H&E staining studies.
Transfection.
Cells were transfected with plasmids to express GFP-K-RAS V12 and RFP-K-RAS V12 (0.1 μg) using lipofectamine 2000. Twenty-four h after transfection, cells were used in assays examining their staining for GFP and RFP.
Data analysis.
Comparison of the effects of various treatments (in triplicate three times) was using one-way ANOVA and a two tailed Student’s t-test. Statistical examination of in vivo animal survival data utilized a two tailed Student’s t-test and log rank statistical analyses between the different treatment groups. Differences with a p-value of < 0.05 were considered statistically significant. Experiments are the means of multiple individual points from multiple experiments (± SEM).
Results
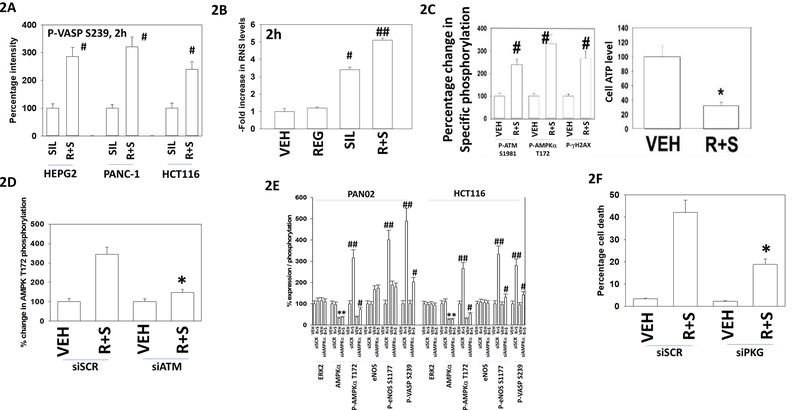
Sildenafil, via inhibition of PDE5, enhances cGMP levels and thus PKG activity. Sildenafil rapidly promoted the phosphorylation of a well-recognized PKG substrate, VASP-1 S239 (Figure 2A). Regorafenib as a single agent did not alter VASP-1 S239 phosphorylation, however [regorafenib + sildenafil] caused a greater amount of VASP-1 S239 phosphorylation than sildenafil alone, implying that regorafenib further enhanced PKG activation in the presence of cGMP. In parallel to enhancing PKG activity, the addition of regorafenib to sildenafil also enhanced the production of nitric oxide (NO) in tumor cells (Figure 2B). Exposure of tumor cells to [regorafenib + sildenafil] increased the phosphorylation of γH2AX, ATM S1981 and AMPK T172 and reduced cellular ATP levels, which collectively imply that the AMP-dependent protein kinase was being activated via phosphorylation and allosteric mechanisms (Figure 2C). Knock down of ATM significantly reduced [regorafenib + sildenafil]-induced phosphorylation of AMPKα T172 (Figure 2D). The AMPK has been shown by other groups to phosphorylate endothelial nitric oxide synthase (eNOS) at Serine 1177; elevated S1177 phosphorylation was associated with higher eNOS catalytic activity and the production of NO (Zhang et al, 2009). In an AMPK-dependent fashion, [regorafenib + sildenafil] enhanced eNOS S1177 phosphorylation (Figure 2E). In cells with AMPKα knock down, regorafenib was significantly less capable at promoting sildenafil-dependent phosphorylation of VASP-1 S239 (Figure 2E). Combined knock down of PKGI and PKGII abolished the ability of regorafenib and sildenafil to cause enhanced tumor cell killing (Figure 2F). Collectively the data in Figure 2 demonstrates that regorafenib and sildenafil interact to generate NO which activates cytosolic guanylate cyclase that enhances cGMP levels, and in parallel activates PKG by blocking PDE5 function, thereby preventing cGMP degradation.
Figure 2. [Regorafenib + sildenafil] causes concerted signaling to activate toxic PKG signaling.
A. GI tumor cells were treated with vehicle control, regorafenib (0.5 μM), sildenafil (2.0 μM) or the drugs in combination for 2h. Cells were fixed in place and immunostaining performed to determine the staining intensity for VASP-1 S239. At least forty cells per condition were imaged in independent triplicate and plotted as a percentage of sildenafil treatment; no staining for VASP-1 S239 was observed in control treated or regorafenib treated cells (n = 3 +/− SD). # p < 0.05 greater than sildenafil value. B. HEPG2 cells were loaded with DAF-FM DA and were then treated with vehicle control, regorafenib (0.5 μM), sildenafil (2.0 μM) or the drugs in combination for 2h. Data are expressed as a -Fold increase in RNS levels compared to those in vehicle control treated cells (n = 3 +/− SEM) # p < 0.05 greater than vehicle control value; ## p < 0.05 greater than sildenafil value. C. left: HEPG2 cells were treated with vehicle control or with [regorafenib (0.5 μM) + sildenafil (2.0 μM)] in combination for 2h. Cells were fixed in place and immunostaining performed to determine the staining intensity for total ATM, P-ATM S1981, total AMPKα, P-AMPKα T172, total γH2AX and P-γH2AX. At least forty cells per condition were imaged in independent triplicate and plotted as a percentage of vehicle treatment (n = 3 +/− SD). # p < 0.05 greater than vehicle control value; Right: HEPG2 cells were treated with vehicle control or with [regorafenib (0.5 μM) + sildenafil (2.0 μM)] in combination for 2h. The levels of ATP in treated cells were determined according to manufacturer’s instructions (n = 3 +/− SD). * p < 0.05 less than vehicle control value. D. PANC-1 cells were transfected with a scrambled siRNA (siSCR) or an siRNA to knock down expression of ATM. Twenty-four h later, cells were treated with vehicle control or with [regorafenib (0.5 μM) + sildenafil (2.0 μM)] in combination for 2h. Cells were fixed in place and immunostaining performed to determine the staining intensity for total AMPKα and P-AMPKα T172. At least forty cells per condition were imaged in independent triplicate and plotted as a percentage of vehicle treatment (n = 3 +/− SD). * p < 0.05 less than corresponding value in siSCR. E. HCT116 (colorectal) and PAN02 (pancreatic cancer cells were transfected with a scrambled siRNA (siSCR) or an siRNA to knock down expression of AMPKα. Twenty-four h later, cells were treated with vehicle control or with [regorafenib (0.5 μM) + sildenafil (2.0 μM)] in combination for 2h. Cells were fixed in place and immunostaining performed to determine the staining intensity for P-eNOS S1177 and P-VASP-1 S239. At least forty cells per condition were imaged in independent triplicate and plotted as a percentage of vehicle treatment (n = 3 +/− SD). # p < 0.05 greater than vehicle control value; ## p < 0.05 greater than corresponding value in siAMPKα cells. F. Cells were transfected with a scrambled siRNA (siSCR) or an siRNA to knock down expression of PKGI and PKGII. Twenty-four h later, cells were treated with vehicle control or with [regorafenib (0.5 μM) + sildenafil (2.0 μM)] in combination for 24h. Cells were isolated and viability determined by trypan blue exclusion (n = 3 +/− SD). * p < 0.05 less than corresponding siSCR value.
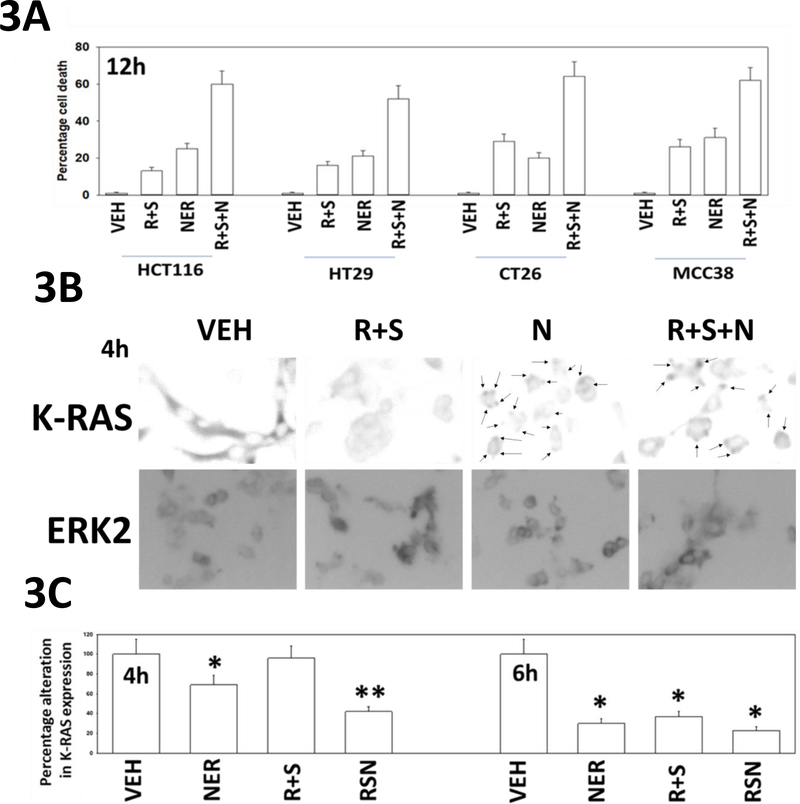
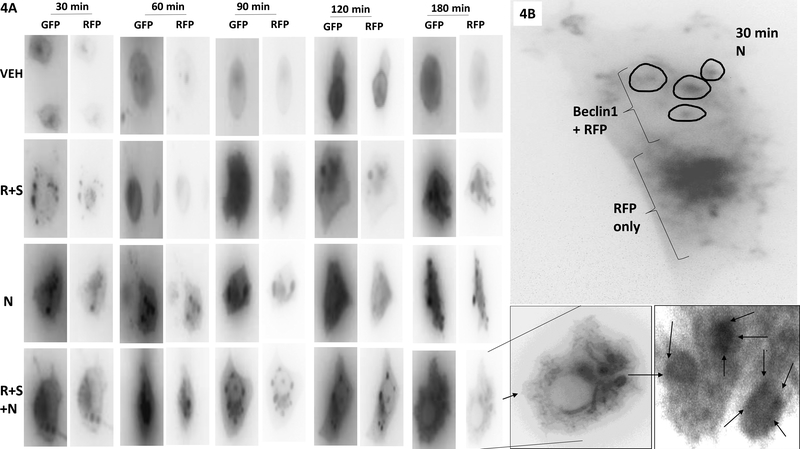
In prior studies, based on our data showing that [regorafenib + sildenafil] treated tumors had stable high ERBB1 phosphorylation, expressed more FGF and had higher AKT activity we determined that inhibition of ERBB1/2 signaling using the first-generation drug lapatinib enhanced [regorafenib + sildenafil] lethality in vitro and in vivo (Tavallai et al, 2015). Low clinically relevant concentrations of regorafenib, sildenafil and the novel irreversible ERBB1/2/4 inhibitor neratinib interacted in a greater than additive fashion to kill human and mouse colorectal cancer cells (Figure 3A) The three-drug combination enhanced the rate of mutant K-RAS down-regulation in CT26 cells when compared to neratinib alone (Figure 3B). Note: arrows showing the mutant K-RAS in neratinib treated CT26 cells is localizing in punctate intensely staining bodies. PANC-1 cells were co-transfected with two plasmids, to express K-RAS V12 – GFP and the other to express K-RAS V12 – RFP; with the expectation that both tagged forms of K-RAS V12 would, at least at early time points, co-localize within the cells (Cho et al, 2016). Over a three-hour time-course, [regorafenib + sildenafil] or neratinib alone caused the formation of small and large intracellular vesicles, respectively (Figure 4A). The GFP and RFP tagged forms of K-RAS V12 co-localized arguing that the tag was not responsible for the vesicularization effect. Note that by 120–180 min, in cells treated with [regorafenib + sildenafil + neratinib], that cells had flattened outwards, and that not only were large vesicles present that contained GFP-K-RAS V12 and RFP-K-RAS V12, but that within those vesicles intense punctate staining was present for GFP/RFP suggestive that K-RAS even within a vesicle was being concentrated at specific sites. In fixed cells, without quenching endogenous GFP/RFP staining, GFP/RFP staining largely did not colocalize with the autophagosome regulatory protein Beclin1, though some vesicles, circled, were double positive staining (Figure 4B).
Figure 3. Neratinib enhances [regorafenib + sildenafil] lethality which correlates with enhanced K-RAS degradation and inactivation of AKT, mTOR, p70 S6K and ERK1/2.
A. Tumor cells (HCT116, HT29: human colorectal cancer; CT26, MCC38: mouse colorectal cancer) were treated with vehicle control, [regorafenib (0.5 μM) + sildenafil (2.0 μM)], neratinib (50 nM) or the drugs in combination for 12h. Cells were then isolated, and viability determined by trypan blue exclusion assay (n = 3 +/− SD). B. CT26 cells were treated with vehicle control, [regorafenib (0.5 μM) + sildenafil (2.0 μM)], neratinib (50 nM) or the drugs in combination for 4h. Cells were fixed in place at each time point, and immunofluorescent staining performed to determine the total expression of KRAS and total expression of ERK2. At least forty cells per condition were imaged in independent triplicate and the intensity ratio of K-RAS levels to total ERK2 expression plotted as a percentage of control treatment (n = 3 +/− SD). * p < 0.05 less than vehicle control; ** p < 0.05 less than neratinib alone value. Upper images: K -RAS protein become localized in punctate bodies 4h after exposure to neratinib (teal arrows).
Figure 4. Neratinib and [regorafenib + sildenafil] both cause the rapid intracellular vesicularization of GFP-K-RAS V12 and RFP-K-RAS V12.
A. PANC-1 cells were co-transfected with plasmids to express GFP-K-RAS V12 and RFP-K-RAS V12. Twenty-four h later, cells were treated with vehicle control, [regorafenib (0.5 μM) + sildenafil (2.0 μM)], neratinib (50 nM) or the drugs in combination for 30 min, 60 min, 90 min, 120 min and 180 min. Live cells were imaged at each timepoint at 60X magnification. The images presented are representative of three independent experiments. B. In parallel to the studies in Panel A, cells were fixed in paraformaldehyde after 30 min, that preserves the GFP and RFP fluorescence. Cells were immuno-stained to detect the expression of Beclin1 and images taken at 60X magnification. The image presented is representative of three independent experiments.
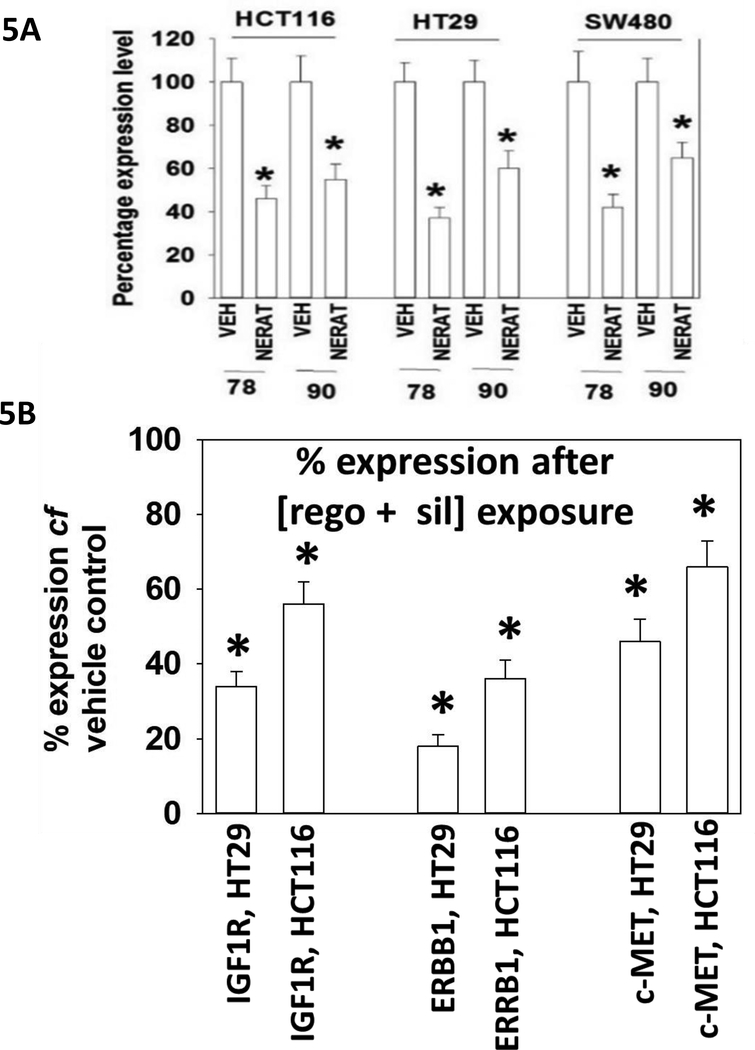
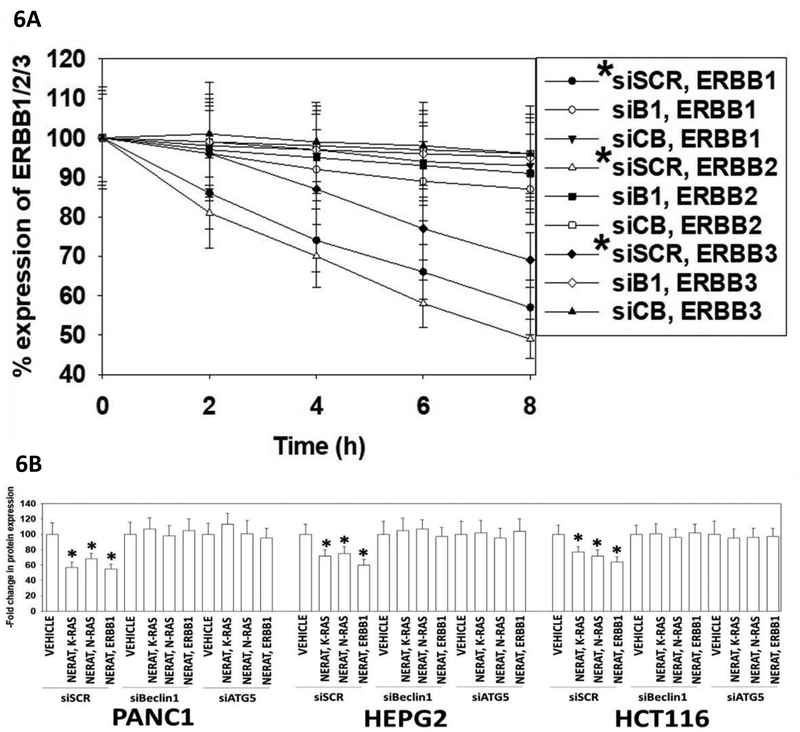
Neratinib as a single agent rapidly reduced the protein levels of HSP90 and GRP78 (Figure 5A). Growth factor receptors, chaperoned by HSP90, also had their protein levels rapidly reduced after [regorafenib + sildenafil] exposure (Figure 5B) (Tavallai et al, 2015). Others have previously noted that sildenafil can cause the translocation of mutant K-RAS from the plasma membrane into intracellular vesicles, where it is primed for degradation (Cho et al, 2016). Within 8h of exposure, neratinib was capable of significantly reducing the expression of ERBB1, ERBB2 and ERBB3 in colon cancer tumor cells (Figure 6A). These effects were significantly reduced by knock down of either Beclin1 or of cathepsin B. Reduced expression of ERBB1, as well as K-RAS and N-RAS, in these cells was blocked by knock down of the autophagy regulatory proteins Beclin1 or ATG5 (Figure 6B).
Figure 5. Neratinib down-regulates the expression of chaperone proteins.
A. HCT116, SW480 and HT29 cells were treated with vehicle control or with neratinib (50 nM). Cells were fixed in place after 6h and immuno-staining against the chaperones COOH-termini performed to determine the total expression of GRP78 and HSP90. (n = 3, * p < 0.05 less than vehicle control value +/− SEM). B. HCT116 colon cancer cells were treated with vehicle control or with [regorafenib (0.5 μM) + sildenafil (2.0 μM)] for 6h. Cells were fixed in place and immunostaining performed to determine the expression of the indicated growth factor receptors. (n = 3, * p < 0.05 less than vehicle control value +/− SEM).
Figure 6. Neratinib down-regulates the expression of ERBB1, K-RAS and N-RAS via autophagy.
A. HCT116 colorectal tumor cells were transfected with a scrambled siRNA, with an siRNA to knock down the autophagy regulatory protein Beclin1 (B1), or with an siRNA to knock down the lysosomal protease cathepsin B (CB). After 24h, the expression of Beclin1 or of cathepsin B had been reduced by >75% compared to scrambled control. Twenty-four h after transfection, cells were treated with vehicle control or with neratinib (50 nM) for 0–8h. Vehicle control exposure did not alter receptor basal expression. Cells were fixed in place at the indicated time points and immunofluorescence staining performed to determine the total expression of ERBB1, ERBB2, ERBB3. Cells were visualized in the Hermes WiScan instrument at 10X magnification. The intensity of 40 cells per condition was determined using the machine’s own software combined with data from another two wells of separately treated cells, and with background fluorescence subtracted. Secondary antibody alone staining did not generate any signal (* p < 0.05 less than vehicle control; the data are the mean fluorescence from 120 data points from three separate drug exposures +/− SEM). B. PANC1 (mut. K-RAS), HEPG2 (mut. N-RAS) and HCT116 (mut. K-RAS) cells were transfected with a scrambled siRNA control molecule or siRNA molecules to knock down the expression of Beclin1 or ATG5. Twenty-four h after transfection cells were treated with vehicle control or neratinib (50 nM) for 6h. Cells were fixed in place at the indicated time points and immuno-fluorescence staining performed to determine the total expression of ERBB1, K-RAS & N-RAS. Cells were visualized in the Hermes WiScan instrument at 10X magnification. The staining intensity of 40 cells per condition was determined using the machine’s own software combined with data from another two wells of separately treated cells, and with background fluorescence subtracted. Secondary antibody alone staining did not generate any signal (* p < 0.05 less than vehicle control; the data are the mean fluorescence from 120 data points from three separate drug exposures +/− SEM).
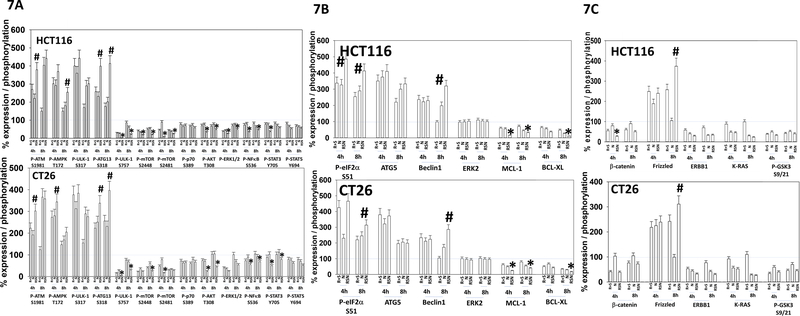
We then determined the impact of neratinib exposure on changes in protein phosphorylation caused by [regorafenib + sildenafil]. Neratinib interacted with [regorafenib + sildenafil] to promote additional phosphorylation of eIF2α, ATM, AMPK, ULK-1 S317 and ATG13 (Figure 7A). The drugs interacted to further reduce phosphorylation of mTOR, AKT, p70 S6K and ERK1/2. The drugs combined to promote a more prolonged inactivation of AKT, p70 S6K, mTOR and ERK1/2. Our prior studies with [regorafenib + sildenafil] as well as with neratinib had linked their abilities to cause endoplasmic reticulum (ER) stress signaling via eIF2α to enhance Beclin1 and ATG5 expression and to reduce MCL-1 and BCL-XL levels. In agreement with our eIF2α phosphorylation data, the three-drug combination significantly enhanced ATG5 and Beclin1 expression and decreased the levels of MCL-1 and BCL-XL (Figure 7B). Increased levels of ATG13 phosphorylation and increased expression imply autophagosome formation was occurring; which was confirmed using an LC3-GFP-RFP construct (not shown) (Booth et al, 2016a; Booth et al, 2016b; Booth et al, 2017a; Booth et al, 2017b; Booth et al, 2018).
Figure 7. Neratinib prolongs and enhances the [regorafenib + sildenafil] -induced inactivation of mTOR that is associated with increased expression of ATG5 and Beclin1, and decreased expression of MCL-1 and BCL-XL.
A, B. and C. CT26 (mouse) and HCT116 (human) colon cancer cells were treated with vehicle control, [regorafenib (0.5 μM) + sildenafil (2.0 μM)], neratinib (50 nM) or the drugs in combination for 4h and 8h. Cells were fixed in place at each time point, and immunofluorescent staining performed to determine the total expression of ERK2, and the changes in protein phosphorylation and protein expression of the indicated proteins. At least forty cells per condition were imaged in independent triplicate and the intensity ratio of phosphorylation / expression levels to total ERK2 expression determined (n = 3 +/− SD). * p < 0.05 less than values in either individual treatment; # p < 0.05 than values in either individual treatment.
The protein β-catenin has been shown to facilitate colon cancer growth, and is a target of the adenomatous polyposis coli (APC) protein; a gene frequently mutated inactive in colon cancer (MacDonald et al, 2009; Gottardi and Peifer, 2008; Liu et al, 2006; Kimelman and Xu, 2006; Fiedler et al, 2011). APC plays an essential role in the formation of the β-catenin destruction complex in which β-catenin is eventually ubiquitinated and directed towards degradation via the proteasome (Markowitz and Bertagnolli, 2009). To undergo degradation, β-catenin must also be phosphorylated by glycogen synthase kinase (GSK3). GSK3 is phosphorylated by AKT, which results in GSK3 inactivation that in the instance of insulin signaling, leads to increased activity of glycogen synthase (Cross et al, 1995). We have previously noted that insulin can reduce GSK3 activity in rabbit skeletal muscle in vivo, following animal starvation and administration of insulin and propranolol (unpublished data) (Dent et al, 1990). Treatment of colon cancer cells with [regorafenib + sildenafil] reduced the expression of β catenin, ERBB1 and K-RAS, and alone or in combination with neratinib reduced the phosphorylation of AKT T308 and GSK3 S9/S21 (Figure 7C). The levels of Frizzled were increased. The dephosphorylation and activation of GSK3 correlated with the reduced expression of β-catenin. Lower levels of β-catenin, ERBB1 and K-RAS would predict for reduced tumor growth and viability.
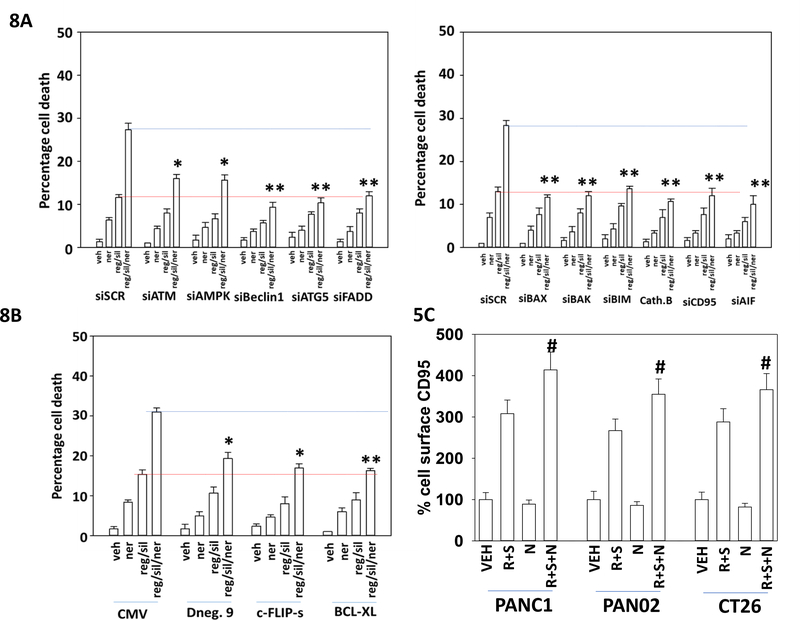
We next determined the molecular mechanisms by which neratinib enhanced [regorafenib + sildenafil] lethality. Knock down of ATM or AMPKα reduced the ability of neratinib to enhance [regorafenib + sildenafil] lethality by ~70% (Figure 8A). However, knock down of CD95, FADD, ATG5, Beclin1 or the lysosomal protease cathepsin B abolished the ability of neratinib to enhance killing by [regorafenib + sildenafil]. Knock down of the toxic BH3 domain proteins BAX or BAK or knock down of the apoptosis inducing factor (AIF), also largely abolished the neratinib potentiating effect. Thus, the three-drug combination promotes greater signaling from CD95 and greater toxic autophagosome formation that results in greater lysosomal dysfunction and release of cathepsin B, in parallel with increased mitochondrial dysfunction and release of AIF. Additional studies were then performed to assess the effects of expressing either a caspase 8/10 inhibitor, c-FLIP-s; the mitochondrial protective protein BCL-XL; or a dominant negative form of caspase 9. Over-expression of c-FLIP-s or of dominant negative caspase 9 significantly reduced the ability of neratinib to enhance [regorafenib + sildenafil] killing (Figure 8B). BCL-XL abolished the ability of neratinib to enhance killing. We have previously reported that [regorafenib + sildenafil] can increase the plasma membrane levels of the death receptor CD95, which is a biomarker for CD95 activation. Neratinib in a non-significant fashion modestly reduced cell surface levels of CD95 (Figure 8C). However, neratinib significantly enhanced the ability of [regorafenib + sildenafil] to increase CD95 plasma membrane levels. This data re-affirms that death receptor signaling, and mitochondrial dysfunction, are key mechanistic elements in three-drug combination lethality. The data also support the hypothesis that tumor cell killing proceeds predominantly through necroptotic mechanisms rather than apoptotic pathways.
Figure 8. Death receptor signaling and autophagosome formation are essential for neratinib to enhance [regorafenib + sildenafil] lethality.
A. CT26 cells were transfected with a scrambled control siRNA (siSCR) or were transfected to knock down the expression of the indicated proteins (see Figure 7 for knock down images). Twenty-four h after transfection cells were treated with vehicle control, [regorafenib (0.5 μM) + sildenafil (2.0 μM)], neratinib (50 nM) or the drugs in combination for 12h. Cells were then isolated, and viability determined by trypan blue exclusion assay (n = 3 +/− SD). * p < 0.05 greater than reg/sil value in siSCR cells; ** p > 0.05 greater than reg/sil value in siSCR cells. B. CT26 cells were transfected with an empty vector control plasmid (CMV) or were transfected with plasmids to express the indicated proteins: c-FLIP-s; BCL-XL; dominant negative caspase 9 (see Figure 7 for expression images). Twenty-four h after transfection cells were treated with vehicle control, [regorafenib (0.5 μM) + sildenafil (2.0 μM)], neratinib (50 nM) or the drugs in combination for 12h. Cells were then isolated, and viability determined by trypan blue exclusion assay (n = 3 +/− SD). * p < 0.05 greater than reg/sil value in siSCR cells; ** p > 0.05 greater than reg/sil value in siSCR cells. C. PANC1, PAN02 and CT26 cells were treated with vehicle control, [regorafenib (0.5 μM) + sildenafil (2.0 μM)], neratinib (50 nM) or the drugs in combination for 3h. Cells were fixed in place without membrane permeabilization. Immunofluorescent staining performed to determine the total plasma membrane levels of CD95. At least forty cells per condition were imaged in independent triplicate (n = 3 +/− SD); # p < 0.05 greater than values in [R+S] treatment.
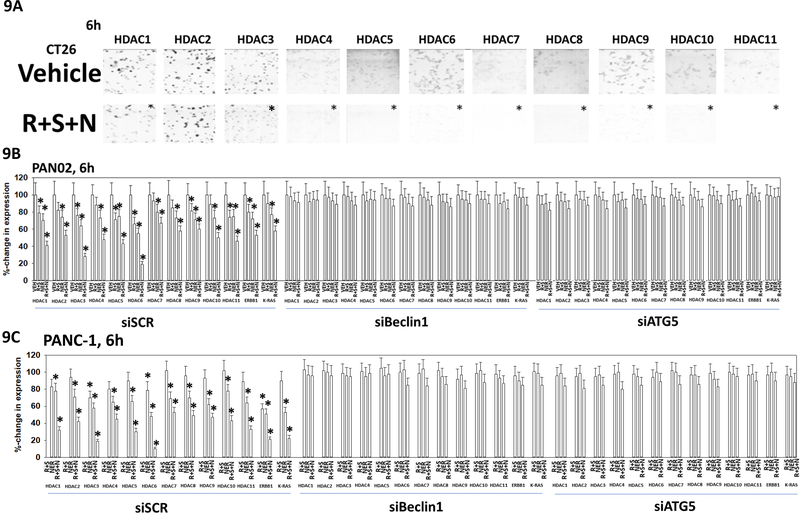
In prior studies we have demonstrated that high levels of autophagosome formation can act to reduce the protein levels of multiple histone deacetylase proteins (Booth et al, 2017c; Booth et al, 2017d). Exposure of CT26 cells to [regorafenib + sildenafil + neratinib] reduced the expression of HDAC1 and HDACs4–11 but did not change the levels of HDAC2 and HDAC3 (Figure 9A). In PAN02 cells, a mouse pancreatic tumor cell line that also expresses a mutant K-RAS protein, [regorafenib + sildenafil] and more so [regorafenib + sildenafil + neratinib] reduced the expression of HDACs1–11 (Figure 9B). Knock down of the autophagy regulatory proteins Beclin1 or ATG5 prevented any of the drug treatments of reducing HDAC levels. Very similar data were obtained using PANC1 human pancreatic cancer cells (Figure 9C). Thus, our three-drug combination not only kills tumor cells, but also rapidly alters the expression of HDAC proteins, which will impact on gene function and protein stability.
Figure 9. Exposure of GI tumor cells to [regorafenib + sildenafil + neratinib] reduces the expression of multiple HDAC proteins, that requires autophagosome formation.
A. CT26 cells were treated with vehicle control or with [regorafenib (0.5 μM) + sildenafil (2.0 μM) + neratinib (50 nM)] for 6h. Cells were fixed in place at each time point, and immunofluorescent staining performed to determine the total expression of HDACs1–11. At least forty cells per condition were imaged in independent triplicate (n = 3 +/− SD). * p < 0.05 less than vehicle control. B. and C. PAN02 mouse and PANC-1 human pancreatic cancer cells were transfected with a scrambled control siRNA (siSCR) or with siRNA molecules to knock down the expression of ATG5 or Beclin1. Twenty-four h after transfection cells were treated with vehicle control, [regorafenib (0.5 μM) + sildenafil (2.0 μM)], neratinib (50 nM) or the drugs in combination for 6h. Cells were fixed in place and immunofluorescent staining performed to determine the changes in HDAC protein expression of the indicated HDAC proteins. At least forty cells per condition were imaged in independent triplicate (n = 3 +/− SD). * p < 0.05 less than vehicle control.
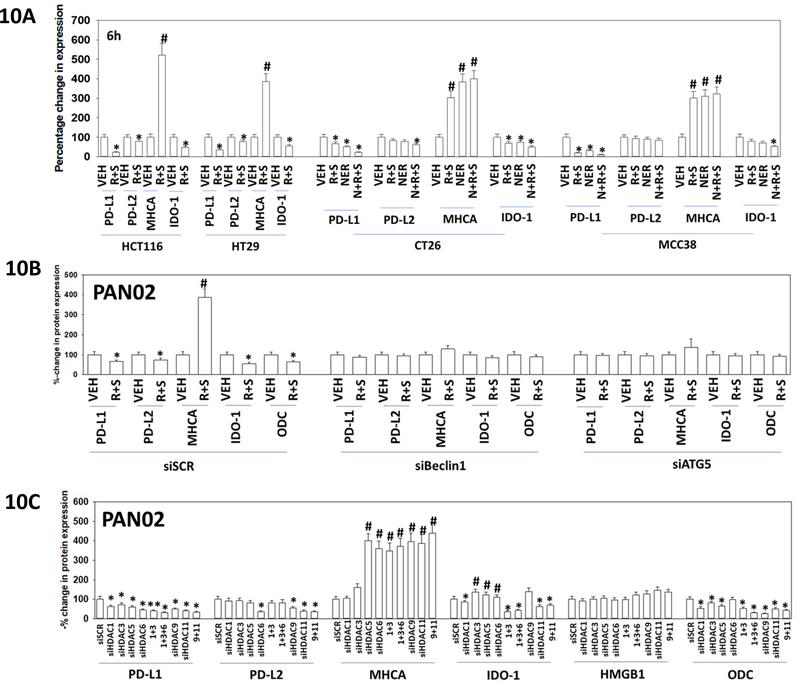
One group of proteins we have studied over the past year are those that regulate the immunogenicity of tumor cells and that could potentially alter the sensitivity of tumor cells to checkpoint inhibitory antibodies. Exposure of PAN02 cells or HCT116 and HT29 cells to [regorafenib + sildenafil] or to [regorafenib + sildenafil + neratinib] reduced the expression of PD-L1, PD-L2 and IDO-1 (Figure 10A). The drug combinations enhanced the expression of MHCA. The ability of the drug combinations to modulate protein expression required the formation of autophagosomes, as judged by the dependence of protein expression changes on the presence of Beclin1 or ATG5 (Figure 10B). Knock down of HDAC proteins, alone or in combination, were able to recapitulate the effects of drug exposure on the levels of PD-L1, PD-L2, MHCA, IDO-1 and ODC. Collectively, the data in Figures 8-10 argue that the [regorafenib + sildenafil + neratinib] drug combination, via autophagy-dependent regulation of HDAC levels, leads to altered transcription and protein expression of proteins that regulate tumor cell immunogenicity.
Figure 10. Altered expression of HDAC proteins is mechanistically linked to altered expression of immunotherapy biomarker proteins.
A. Colon cancer cells were treated with vehicle control or, as indicated, [regorafenib (0.5 μM) + sildenafil (2.0 μM)], neratinib (50 nM) or [regorafenib + sildenafil + neratinib] for 6h. Cells were fixed in place and immunofluorescence staining performed to determine the expression of PD-L1, PD-L2, MHCA and IDO-1. At least forty cells per condition were imaged in independent triplicate (n = 3 +/− SD). * p < 0.05 less than vehicle control; # p < 0.05 greater than vehicle control. B. PAN02 cells were transfected with a scrambled control siRNA (siSCR) or with siRNA molecules to knock down the expression of ATG5 or Beclin1. Twenty-four h after transfection cells were treated with vehicle control, [regorafenib (0.5 μM) + sildenafil (2.0 μM)], neratinib (50 nM) or the drugs in combination for 6h. Cells were fixed in place and immunofluorescent staining performed to determine the changes in PD-L1, PD-L2, MHCA, IDO-1 and ODC expression. At least forty cells per condition were imaged in independent triplicate (n = 3 +/− SD). * p < 0.05 less than vehicle control; # p < 0.05 greater than vehicle control. C. PAN02 cells were transfected with a scrambled control siRNA (siSCR) or with siRNA molecules to knock down the expression of HDACs 1, 3, 5, 6, 9, and 11, alone or in combination. Twenty-four h after transfection cells were fixed in place and immunofluorescent staining performed to determine the changes in PD-L1, PD-L2, MHCA, IDO-1 and ODC expression. At least forty cells per condition were imaged in independent triplicate (n = 3 +/− SD). * p < 0.05 less than vehicle control; # p < 0.05 greater than vehicle control.
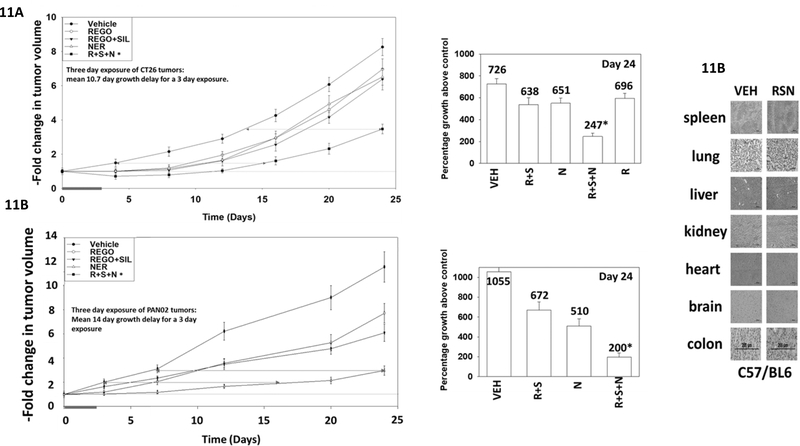
We wished to determine whether neratinib enhanced [regorafenib + sildenafil] lethality in tumor model systems. CT26 colorectal and PAN02 pancreatic cancer cells, that both express a mutated oncogenic K-RAS protein, were implanted into the rear flanks of syngeneic female BALB/c and male C57 black mice, respectively. Tumors formed and were then treated for three days with vehicle control or the drugs alone or in combination (Figures 11A and 11B). Neratinib significantly enhanced the ability of [regorafenib + sildenafil] to reduce tumor growth. In CT26 tumors, exposure to regorafenib reduced tumor growth by 4%; exposure to [regorafenib + sildenafil] by 12%; and neratinib alone by 10%. Combined exposure to all three drugs reduced tumor growth by 66%. This is significantly greater than the effects of neratinib and [R+S] combined. In PAN02 tumors, exposure to [regorafenib + sildenafil] reduced tumor growth by 34%; and neratinib alone by 52%. Combined exposure to all three drugs reduced tumor growth by 81%. This is significantly greater than the effects of neratinib and [R+S] combined. The three-day exposure of animals to [regorafenib + sildenafil + neratinib] did not alter animal body mass or cause any changes in normal mouse behavior. No obvious normal tissue toxicities were observed in the drug-exposed mice, as judged by H&E staining (Figure 11C).
Figure 11. Neratinib enhances the ability of [regorafenib + sildenafil] to suppress the growth of colorectal tumors.
A. and B. Female-derived CT26 mouse colorectal / male-derived PAN02 mouse pancreatic carcinoma cells (2 × 10⁴) were implanted into rear flanks of female BALB/c and male C57/BL6 mice, respectively. Tumors were permitted to form until the mean tumor volume was ~40 mm3. Animals were then segregated into groups with near identical mean volumes and the animals then treated for three days with the indicated therapeutic agents: vehicle control (cremophore); regorafenib (20 mg/kg QD Days 1–3); [regorafenib (20 mg/kg QD Days 1–3 and sildenafil (5 mg/kg QD Days 1–3)]; neratinib (15 mg/kg QD Days 1–3); or the three drugs in combination. Tumor volumes were measured prior to drug administration and every three days after the initiation of therapeutic interventions. (n = 10 mice per group +/−SEM). Before, during and after drug treatment tumors are calipered as indicated in the Figure and tumor volume was assessed up to 24 days later. When the volume of the tumor reached >1,500 mm3, animals were humanely sacrificed. * p < 0.05 less growth than tumors treated with [regorafenib + sildenafil]. C. Normal tissues were fixed in formalin on Day 24. Tissues were embedded in paraffin wax and five-micron sections taken. Sections were deparaffinized and H&E stained. Images of the normal tissues were taken at 40X magnification.
Discussion
The present studies were performed to determine whether neratinib enhanced the ability of [regorafenib + sildenafil] to kill tumor cells. Our data demonstrated that neratinib, in a greater than additive fashion, enhanced [regorafenib + sildenafil] lethality. The elevated levels of killing caused by neratinib were mediated through both increased toxic autophagosome formation and increased death receptor signaling. This resulted in lysosomal and mitochondrial dysfunction which in turn resulted in tumor cell execution by cathepsin B, AIF and caspase 3. In vivo, neratinib enhanced [regorafenib + sildenafil] lethality against mouse CT26 and PAN02 tumors. Thus, our molecular and descriptive data support proposing a new phase I trial in GI cancer patients combining the standard of care drug regorafenib with sildenafil and neratinib.
The CT26 and PAN02 cell lines, as is often found in colorectal and pancreatic tumors, expresses a mutated K-RAS protein. One “holy grail” of oncology medicine has been to develop drugs that could block signaling by mutated RAS proteins. And, at present, there is a major program at the NCI to develop RAS inhibitors. One limitation of directly attacking the RAS protein, however, is that all three major isoforms of RAS (K-; N-; H-) that can be mutated in cancer would each require subtly different agents to block their signaling processes. In several recent studies we have presented data arguing that neratinib, and particularly when neratinib was combined with HDAC inhibitors, could cause the proteolytic degradation of growth factor receptors and associated membrane signaling proteins, including mutated forms of K-RAS and of N-RAS (Booth et al, 2017a; Booth et al, 2017b; Booth et al, 2018). Others have observed sildenafil down-regulating K-RAS via PKG (Cho et al, 2016). In vitro data demonstrating neratinib’s ability to down-regulate K-RAS and N-RAS were recapitulated in vivo using a breast cancer model system. This indirect approach of RAS down-regulation, that also lowers expression of cyto-protective growth factor receptors, will shortly move into phase I evaluation at Massey Cancer Center in all qualifying solid tumor patients.
In the present manuscript, we discovered that neratinib and [regorafenib + sildenafil] interacted to reduce K-RAS expression, and that a 6h incubation of CT26 cells with [regorafenib + sildenafil] also caused the protein levels of K-RAS to decline. Confirmation that we were causing K-RAS V12 vesicularization was made using GFP and RFP tagged forms of the protein (Cho et al, 2016). Neratinib is an irreversible inhibitor, originally developed to block ERBB2 activity, but that was also shown to inactivate ERBB1 and ERBB4. That the related irreversible inhibitor afatinib, developed to block ERBB1, does not cause receptor degradation suggests that the chemical modification of ERBB2, also the only family member not to bind a ligand, must play an elevated mechanistic role in the down-regulation process. More unexpected was the observation that in a delayed fashion [regorafenib + sildenafil] exposure also reduced the levels of K-RAS. Regorafenib is an inhibitor of RAF family kinases as well as class III receptor tyrosine kinases such as PDGFRα/β. Several years ago, we presented evidence that when combined with PDE5 inhibitors such as sildenafil, regorafenib became a low-affinity inhibitor of HSP90 and HSP70 family chaperones, that correlated in GI tumor cells with reduced expression of multiple receptor tyrosine kinases (Booth et al, 2016b). ERBB family receptor stabilities are in part controlled by HSP90 and HSP70 family chaperones, and some studies have suggested that RAS proteins are also chaperone clients (Qi et al, 2014). Thus, chaperone dysregulation could explain how [regorafenib + sildenafil] reduces RAS expression.
In prior work, including studies with neratinib, we have demonstrated a link between drug-induced autophagosome formation, the lysosomal down-regulation of HDAC expression, and alterations in the protein levels of PD-L1, MHCA, ODC and IDO-1. We were also cognascent of earlier data showing [regorafenib + sildenafil] also caused autophagosome formation. Exposure of tumor cells to [regorafenib + sildenafil + neratinib] through autophagic and HDAC-dependent mechanisms reduced the expression of PD-L1, PD-L2, ODC and IDO-1, and increased the expression of MHCA. These changes in biomarker expression would predict for tumor cells to be more responsive to checkpoint inhibitory antibody immunotherapies i.e. we are turning colorectal tumors from being “cold” into being “hot.” Studies beyond the scope of this manuscript will need to be performed to determine using mouse pancreatic and colorectal tumor models whether antibodies to inhibit PD-1 function or of CTLA4 function, in conjunction with [regorafenib + sildenafil + neratinib], can increase the anti-tumor actions of the immune system.
From our in vivo studies we demonstrated that neratinib enhanced the anti-tumor efficacy of [regorafenib + sildenafil] against mutant K-RAS expressing mouse CT26 colorectal tumor cells. The mice were exposed to drugs for three days, and the delay of tumor growth compared to vehicle control at Day 4 was 11.2 days, and at Day 24 was 10.2 days (mean 10.7). In animals exposed to the three-drug combination, tumor volumes decreased below baseline and did not return to baseline until 9 days after cessation of drug exposure. Further studies in other K-RAS mutant GI tumor cell lines, e.g. PAN02, recapitulated our initial data. CT26 cells are female derived whereas PAN02 cells are male derived suggesting that our drug combination has anti-tumor effects regardless of sex. Based on H&E staining, no frank obvious damage was observed in normal tissues following drug combination exposure arguing that we can combine these agents for at least three days to achieve a non-toxic anti-tumor specific killing effect. Studies beyond the scope of this manuscript, using PDX colorectal and pancreatic tumor models will be required to fully validate our hypothesis.
Acknowledgements
Support for the present study was funded from philanthropic funding from Massey Cancer Center, the Universal Inc. Chair in Signal Transduction Research and PHS R01-CA192613 (PD). Thanks to Dr. H.F. Young and the Betts family fund for support in the purchase of the Hermes Wiscan instrument. The authors have no conflicts of interest to report.
Abbreviations:
- ERK
extracellular regulated kinase
- PI3K
phosphatidyl inositol 3 kinase
- ca
constitutively active
- dn
dominant negative
- ER
endoplasmic reticulum
- AIF
apoptosis inducing factor
- AMPK
AMP-dependent protein kinase
- mTOR
mammalian target of rapamycin
- JAK
Janus Kinase
- STAT
Signal Transducers and Activators of Transcription
- MAPK
mitogen activated protein kinase
- PTEN
phosphatase and tensin homologue on chromosome ten
- ROS
reactive oxygen species
- RNS
reactive nitrogen species
- CMV
empty vector plasmid or virus
- si
small interfering
- SCR
scrambled
- PDE
phospho-diesterase
- IP
immunoprecipitation
- VEH
vehicle
- NER
neratinib
- REG / REGO
regorafenib
- SIL
sildenafil
- HDAC
histone deacetylase
Footnotes
There are no conflicts of interest to report.
References
- Booth L, Roberts JL, Cruickshanks N, Conley A, Durrant DE, Das A, Fisher PB, Kukreja RC, Grant S, Poklepovic A, Dent P. (2014) Phosphodiesterase 5 inhibitors enhance chemotherapy killing in gastrointestinal/genitourinary cancer cells. Mol Pharmacol 85:408–419. [DOI] [PMC free article] [PubMed] [Google Scholar]
- Booth L, Albers T, Roberts JL, Tavallai M, Poklepovic A, Lebedyeva IO, Dent P. (2016a) Multi-kinase inhibitors interact with sildenafil and ERBB1/2/4 inhibitors to kill tumor cells in vitro and in vivo. Oncotarget. 7:40398–40417. [DOI] [PMC free article] [PubMed] [Google Scholar]
- Booth L, Shuch B, Albers T, Roberts JL, Tavallai M, Proniuk S, Zukiwski A, Wang D, Chen CS, Bottaro D, Ecroyd H, Lebedyeva IO, Dent P. (2016b) Multi-kinase inhibitors can associate with heat shock proteins through their NH2-termini by which they suppress chaperone function. Oncotarget. 7:12975–96. [DOI] [PMC free article] [PubMed] [Google Scholar]
- Booth L, Roberts JL, Poklepovic A, Avogadri-Connors F, Cutler RE, Lalani AS, Dent P. (2017a) HDAC inhibitors enhance neratinib activity and when combined enhance the actions of an anti-PD-1 immunomodulatory antibody in vivo. Oncotarget. 8:90262–90277. [DOI] [PMC free article] [PubMed] [Google Scholar]
- Booth L, Roberts JL, Rais R, Kirkwood J, Avogadri-Connors F, Cutler RE Jr., Lalani AS, Poklepovic A, Dent P (2017b) [Neratinib + Valproate] exposure permanently reduces ERBB1 and RAS expression in 4T1 mammary tumors and enhances M1 macrophage infiltration. Oncotarget. 9:6062–6074. [DOI] [PMC free article] [PubMed] [Google Scholar]
- Booth L, Roberts JL, Poklepovic A, Dent P. (2017c) [pemetrexed + sildenafil], via autophagydependent HDAC downregulation, enhances the immunotherapy response of NSCLC cells. Cancer Biol Ther. 18:705–714. [DOI] [PMC free article] [PubMed] [Google Scholar]
- Booth L, Roberts JL, Poklepovic A, Gordon S, Dent P. (2017d) PDE5 inhibitors enhance the lethality of pemetrexed through inhibition of multiple chaperone proteins and via the actions of cyclic GMP and nitric oxide. Oncotarget. 8:1449–1468. [DOI] [PMC free article] [PubMed] [Google Scholar]
- Booth L, Roberts JL, Poklepovic A, Kirkwood J, Sander C, Avogadri-Connors F, Cutler RE Jr, Lalani AS, Dent P. (2018) The levels of mutant K-RAS and mutant N-RAS are rapidly reduced in a Beclin1 / ATG5 -dependent fashion by the irreversible ERBB1/2/4 inhibitor neratinib. Cancer Biol Ther. 19:132–137. [DOI] [PMC free article] [PubMed] [Google Scholar]
- Carr BI, D’Alessandro R, Refolo MG, Iacovazzi PA, Lippolis C, Messa C, Cavallini A, Correale M, Di Carlo A. (2013) Effects of low concentrations of regorafenib and sorafenib on human HCC cell AFP, migration, invasion, and growth in vitro. J Cell Physiol 228:1344–1350. [DOI] [PMC free article] [PubMed] [Google Scholar]
- Cho KJ, Casteel DE, Prakash P, Tan L, van der Hoeven D, Salim AA, Kim C, Capon RJ, Lacey E, Cunha SR, Gorfe AA, Hancock JF. (2016) AMPK and Endothelial Nitric Oxide Synthase Signaling Regulates K-Ras Plasma Membrane Interactions via Cyclic GMP-Dependent Protein Kinase 2. Mol Cell Biol. 36:3086–3099. [DOI] [PMC free article] [PubMed] [Google Scholar]
- Cross DA, Alessi DR, Cohen P, Andjelkovich M, Hemmings BA. (1995) Inhibition of glycogen synthase kinase-3 by insulin mediated by protein kinase B. Nature. 378:785–9. [DOI] [PubMed] [Google Scholar]
- Dent P, Lavoinne A, Nakielny S, Caudwell FB, Watt P, Cohen P. (1990) The molecular mechanism by which insulin stimulates glycogen synthesis in mammalian skeletal muscle. Nature. 348:302–8. [DOI] [PubMed] [Google Scholar]
- Echavarria I, López-Tarruella S, Márquez-Rodas I, Jerez Y, Martin M. (2017) Neratinib for the treatment of HER2-positive early stage breast cancer. Expert Rev Anticancer Ther. 17:669–679. [DOI] [PubMed] [Google Scholar]
- Fiedler M, Mendoza-Topaz C, Rutherford TJ, Mieszczanek J, Bienz M. (2011) Dishevelled interacts with the DIX domain polymerization interface of Axin to interfere with its function in down-regulating βcatenin. Proc. Nat. Acad. Sci. USA 108: 1937–42. [DOI] [PMC free article] [PubMed] [Google Scholar]
- Gottardi CJ, Peifer M. (2008) Terminal regions of beta-catenin come into view. Structure. 16: 336–8. [DOI] [PMC free article] [PubMed] [Google Scholar]
- Kimelman D, Xu W. (2006) beta-catenin destruction complex: insights and questions from a structural perspective. Oncogene. 25: 7482–91. [DOI] [PubMed] [Google Scholar]
- Liu J, Xing Y, Hinds TR, Zheng J, Xu W. (2006) The third 20 amino acid repeat is the tightest binding site of APC for beta-catenin. J. of Mol. Biol 360: 133–44. [DOI] [PubMed] [Google Scholar]
- MacDonald BT, Tamai K and He X. (2009) Wnt/β-catenin signaling: components, mechanisms, and diseases. Dev Cell. 17: 9–26. [DOI] [PMC free article] [PubMed] [Google Scholar]
- Markowitz SD, Bertagnolli MM. (2009) Molecular origins of cancer: Molecular basis of colorectal cancer. The New England Journal of Medicine. 361: 2449–60. [DOI] [PMC free article] [PubMed] [Google Scholar]
- Qi X, Xie C, Hou S, Li G, Yin N, Dong L, Lepp A, Chesnik MA, Mirza SP, Szabo A, Tsai S, Basir Z, Wu S, Chen G. (2014) Identification of a ternary protein-complex as a therapeutic target for K-Ras-dependent colon cancer. Oncotarget. 5:4269–82. [DOI] [PMC free article] [PubMed] [Google Scholar]
- Røed Skårderud M, Polk A, Kjeldgaard Vistisen K, Larsen FO, Nielsen DL. (2018) Efficacy and safety of regorafenib in the treatment of metastatic colorectal cancer: A systematic review. Cancer Treat Rev. 62:61–73. [DOI] [PubMed] [Google Scholar]
- Tavallai M, Hamed HA, Roberts JL, Cruickshanks N, Chuckalovcak J, Poklepovic A, Booth L, Dent P. (2015) Nexavar/Stivarga and viagra interact to kill tumor cells. J Cell Physiol. 230:2281–98. [DOI] [PMC free article] [PubMed] [Google Scholar]
- Zhang QJ, McMillin SL, Tanner JM, Palionyte M, Abel ED, Symons JD. (2009) Endothelial nitric oxide synthase phosphorylation in treadmill-running mice: role of vascular signalling kinases. J Physiol. 587:3911–20. [DOI] [PMC free article] [PubMed] [Google Scholar]


