Abstract
The current state of consumer-grade electronics means that researchers, clinicians, students, and members of the general public across the globe can create high-quality auditory stimuli using tablet computers, built-in sound hardware, and calibrated consumer-grade headphones. Our laboratories have created a free application that supports this work: PART (Portable Automated Rapid Testing). PART has implemented a range of psychoacoustical tasks including: spatial release from speech-on-speech masking, binaural sensitivity, gap discrimination, temporal modulation, spectral modulation, and spectrotemporal modulation (STM). Here, data from the spatial release and STM tasks are presented. Data were collected across the globe on tablet computers using applications available for free download, built-in sound hardware, and calibrated consumer-grade headphones. Spatial release results were as good or better than those obtained with standard laboratory methods. Spectrotemporal modulation thresholds were obtained rapidly and, for younger normal hearing listeners, were also as good or better than those in the literature. For older hearing impaired listeners, rapid testing resulted in similar thresholds to those reported in the literature. Listeners at five different testing sites produced very similar STM thresholds, despite a variety of testing conditions and calibration routines. Download Spatial Release, PART, and Listen: An Auditory Training Experience for free at https://bgc.ucr.edu/games/.
1. INTRODUCTION
The current state of consumer-grade electronics means that researchers, clinicians, students, and members of the general public across the globe can create high-quality auditory stimuli using tablet computers, built-in sound hardware, and calibrated consumer-grade headphones. Our laboratories have created a free application that supports this work: PART (Portable Automated Rapid Testing; https://bgc.ucr.edu/games/). PART has implemented a range of psychoacoustical tasks including: spatial release from speech-on-speech masking, binaural sensitivity, gap discrimination, temporal modulation, spectral modulation, and spectrotemporal modulation.
PART leverages consumer technologies associated with the latest generation of mobile gaming, which are high-performance interactive audio-visual systems supported by the tools and community of the $100 billion dollar gaming industry.
Here we present data suggesting that we have met the technical milestones that will allow us to achieve the goal of bringing PART to the home, the clinic, and research environments in a way that would be easily accessible to clinicians, researchers in other fields, students, and the general public. Specifically, we have verified that the system performs within design specifications by acoustic analysis of the sound output and comparison of behavioral thresholds to those obtained using traditional methods.
The extent to which valid performance can be obtained shows that such test methods could be used by individuals such as researchers without access to a full laboratory, clinicians interested in evaluating auditory function beyond the audiogram, consumers purchasing assistive listening devices over the internet at home, and students as part of their training. The tests may also have other uses not yet imagined.
2. ACOUSTICAL VALIDATION
A. PART SYSTEM
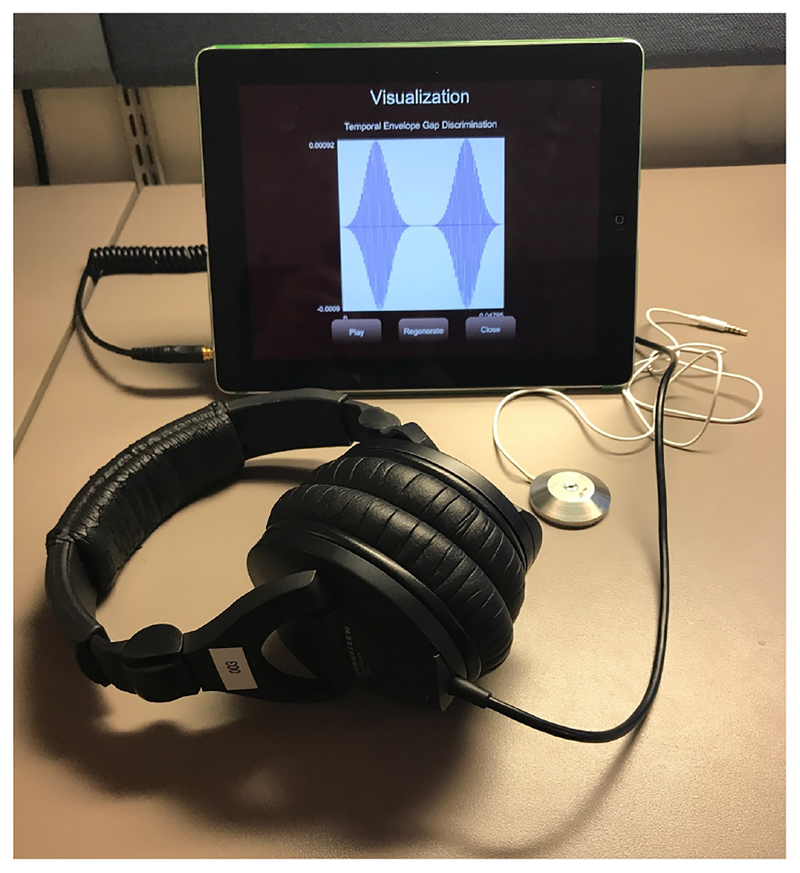
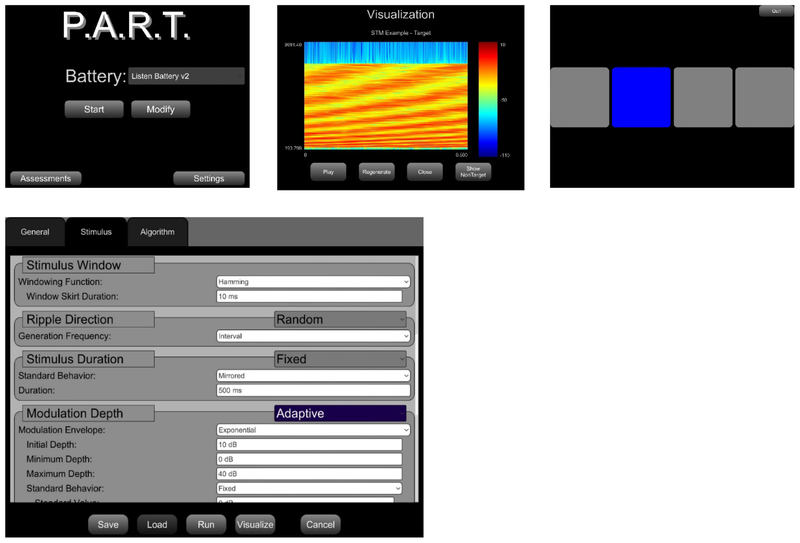
The tablet-based system is shown in Figure 1: an iPad Pro running custom PART app written in Unity, connected to Sennheiser HD 280 Pro headphones. Figures 2–5 show acoustical validation measures performed with a Brüel & Kjær Head and Torso Simulator with Artificial Ears in the VA RR&D NCRAR anechoic chamber. No modifications were made to the iPad or to the headphones. Calibration was conducted using the iBoundary microphone shown in Figure 1, which was connected to another iPad running the NIOSH Sound Level Meter App. Calibration of the microphone was conducted by comparing the sound pressure levels (SPLs) measured by the Head and Torso Simulator with the SPLs measured with the microphone. More details, including an example of the user interface for testing, are shown in Figure 11.
Figure 1.
PART System
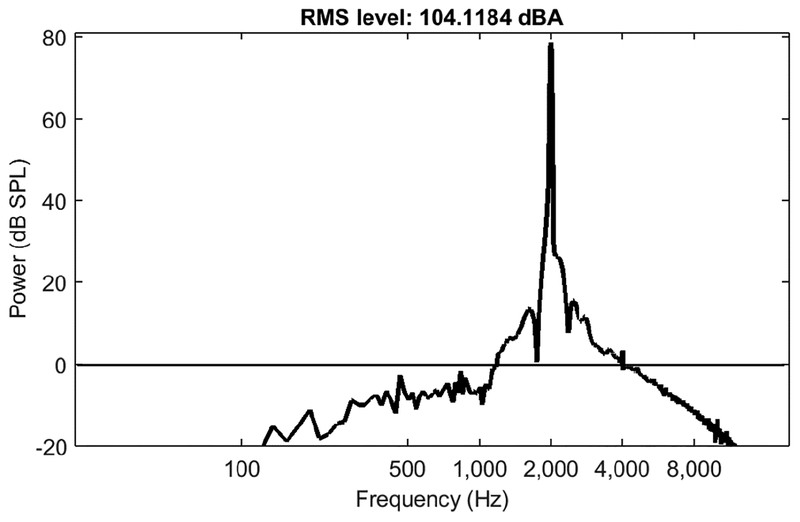
Figure 2.
Single pulse from PART system (power vs frequency)
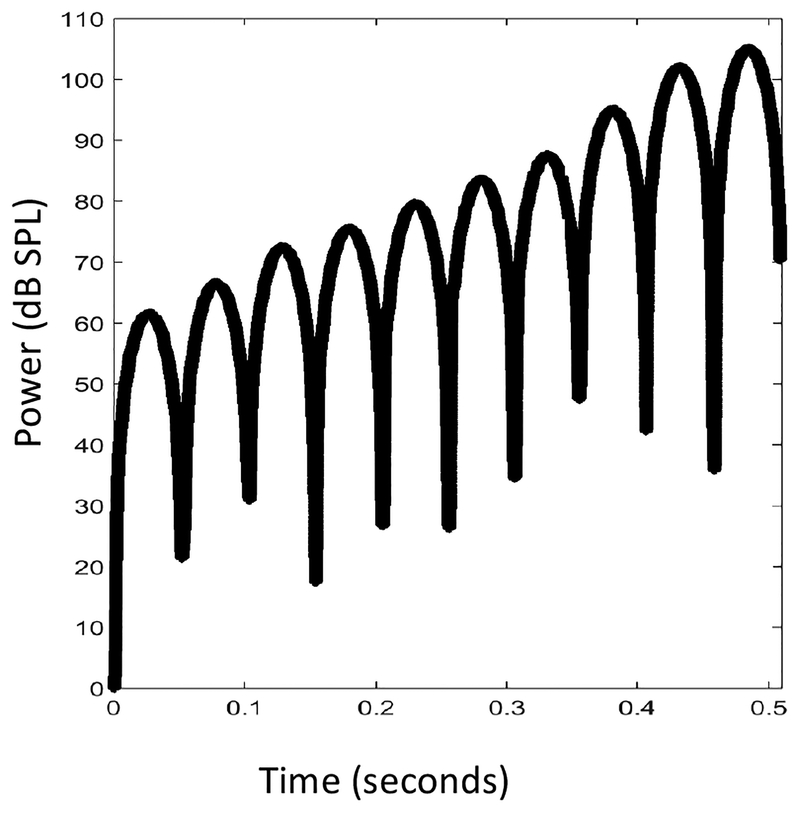
Figure 5.
10 pulses (power vs time)
Figure 11.
Screenshots from the PART Application.
B. EVALUATION STIMULI
To assess the output of the system, PART was used to generate 50 ms Gaussian-enveloped 2000-Hz tone pulses increasing in level from 60 to 105 dB, which were recorded with the head and torso simulator. These recordings are shown in Figures 2–5, analyzed in the time and frequency domains as a function of pressure and power.
C. ACOUSTICAL OUTPUTS OF THE CONSUMER ELECTRONICS COMPRISING PART
Data shown in Figures 2–5 demonstrate that the linearity, temporal precision, harmonic distortion, and dynamic range allow for the presentation of high-quality signals. All measures are within the range of performance of many much more expensive systems currently in use in psychophysical laboratories around the world.
Figure 2 shows the frequency-domain representation of a single 50 ms pulse with a 2000 Hz carrier presented at a peak-to-peak pure-tone equivalent level of 105 dB. Analysis shows that the output is within 1 dB of the specified output despite the very high level, and that the distortion products are well below 60 dB. For signals used in psychological testing, which are unlikely to exceed 90 dB, the off-frequency energy would be inaudible.
Figure 3 shows the time-domain representation of a 100 dB SPL pulse, in Pascals. The regularity of the time waveform is consistent with the precision apparent in the frequency domain for the 105 dB pulse in Figure 2.
Figure 3.
Single pulse recorded from PART system at maximum pressure (pressure vs time)
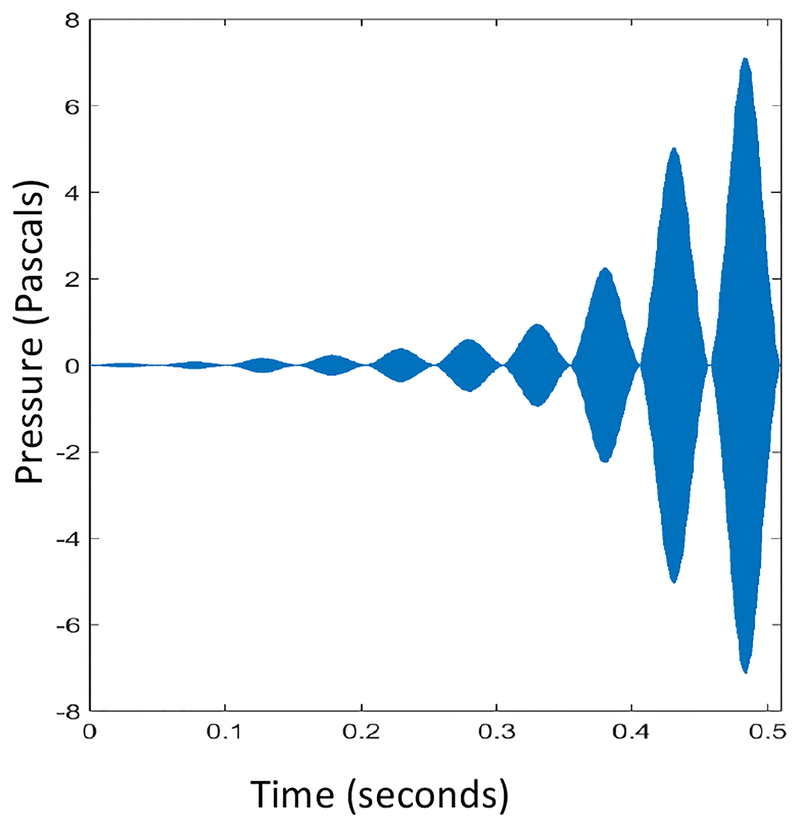
Figures 4 and 5 show the series of pulses in the time and frequency domain. It can be seen that the same temporal precision and acoustical regularity seen at high levels is present at lower levels, and that the nominal values of 60–105 dB SPL produce outputs very close to these values.
Figure 4.
10 pulses (pressure vs time)
3. PSYCHOPHYSICAL EVALUATION
Having shown that the signals generated are capable of the precision needed for laboratory-grade auditory experiments, we now turn to the ability of PART to generate high-quality psychoacoustical data. Data from three behavioral tests are used to show the ability of the PART system to match existing gold-standard systems and published data.
A. SPEECH IN QUIET
The gold standard for speech testing is the Speech Reception Threshold (SRT) measured with an audiometer designed to meet international standards and calibrated using procedures laid out in those same standards. In this study we compared SRTs measured by an audiologist with speech-recognition thresholds measured in quiet using the Spatial Release Application, which is an early version of PART that is specialized for speech-on-speech masking.
All testing was completed at Oregon Health and Science University (OHSU) and the VA Portland Health Care System (VAPORHCS). The SRT task was administered by an audiologist using a calibrated audiometer and ER3A earphones. The closed-set automated speech identification task was administered using Spatial Release, in which sentences spoken by a single talker from the Coordinate Response Measure (CRM; Bolia et al., 2000) are reported using the color-number grid shown in Figure 8. Participants at OHSU were 28 volunteers aged 18–85 yrs (mean of 47.6 yrs) with hearing that was normal to moderately impaired.
Figure 8.
Screenshots from the Spatial Release Application.
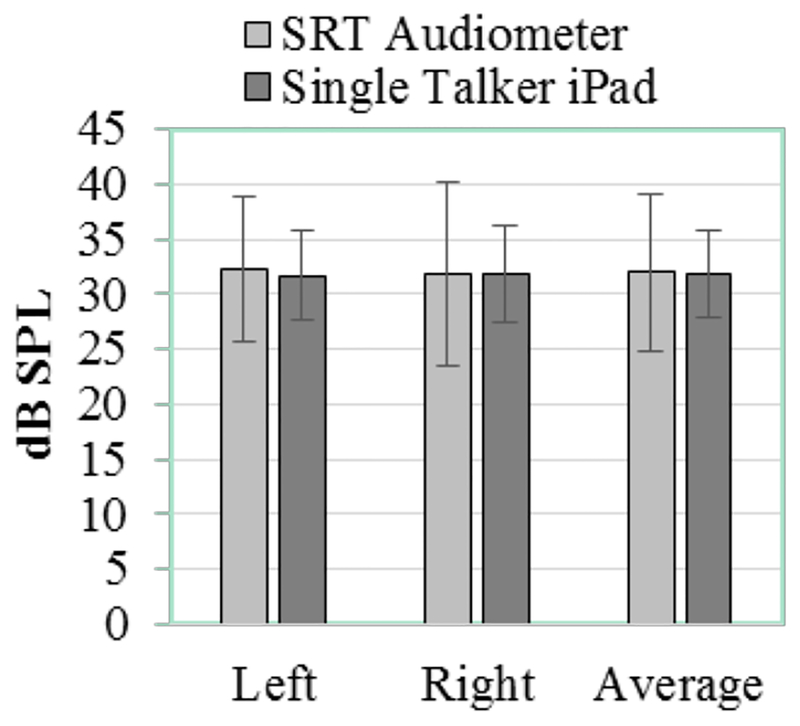
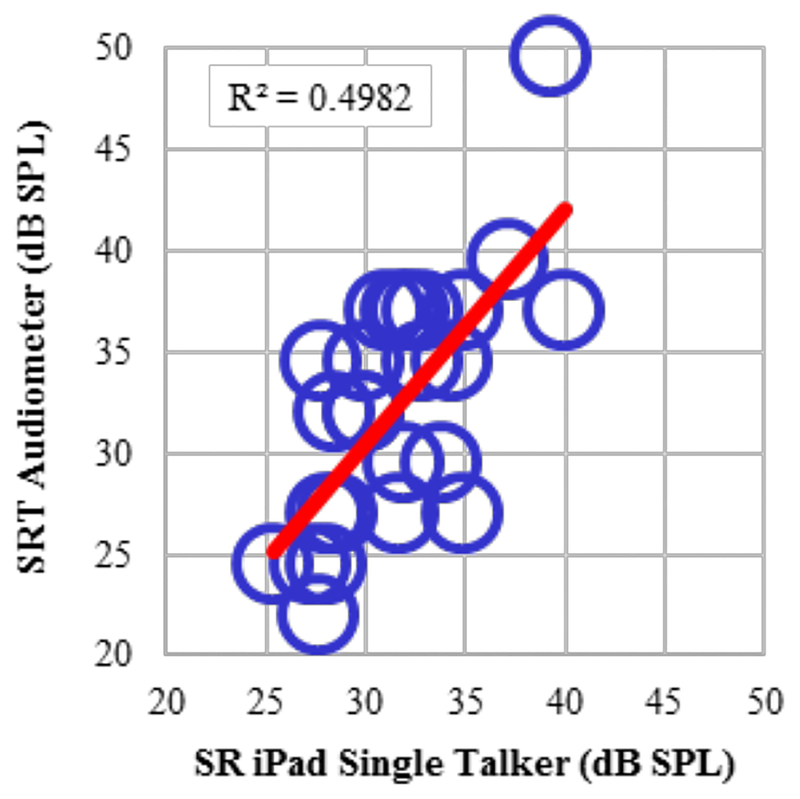
As shown in Figure 6, the SRT values with the audiometer were very similar to thresholds from Spatial Release, once both were converted into dB SPL. The average data were also representative of the values for the individual listeners, as shown by the thresholds for the average of the two ears for the 28 listeners shown in Figure 7. The best-fit line (R2= .498) is very near the unity line (where 30 dB = 30 dB), and the largest deviation is for the participant with an SRT of 50 dB who performed near 40 dB on the iPad.
Figure 6.
Left ear, right ear, and average speech identification thresholds in SPL for the SRT and for single-talker closed-set keyword identification in quite on the ipad.
Figure 7.
Correlations between average of left and right ear SRTs and average of left and right ear single Talker thresholds collected on the ipad
These results confirm that performance on the iPad is a strong predictor of performance with an audiometer and indicate that the PART system is capable of performance near that of the gold standard, even at levels near the lower limits of human hearing.
B. SPATIAL RELEASE FROM MASKING
While it is useful to see the extent to which the SRT and the single talker test are consistent, the goal of PART is not to replace the audiometer, but to bring laboratory tests of auditory processing ability into the clinic alongside the audiometer. The second test did this by using the spatial release from masking (SRM) task described by Gallun et al. (2013).
Participants were the same 28 OHSU listeners described above and 47 Case Western Reserve University (CWRU) listeners (age 18–22, mean age 19.2 yrs). Each participant completed the Single Talker task described above (Speech in Quiet) and then, using the Single Talker thresholds to set the level of the target, each participant was tested in two conditions of speech-on-speech masking. In the colocated condition, three male talkers all located at 0 degrees in a virtual spatial array, spoke sentences from the CRM, each with a different call sign, color, and number. In the spatially separated condition, the three sentences were located 45 degrees apart from each other, with the target at 0 degrees and the two maskers at +/− 45 degrees.
The participants responded by choosing the color-number combination spoken by a given callsign on a screen that displayed all color and number options. A progressive tracking procedure presented an 18 dB range of target to masker ratios (TMRs) in 20 trials, and threshold was estimated based on the number of correct responses across all 20 trials (see Gallun et al., 2013 and Jakien et al., 2017 for details). SRM was defined as the difference in TMR between the colocated and spatially separated thresholds.
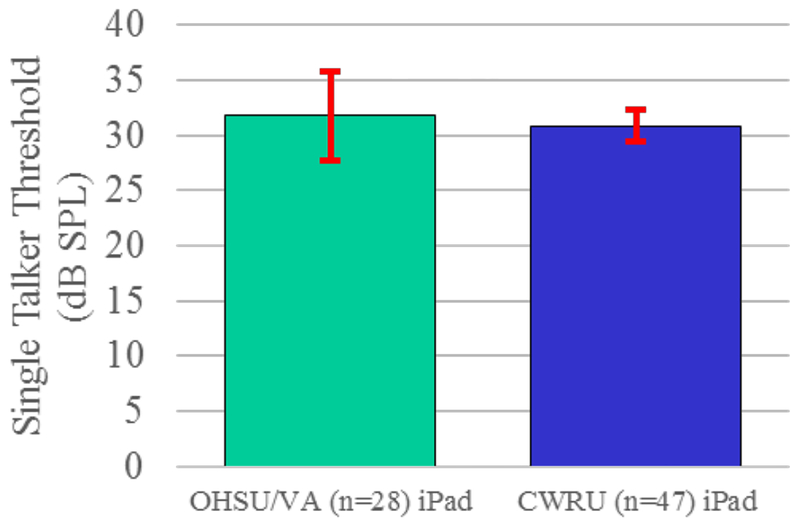
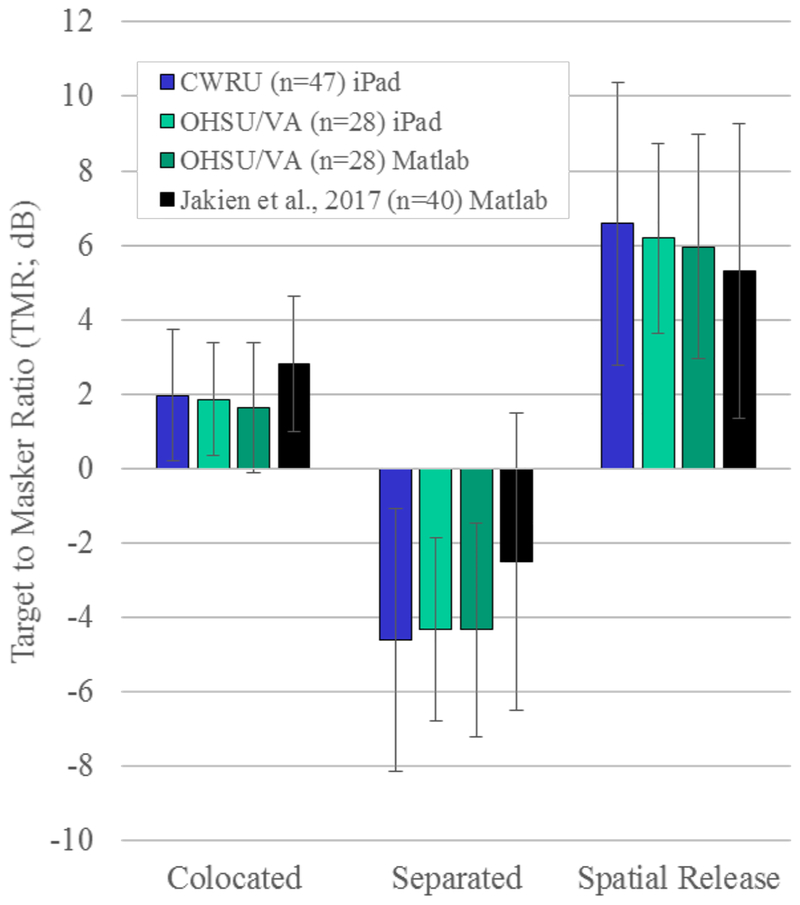
Single Talker speech in quiet thresholds were very similar across the two sites, despite the larger range of ages at OHSU (Table 1, Figure 9). Speech on speech masking and spatial release were also very similar across sites and across methods (Table 1, Figure 10). Results were similar to published data (Jakien et al., 2017), shown in Figure 10 and reproduced in Table 1. The slightly worse thresholds in Jakien et al. (2017) were likely due to the greater range of hearing loss in that sample.
Table 1.
Average speech recognition performance across sites and conditions, and in comparison with the data in the literature (Jakien et al., 2017).
| Single Talker | Colocated | Separated | Spatial Release | |
|---|---|---|---|---|
| OHSU/VA (n=28) iPad | 31.77 | 1.85 | −4.33 | 6.19 |
| CWRU (n=47) iPad | 30.87 | 1.96 | −4.62 | 6.57 |
| Jakien et al., 2017 (n=40)Matlab | 2.80 | −2.50 | 5.30 | |
| OHSUAA (n=28) Matlab | 1.63 | −4.33 | 5.96 | |
Figure 9.
Single Talker thresholds for 75 listeners tested at two different sites with iPad systems.
Figure 10.
Speech on speech masking and spatial release measures for 75 listeners tested at two different sites with iPad systems, compared with results for the traditional Matlab-based testing, both on the same OHSU listeners on the same test visit and as compared with published data.
C. SPECTROTEMPORAL MODULATION SENSITIVITY
The final psychophysical test examined was sensitivity to spectrotemporal modulation (STM; Chi et al., 1999). STM sensitivity has been shown to differ among listeners with different amounts of hearing loss and is correlated with speech understanding in noise among those with impaired hearing (Bernstein et al., 2013). Participants were 70 listeners whose age and hearing status ranged between young normal hearing (YNH) and older hearing impaired (OHI) volunteers. Listeners were drawn from 5 test sites:
Students at Pavel Jozef Safarik University (PJSU) and Western Washington University (WWU) completed testing as part of a class, which demonstrates the utility of PART as a teaching tool.
Students at University of California, Riverside (UCR) were tested as part of an auditory training experiment, which demonstrates the utility of PART for rapid evaluation of auditory function beyond the audiogram.
Volunteers at Northwestern University (NU) and OHSU/VA were tested as part of a battery of tests designed to better understand the relationships among aging, hearing loss, and speech understanding.
i. Procedure
The following procedures were followed:
Following work done on spectral modulation detection (e.g., Summers & Leek, 1994; Eddins & Bero 2007), STM was implemented with sinusoidal modulation on a log scale (dB) in both temporal and spectral domains, rather than sinusoidal in linear amplitude in the spectral domain (Chi et al., 1999; Bernstein et al., 2013). The resulting excitation pattern is sinusoidal to a first approximation and is consistent with the use of dB in various models of across-frequency intensity discrimination including profile analysis (Green 1987) and the excitation pattern model (Zwicker 1970).
Four stimuli were presented on every trial, with either the second or third containing modulation and the others having a flat spectrum (user interface shown in Figure 11).
The modulation depth was adaptively varied to provide an estimate of threshold.
STM thresholds for 2 cycles/octave and 4 Hz averaged across two runs.
- Due to differences in experimental protocols, slight variations occurred across sites:
- WWU, UCR, and OHSU/VA presented all stimuli diotically at a level of 70 dB SPL, with a 3 dB level rove on each presentation interval.
- To account for potential variations in detection thresholds, NU and PJSU listeners first performed a noise burst detection task and levels were set at 30 dB above detection threshold.
- For the PJSU students, levels were between 55–60 dB SPL; for the OHI volunteers at NU, levels varied between 60 and 95 dB SPL.
ii. Discussion
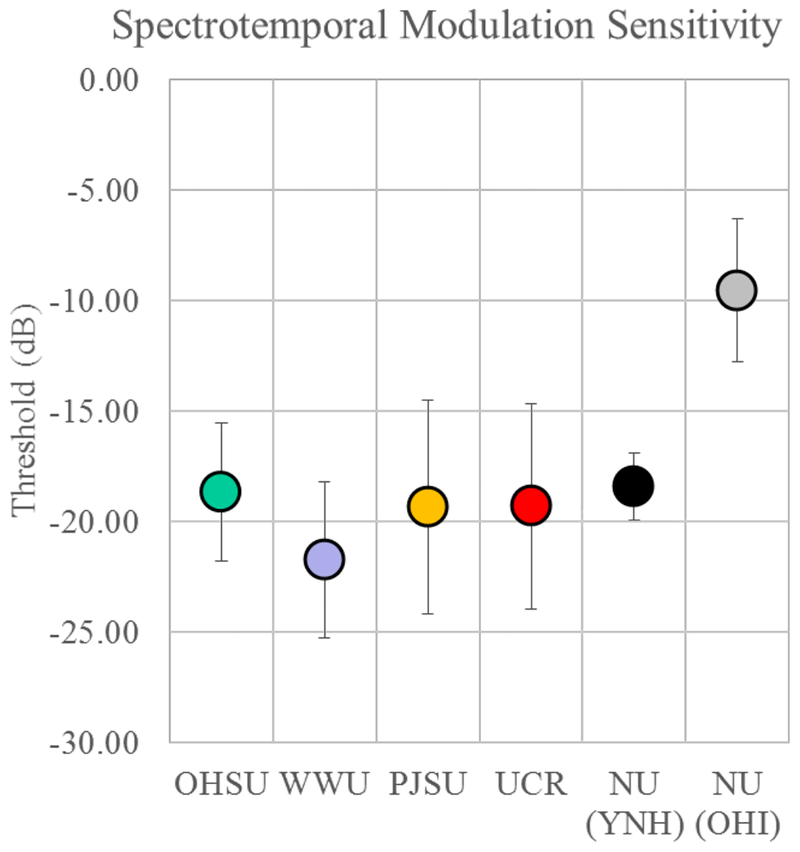
Figure 12 and Table 2 show the extremely consistent average thresholds across all five sites for YNH listeners. The slight increase at OHSU/VA is consistent with the larger age range and greater range of hearing thresholds compared with the students and other YNH listeners.
Figure 12.
STM sensitivity for 70 listeners tested at five different sites using the PART iPad system.
Table 2.
Average STM sensitivity across sites, as shown in Figure 12, and in comparison with the data in the literature (Chi et al., 1999; Bernstein et al., 2013).
| n | mean | stdev | |
|---|---|---|---|
| OHSU/VA | 11 | −18.67 | 3.12 |
| Western Washington (WWU) | 7 | −21.74 | 3.51 |
| Safarik (PJSU) | 12 | −19.34 | 4.84 |
| Riverside (UCR) | 22 | −19.31 | 4.66 |
| Northwestern (NU) (YNH) | 4 | −18.42 | 1.51 |
| Bernstein et al. (2013): YNH | 8 | −14 | |
| Chi et a. (1999); YNH | 4 | −22 | |
| NU (OHI) | 14 | −9.54 | 3.26 |
| Bernstein et al. (2013): OHI | 12 | −9 |
It is also clear that the OHI listeners at NU performed worse than the YNH and similarly to the listeners with hearing loss in the literature (Bernstein et al., 2013). Interestingly, the YNH outperformed the thresholds in Bernstein et al. (2013), but were similar to those reported in Chi et al. (1999). Differences in stimulus generation methods as well as duration are most likely responsible.
4. CONCLUSIONS
These data from 75 listeners for Spatial Release and 70 listeners for PART show that a tablet-based method of auditory testing can produce thresholds similar to those in a laboratory setting, consistent across sites, and capable of being compared with the data in the literature. Specifically, these data reveal the following:
Acoustical performance of the tablet-based system is comparable to that of considerably more expensive high-quality laboratory systems. High output levels can be obtained with high accuracy and acceptable levels of distortion. Low-level signals are also produced reliably, as revealed by the similarity of speech recognition thresholds on the tablet with the speech reception threshold (SRT) measured using gold-standard audiometry. Low-level signals result in similar speech thresholds in quiet across multiple sites using different calibration methods and different testing rooms.
Speech on speech masking results show that the same effects of spatial separation using simulated spatial locations over headphones and thresholds are as good or better than those obtained with standard laboratory methods. Jakien et al. (2017) also showed that those laboratory measures are good predictors of performance in an anechoic chamber with real loudspeakers. This shows that the iPad system is also capable of producing results comparable to the data obtained in an anechoic chamber.
Spectrotemporal modulation thresholds were obtained rapidly and, for YNH listeners, were also as good or better than those in the literature. For OHI listeners, rapid testing resulted in similar thresholds to those reported previously (Bernstein et al., 2013).
Listeners at five different testing sites produced very similar STM thresholds, despite a variety of testing conditions and calibration routines. This shows that the iPad system can be used to improve the reliability and replicability of the data obtained. This is very important if these tests are to be used clinically.
Students used the PART system to learn about psychophysical testing, showing the utility of this tool for teaching as well as research.
Download Spatial Release, PART, and Listen: An Auditory Training Experience for free at https://bgc.ucr.edu/games/
ACKNOWLEDGMENTS
We are grateful to the Veterans and non-Veterans who volunteered their time to participate in this project. This work was funded by NIH NIDCD R01 DC015051, R01 DC006014, R03 HD094234, and EU RISE 691229. Equipment and engineering support provided by the VA RR&D NCRAR, the UCR Brain Game Center, and Samuel Gordon (NCRAR). The views expressed are those of the authors and do not represent the views of the NIH or the Department of Veterans Affairs.
Contributor Information
Frederick J. Gallun, VA RR&D National Center for Rehabilitative Auditory Research, Portland VA Medical Center, Portland, OR, 97239; Frederick.Gallun@va.gov
Aaron Seitz, University of California, Riverside, Riverside, CA; aseitz@ucr.edu.
David A. Eddins, University of South Florida, Tampa, FL; deddins@usf.edu
Michelle R. Molis, VA RR&D National Center for Rehabilitative Auditory Research, Portland VA Medical Center, Portland, OR, 97239; Michelle.Molis@va.gov
Trevor Stavropoulos, University of California, Riverside, Riverside, CA; trevor.stavropoulos@ucr.edu.
Kasey M. Jakien, VA RR&D National Center for Rehabilitative Auditory Research, Portland VA Medical Center, Portland, OR, 97239; Kasey.Jakien@va.gov;
Sean D. Kampel, VA RR&D National Center for Rehabilitative Auditory Research, Portland VA Medical Center, Portland, OR, 97239; Sean.Kampel@va.gov
Anna C. Diedesch, Western Washington University, Bellingham, WA; anna.diedesch@wwu.edu
Eric C. Hoover, University of Maryland, College Park, MD; erichoover@usf.edu
Karen Bell, University of South Florida, Tampa, FL; kbell2@usf.edu.
Pamela E. Souza, Northwestern University, Evanston, IL; p-souza@northwestern.edu;
Melissa Sherman, Northwestern University, Evanston, IL; melissa.sherman1@northwestern.edu.
Lauren Calandruccio, Case Western Reserve University, Cleveland, OH; lauren.calandruccio@case.edu;.
Gretchen Xue, Case Western Reserve University, Cleveland, OH; gxx30@case.edu;.
Nardine Taleb, Case Western Reserve University, Cleveland, OH; nmt29@case.edu.
Rene Sebena, Pavol Jozef Safarik University, Kosice, SLOVAKIA; rene.sebena@gmail.com.
Nirmal Srinivasan, Towson University, Towson, MD; nsrinivasan@towson.edu.
REFERENCES
- Bernstein JGW, Mehraei G Shamma S, Gallun FJ, Theodoroff S & Leek MR (2013). Spectrotemporal modulation sensitivity as a predictor of speech intelligibility for hearing impaired listeners. Journal of the American Academy of Audiology, 24 (4), 293–306. [DOI] [PMC free article] [PubMed] [Google Scholar]
- Bolia RS, Nelson WT, Ericson MA, & Simpson BD (2000). A speech corpus for multitalker communications research. The Journal of the Acoustical Society of America, 107(2), 1065–1066. [DOI] [PubMed] [Google Scholar]
- Chi T, Gao Y, Guyton MC, Ru P, & Shamma S (1999). Spectro-temporal modulation transfer functions and speech intelligibility. Journal of the Acoustical Society of America, 106(5), 2719–2732. [DOI] [PubMed] [Google Scholar]
- Eddins DA, & Bero EM (2007). Spectral modulation detection as a function of modulation frequency, carrier bandwidth, and carrier frequency region. Journal of the Acoustical Society of America, 121(1), 363–372. [DOI] [PubMed] [Google Scholar]
- Jakien KM, Kampel SD, Stansell MM, Gallun FJ (2017) Validationg a rapid, automated test of spatial release from masking. American Journal of Audiology. 26 (4), 507–518 [DOI] [PMC free article] [PubMed] [Google Scholar]
- Summers V, and Leek MR (1994). The internal representation of spectral contrast in hearing-impaired listeners. Journal of the Acoustical Society of America. 95, 3518–3528. [DOI] [PubMed] [Google Scholar]


