

Abstract
Changes to extracellular matrix (ECM) structures are linked to tumor cell proliferation and metastasis. We previously reported that naturally occurring peptides of collagen type I are elevated in urine of patients with colorectal liver metastasis (CRLM). In the present study, we took an MS-based proteomic approach to identify specific collagen types that are up-regulated in CRLM tissues compared with healthy, adjacent liver tissues from the same patients. We found that 19 of 22 collagen-α chains are significantly up-regulated (p < 0.05) in CRLM tissues compared with the healthy tissues. At least four collagen-α chains were absent or had low expression in healthy colon and adjacent tissues, but were highly abundant in both colorectal cancer (CRC) and CRLM tissues. This expression pattern was also observed for six noncollagen colon-specific proteins, two of which (CDH17 and PPP1R1B/DARP-32) had not previously been linked to CRLM. Furthermore, we observed CRLM-associated up-regulation of 16 proteins (of 20 associated proteins identified) known to be required for collagen synthesis, indicating increased collagen production in CRLM. Immunohistochemistry validated that collagen type XII is significantly up-regulated in CRLM. The results of this study indicate that most collagen isoforms are up-regulated in CRLM compared with healthy tissues, most likely as a result of an increased collagen production in the metastatic cells. Our findings provide further insight into morphological changes in the ECM in CRLM and help explain the finding of tumor metastasis–associated proteins and peptides in urine, suggesting their utility as metastasis biomarkers.
Keywords: collagen, colorectal cancer, mass spectrometry (MS), extracellular matrix protein, liver cancer, proteomics, colon cancer, colorectal liver metastasis (CRLM), hepatocarcinoma, immunohistochemistry, metastasis
Introduction
The collagen protein family is well-studied, having 8000+ publications annually over the last 5 years (based on the PubMed index, July 2018). Despite the large number of annual publications, there is still a need to explore collagen and its functions. It is believed that deepening the understanding of collagen will eventually lead to significant contributions in important fields such as cancer, fibrosis, and regenerative medicine (1).
It is well-known that the loss of the normal structure of the extracellular matrix (ECM),2 including the major component collagen, has been associated with enhanced tumor proliferation (2, 3). Tumor proliferation changes the function of collagen (4, 5), and it has been shown that these changes are dependent on changes of individual collagen levels, as shown by Nyström et al. (6) for colorectal cancer (CRC). These changes have been suggested to play a role in chemoresistance and increased cell proliferation becoming a vicious circle. Naba et al. (7) showed differences of ECM proteins in colorectal liver metastasis (CRLM) compared with healthy liver in an underpowered sample set (n = 3). However, a sufficiently powered study regarding the concentration of specific collagen types in CRLM is lacking.
As a result of CRLM, it has been shown that an up-regulation of collagen can be observed in urine (8, 9) and plasma (10). Increased excretion of collagen in urine and plasma may be explained by a higher rate of tissue remodeling and turnover, as matrix metalloproteinases (MMPs) (11–13) are differently expressed in CRLM and CRC compared with healthy liver and colon tissue, respectively (14–16). However, the up-regulation in CRLM of proteins related to collagen production has not been shown.
We aim to study the changes in collagen induced by CRLM with MS in a well-powered data set. We determined which specific collagen types are altered, whether proteins in the collagen turnover pathway are altered, and whether we can define a specific protein footprint of the primary tumor in the metastasis.
Results
Patient characteristics
Patients with CRLM had a median age of 69.2 years (interquartile range (IQR) 60.5–74.7 years) and were mostly male (66.7%). Patients had a median of 1 (maximum 7) tumor, being moderately differentiated in 28 of 30 patients. The CRLM tumor had a median size of 2.4 cm (IQR 1.4–3.5 cm). The primary tumor was located in the colon (47%), rectum (43%), and sigmoid (10%). Patients with CRC had a median overall age of 71.1 years (IQR 54.8–80.9 years). The patients with liver fibrosis (FIB; ranging from moderate to severe fibrosis) had a median overall age of 59 years (IQR 58–59 years) and were all male. These patients developed fibrosis due to a combination of different causes: viral hepatitis (3 of 5), HCC (5 of 5), steatosis (1 of 5), and steatohepatitis (2 of 5). Additional information is found in supporting information S4.
Data assessment
Normalization
Normalized values obtained from healthy adjacent liver tissue (control) and CRLM tissue did not differ significantly (p = 0.58).
Permutation
In the true data set of control versus CRLM tissue, 5812 of the 20,635 peptides (28.1%) were tested significantly different. In the permutated data, an average of 631 (3%) peptides were significantly different. The true data set contained more significant peptides than the average of the permutation plus twice the S.D. (5812 ≫ ∼631; p < 0.05) of the permutated data.
Proteomics
Top 10 proteins down- and up-regulated
In total, 2817 proteins were identified in CRLM and control tissue (see supporting information S8). The 10 proteins with the highest absolute number of down- and up-regulated peptides are shown in Table 1. Many down-regulated proteins were present in liver-specific pathways (Table 1). Furthermore, seven of the top 10 up-regulated proteins in CRLM tissue originated from ECM.
Table 1.
Top 10 proteins with the highest absolute number of peptides down- or up-regulated in CRLM
| Protein | Gene name | -Fold changea |
No. of peptidesb | |
|---|---|---|---|---|
| <0 | >0 | |||
| Down-regulated | ||||
| Carbamoyl-phosphate synthase (ammonia), mitochondrial | CPS1 | 135 | 0 | 141 |
| Fatty acid synthase | FASN | 87 | 0 | 91 |
| Spectrin α chain, non-erythrocytic 1 | SPTAN1 | 62 | 0 | 87 |
| C-1-tetrahydrofolate synthase, cytoplasmic | MTHFD1 | 55 | 0 | 57 |
| Glycogen debranching enzyme | AGL | 46 | 0 | 46 |
| Cytosolic 10-formyltetrahydrofolate dehydrogenase | ALDH1L1 | 44 | 0 | 48 |
| Aldehyde oxidase | AOX1 | 40 | 0 | 43 |
| Pyruvate carboxylase, mitochondrial | PC | 40 | 1 | 46 |
| 3-Ketoacyl-CoA thiolase, mitochondrial | ACAA2 | 39 | 0 | 41 |
| Alcohol dehydrogenase 4 | ADH4 | 39 | 0 | 41 |
| Up-regulated | ||||
| Collagen-α-1(I) chain | COL1A1 | 11 | 238 | 286 |
| Collagen-α-2(I) chain | COL1A2 | 10 | 158 | 189 |
| Collagen-α-1(III) chain | COL3A1 | 16 | 135 | 210 |
| Fibrillin-1 | FBN1 | 1 | 99 | 107 |
| Filamin-A | FLNA | 3 | 90 | 105 |
| Fibronectin | FN1 | 1 | 77 | 85 |
| Myosin-9 | MYH9 | 2 | 66 | 125 |
| Plectin | PLEC | 5 | 50 | 128 |
| Collagen-α-1(XII) chain | COL12A1 | 2 | 50 | 58 |
| Collagen-α-2(V) chain | COL5A1 | 1 | 49 | 50 |
a The number of peptides with a -fold change > 0 or < 0 and p < 0.05. The -fold change is based on log10 values.
b Number of identified peptides per protein. Gene names in boldface type are involved in liver processes (top half, down-regulated), gene names underlined are related to the ECM (bottom half, up-regulated).
Collagen in CRLM
We then analyzed the number of differentially expressed collagen peptides and collagen-α chains. In CLRM tissue, 1137 collagen peptides were identified, of which 819 peptides (72%) were up-regulated and 55 (4.9%) were down-regulated. Overall, we observed an increased collagen level in CRLM versus control tissue (p < 0.0001, linear -fold change 1.67). Furthermore, 19 of the 22 collagen-α chains were significantly up-regulated (Table 2). COL12A1 was the most differentially expressed collagen alpha chain (2-fold change, 86% of identified peptides (n = 50) significantly up-regulated). An unsupervised clustering was performed based on all collagen peptides that separated both groups, except for four samples (CRLM-5, -9, -10, and -25). The four samples (CRLM-8, -12, -19, and -21) containing up to 50% control tissue were evenly clustered within the CRLM group (Fig. 1). CRLM-10 had much lower MS intensities for collagen peptides than the rest of the CRLM samples. However, in the normalization process, this sample remained within the normal range of samples.
Table 2.
Types of collagen identified and the number of peptides significantly up- and down-regulated
| Collagen types | No. of peptidesa | -Fold change |
p valuec | -Fold changed | |
|---|---|---|---|---|---|
| >0b | <0b | ||||
| P02452 (COL01A1) | 286 | 239 | 11 | 1.84 × 10−09 | 1.7 |
| P08123 (COL01A2) | 189 | 158 | 10 | 9.4 × 10⁻¹⁰ | 1.7 |
| P02458 (COL02A1) | 5 | 1 | 0 | 2.4 × 10−03 | 1.2 |
| P02461 (COL03A1) | 210 | 135 | 16 | 7.6 × 10−06 | 1.5 |
| P02462 (COL04A1) | 33 | 24 | 3 | 7.0 × 10−07 | 1.5 |
| P08572 (COL04A2) | 33 | 30 | 0 | 2.92 × 10⁻¹² | 2.0 |
| P53420 (COL04A4)e | 1 | 1 | 0 | 5.19 × 10−06 | 1.9 |
| P20908 (COL05A1) | 31 | 30 | 0 | 3.15 × 10⁻¹⁴ | 2.0 |
| P05997 (COL05A2) | 50 | 49 | 1 | 7.73 × 10⁻¹⁶ | 2.3 |
| P25940 (COL05A3)e | 1 | 1 | 0 | 6.2 × 10−04 | 1.6 |
| P12109 (COL06A1) | 35 | 10 | 4 | 2.8 × 10−02 | 1.2 |
| P12110 (COL06A2) | 30 | 8 | 1 | 1.7 × 10−03 | 1.3 |
| P12111 (COL06A3) | 96 | 39 | 2 | 6.5 × 10−04 | 1.3 |
| Q02388 (COL07A1) | 2 | 2 | 0 | 9.7 × 10⁻¹¹ | 2.2 |
| P27658 (COL08A1)e | 1 | 0 | 1 | 1.1 × 10−02 | 0.7 |
| Q03692 (COL10A1) | 7 | 6 | 0 | 2.3 × 10−08 | 1.7 |
| P12107 (COL11A1) | 5 | 4 | 0 | 3.5 × 10⁻¹⁴ | 2.0 |
| Q99715 (COL12A1) | 58 | 50 | 2 | 6.9 × 10⁻¹⁴ | 2.0 |
| Q05707 (COL14A1) | 46 | 29 | 3 | 8.8 × 10−07 | 1.5 |
| P39059 (COL15A1) | 2 | 2 | 0 | 7.1 × 10−08 | 1.8 |
| Q07092 (COL16A1) | 2 | 1 | 0 | 6.7 × 10−01 | 1.0 |
| P39060 (COL18A1) | 14 | 1 | 1 | 6.2 × 10−01 | 1.0 |
a The number of peptides identified per collagen-α chain.
b The number of peptides with a -fold change >0 or <0 and p < 0.05. The -fold change is based on log10 values.
c Indicates the p value at the protein level.
d Indicates the true -fold change at the protein level (not the log10 value).
e These proteins are identified with one peptide, and their identification is considered as less reliable compared with proteins identified with two or more peptides.
Figure 1.

Unsupervised clustering at the patient level (horizontal) and collagen peptide level (vertical). The yellow and red regions at the top indicate control liver and CRLM tissue, respectively. The color scheme in the cluster analysis itself is from yellow (low) to red (high).
Collagen turnover–related proteins
The observed up-regulation of collagen in CRLM may be due to changes in the normal turnover of collagen in the liver. To test this hypothesis, 65 different proteins included in collagen turnover pathways were retrieved from the “reactome pathway knowledgebase” (17, 18). Twenty-four of these 65 proteins were identified, 17 (∼68%) of which were significantly up-regulated in CRLM tissue. Sixteen of the 17 up-regulated proteins are included in the collagen synthesis and/or fibril-forming pathways (Table 3). Supporting information S5 contains additional information.
Table 3.
An overview of the identified proteins involved in collagen synthesis and degradation
The listed proteins are involved in three different pathways, annotated as follows: F, assembly of collagen fibrils and other multimetric structures; B, collagen biosynthesis and modifying enzymes; D, collagen degradation. Green, up-regulated; red, down-regulated.
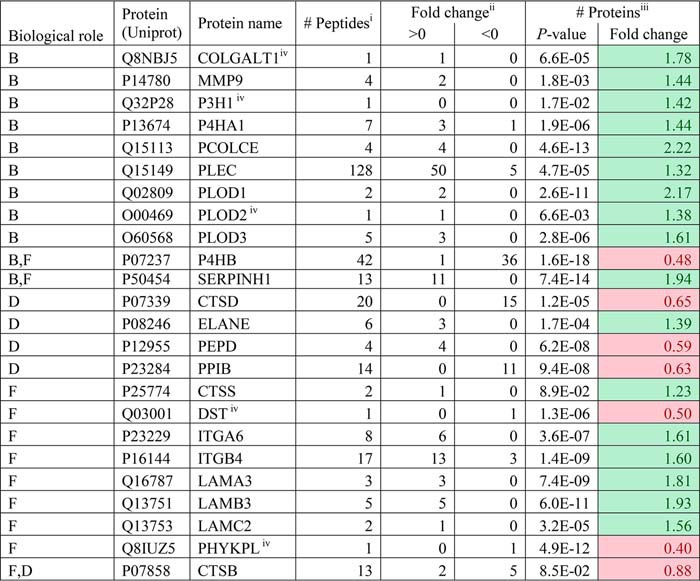
i Number of peptides identified per protein.
ii Number of peptides that are significantly different and have a -fold change >0 or <0. The -fold change is based on log10 values.
iii p values calculated over the summed ranked peptides followed by the -fold change. The -fold change shown is a true value (not a log10 value).
iv These proteins are identified with one peptide, and their identification is considered as less reliable compared with proteins identified with two or more peptides.
CRC protein signature in CRLM
Next, we studied the presence of a correlation between collagen levels in CRLM and CRC tissue. For COL10A1, COL12A1, COL14A1, and COL15A1, an absence or low number of unique peptides was observed in healthy colon and healthy liver tissue, but a higher number of unique peptides were present in CRC and CRLM tissues (supporting information S6), being most apparent for COL12A1.
Furthermore, the presence of proteins specific for colon tissue in CRLM and control tissues was studied. Elevated expression of 165 genes was found in colon tissue, and in CRLM tissue, 25 corresponding proteins were identified (Table 4). Supporting information S7 contains additional information. Six proteins matched the set criteria and were considered unique for colon tissue versus control liver tissue and were found to be significantly higher in CRLM tissue than control tissue.
Table 4.
Colon-specific proteins are up-regulated in CRLM
These 25 proteins were identified with proteomics and, according to the Human Protein Atlas, are elevated in colon tissue compared with all other tissue types.
| Protein | Genea | -Fold changeb |
No. of. peptidesc | |
|---|---|---|---|---|
| <0 | >0 | |||
| Villin 1 | VIL1 | 1 | 18 | 26 |
| Polymeric immunoglobulin receptor | PIGR | 2 | 12 | 19 |
| Fatty acid–binding protein 1 | FABP1 | 17 | 0 | 17 |
| Cadherin 17 | CDH17 | 1 | 11 | 16 |
| Keratin 20, type I | KRT20 | 0 | 11 | 15 |
| Carbonic anhydrase II | CA2 | 11 | 0 | 12 |
| Galectin-4 | LGALS4 | 0 | 6 | 10 |
| Carbonic anhydrase I | CA1 | 7 | 1 | 8 |
| UDP-glucuronosyltransferase 1–8 | UGT1A8 | 7 | 0 | 8 |
| Carcinoembryonic antigen-related cell adhesion molecule 5 | CEACAM5 | 0 | 5 | 7 |
| IgGFc-binding protein | FCGBP | 1 | 3 | 7 |
| Meprin A subunit α | MEP1A | 0 | 2 | 7 |
| Glycoprotein A33 | GPA33 | 0 | 5 | 6 |
| UDP-glucuronosyltransferase 2B15 | UGT2B15 | 5 | 0 | 6 |
| Mucin 13 | MUC13 | 0 | 5 | 5 |
| Protein phosphatase 1 regulatory subunit 1B | PPP1R1B/DARPP32 | 0 | 5 | 5 |
| Epidermal growth factor receptor kinase substrate 8-like protein 3 | EPS8L3 | 1 | 2 | 4 |
| Protein FAM3D | FAM3D | 0 | 2 | 4 |
| Carcinoembryonic antigen-related cell adhesion molecule 6 | CEACAM6 | 0 | 3 | 3 |
| Left-right determination factor 1 | LEFTY1 | 1 | 1 | 3 |
| Sulfotransferase family cytosolic 1B member 1 | SULT1B1 | 2 | 0 | 3 |
| Carcinoembryonic antigen-related cell adhesion molecule 1 | CEACAM1 | 0 | 2 | 2 |
| Carcinoembryonic antigen-related cell adhesion molecule 7 | CEACAM7 | 0 | 2 | 2 |
| Protein-arginine deiminase type-2 | PADI2 | 0 | 1 | 2 |
| UDP-glucuronosyltransferase 1–10 | UGT1A10 | 2 | 0 | 2 |
a Genes in boldface type are considered unique for colon tissue.
b Number of peptides that are significantly different (p < 0.05) and have a -fold change >0 or <0. The -fold change is based on log10 values.
c Total number of peptides identified for this protein.
Immunohistochemistry
MS data were cross-validated by IHC staining of COL12A1 in CRLM and control tissue. CRLM stroma tissue stained positive for COL12A1 (Fig. 2, a and b), except for three tissues (CRLM-19, -20, and -28; Fig. 2c). Control tissue did not show positive staining (Fig. 2d). The three negatively stained CRLM tissue sections did cluster with the rest of the CRLM samples by proteomics (Fig. 1). Based on summed peptide ranking, the COL12A1 values of the three negative IHC tissues were above 3 × S.D. of the control, and 0, 9, and 18 peptides, respectively, were identified per sample, indicating that by proteomics, these samples can be detected correctly.
Figure 2.

IHC staining of COL12A1. a, CRLM-1, IHC score 2; b, CRLM-8, IHC score 1.5; c, CRLM-20, IHC score 0; d, Control-8, IHC score 0; e, IHC scores for COL12A1 in control and CRLM tissue: 0, no staining; 0.5, small focal staining; 1, focal staining; 1.5, few focal staining areas; 2, several focal staining areas; 2.5, staining >40% and <50%; 3, >50% staining; f, FIB-1, IHC score 0; g, Control C-1, antibody NBP1-88062; h, Control C-1, antibody HPA009143, healthy tissue; i, CRC-5, IHC score: 1.
The IHC staining of COL12A1 is present in the ECM. However, the staining was not equally distributed in the ECM of the CRLM tissue. Furthermore, studying tissue sections to determine IHC scoring revealed distortions in the CRLM morphology compared with the control tissue (Fig. 2). In addition, CRC and healthy colon tissue (control C) were stained. CRC tissues showed, similar to CRLM, staining of the ECM for COL12A1. Staining was also observed in the nuclei of epithelial cells in healthy colon tissue by COL12A1 antibody NBP1-88062 (Fig. 2g). The other COL12A1 antibody (HPA009143) did not show staining of the epithelial cells but stained in addition to the collagen present in tumor stroma smooth muscle tissue (Fig. 2h). FIB liver tissue was stained by IHC for COL12A1, and no positive staining was observed (Fig. 2f).
Discussion
In this study, we focused on the presence of collagen in CRLM, and we showed by using proteomics that we could distinguish all 30 CRLM samples correctly from normal liver tissue in a relative detailed protein level. Twenty-two of the 44 known collagen-α chains were observed in CRLM and/or control tissue (healthy adjacent liver tissue). The remaining 22 chains were not identified, possibly due to low concentration or absence in the liver.
Previously, Naba et al. (7) showed the presence of specific collagen-α chains in colon, CRC, liver, and CRLM tissue in a small sample set (n = 3) including a pooled control (n = 2). Naba et al. (7) observed more collagen types, although they performed additional enrichment and extensive fractionation. The authors indicated that validation needs to be performed in a larger sample set, which was confirmed by our power calculation with an estimation of (minimum) 25 samples/group. In the present study, we analyzed matched control and CRLM tissue from 30 individuals, providing a well-powered data set. An up-regulation of collagen peptides (p < 0.0001) in CRLM tissue compared with control tissue was observed as well as up-regulation of individual collagen-α chains. Three collagen-α chains (COL8A1, COL16A1, and COL18A1) were not significantly affected. COL18A1 is mainly involved in the development of the eye (19), central nervous system, and liver structures (20, 21). Musso et al. (22) demonstrated that COL18A1 production is not increased in CRLM compared with liver tissue and therefore may be considered as a negative control. The low number (two or less) of identified peptides for COL4A4, COL5A3, COL7A1, COL8A1, COL15A1, and COL16A1 indicate relatively low levels in CRLM.
The increase in collagen is accompanied by an increase in proteins related to collagen synthesis, of which several have been described separately to stimulate tumor proliferation: P4HA1 (23, 24), PCOLCE (24), PLOD1 (24), PLOD2 (25), PLOD3 (24), and SERPINH1 (26). The number of proteins identified from the collagen degradation pathway was not sufficient to draw a conclusion regarding down- or up-regulation. Only one collagenase was identified, MMP-9 (-fold change 1.44). MMP-9 cleaves collagen types IV, V, XI, and XIV (11–13). Other MMPs might also be up-regulated (14, 15), although they were not identified.
COL12A1 MS data were cross-validated with IHC, and both techniques showed significant up-regulation of COL12A1. During scoring of the tissues, no abnormalities were observed in healthy adjacent liver tissue. Nevertheless, the presence of molecular abnormalities cannot be ruled out with certainty. We tried to exclude direct tumor effects by taking control tissue that was at least at a distance of 1 cm away from the tumor. Many articles referring to premetastatic niches have been published (27–30). A premetastatic niche is formed by interaction of the potential metastasis site with proteins excreted from the primary tumor, creating a niche that is favorable for the growth of a metastasis. We were not able to visualize COL12A1 in three CRLM tissue sections with IHC, although increased COL12A1 levels were detected with MS. In CRC, COL12A1 was mainly present in stroma, analogous to CRLM.
However, in colon tissue, it was surprisingly observed inside the nuclei of epithelial cells, with repetitive staining. We could not validate the staining of the nuclei of the epithelial cells with another antibody (HPA009143). This indicates that staining of the nuclei is most likely false positive. This antibody (HPA009143), which stains COL12A1, also showed cross-reactivity. In this case, smooth muscle tissue stained false positively. Both antibodies showed exactly the same staining for collagen structures, and they showed different additional cross-reactivity (nuclei endothelial cell and smooth muscle tissue).
The shotgun proteomics data allowed us to search for specific proteins produced by CRLM, which originate from the primary colon tumor tissue. First, we looked into collagen types that were expressed higher in CRC with respect to colon tissue and were also more abundant in CRLM with respect to liver tissue. Four collagen types matched these criteria, COL10A1, COL12A1, COL14A1, and COL15A1, and the abundance was strongest for COL12A1. We hypothesize that these four collagen types visible in CRLM are a sign of origin of the primary tumor and highly specific for CRLM. We cannot exclude the possibility that fibrotic tissue is triggered by the metastatic cells to produce, for example, COL12A1; however, we observed in five fibrotic tissue sections that COL12A1 is not present in just fibrotic tissue itself. Collagen type X (31) and type XII (32) are described as being up-regulated in CRC; however, collagen type XIV and XV are not described. Collagen type X, XII, XIV, and XV are not described in literature in relation with CRLM.
Colon-specific proteins were selected from the Protein Atlas, and after applying the selection criteria, six proteins remained. These remaining proteins (CDH17, KRT20, CEACAM5, GPA33, MUC13, and PPP1R1B/DARPP-32) are colon-specific and were significantly present in the CRLM tissue. Previous reports state that KRT20 (33), MUC13 (7, 34), CEACAM5 (35), and GPA33 (36, 37) are differently expressed in CRLM tissue, whereas CDH17 and PPP1R1B/DARP-32 have not been described previously. It is likely that CDH17 is involved in cell organization and stimulates tumor proliferation (38), whereas PPP1R1B/DARPP-32 is highly expressed in CRC tissue and is a predictor for metastasis (39). Furthermore, six of the 10 top down-regulated proteins are related to liver-specific processes. The relative loss of proteins involved in liver processes in the tumor relates to a known decrease of hepatocytes in tumor tissue (40). The top 10 up-regulated proteins included collagen and two other ECM proteins, fibrillin-1 (FBN1) and fibronectin (FN1), suggesting that the ECM composition strongly deviates from normal.
We conclude that collagen is up-regulated in CRLM compared with control tissue and that specific collagen types (COL10A1, COL12A1, COL14A1, and COL15A1) from the primary tumor can be detected in the CRLM tissue as well. The collagen changes found in CRC and CRLM may reflect changes of the ECM related to tumor proliferation and seeding into the liver. These data may help to define new biomarkers to be used in CRLM detection after treatment of the primary tumor or its metastases.
Experimental procedures
Experimental design and statistical rationale
This study was approved by the Erasmus MC review board (MEC-2007-088), and we have worked according to the Declaration of Helsinki. We identified collagen types that are differently present in paired (n = 30) CRLM tissue compared with normal adjacent liver tissue (control). The presence of colon- or CRC-specific proteins in CRLM was studied by comparing CRLM, control, healthy adjacent colon (n = 5), and CRC tissue (n = 5). Fibrotic tissue (n = 5) was analyzed to determine whether COL12A1 up-regulation is a general liver process or caused by metastatic cells. CRLM, control liver, CRC, and colon tissue were analyzed by IHC (COL12A1 antibody: NBP1-88062) and MS. FIB tissue was analyzed by IHC (COL12A1 antibody: NBP1-88062). Colon tissue was additionally stained with a second COL12A1 antibody (HPA009143) to verify the unexpected staining of epithelial nuclei.
Sample sizes of the CRLM and control tissue were based on a power analysis (α = 0.05, β = 0.20). Mean and S.D. used for the power analysis were calculated on the overall data of log-transformed significant up-regulated collagen peptides in CRLM and control tissue of five patients (control mean = 5.00, CRLM mean = 5.94, pooled S.D. = 1.18). The power analysis depicted a sample size larger than 25 samples/group to determine the observed differences in the subset. No replicate measurements were performed; we assumed the biological variation to be much larger than the technical variation, as has also been described in literature for the technique used (41).
Quality of the LC-MS/MS runs was monitored by measuring samples first on a test system to identify incomplete digestions and determine the presence of other components influencing the chromatography. Furthermore, after every 10 samples, a quality control sample was measured containing a set of peptides spread over the whole gradient to monitor possible retention time shifts or loss of intensity in the mass spectrometer. The peptides showed a retention time variation that remained within 0.2 min.
Data were assessed by analysis of the normalization by a t test, and background was assessed by permutation testing (see “Data assessment”). Proteins included in collagen turnover pathways were analyzed. Statistics are described under “Data analysis” and “Statistical analysis.” Mass spectrometry data were orthogonally cross-validated by IHC on the most distinctive collagen type.
Sample selection criteria
All samples were provided by the Department of Pathology, Erasmus MC, and examined (by a gastrointestinal pathologist) for the presence of healthy and tumor tissue in the same section. Four CRLM sections were included that contained up to 50% control tissue (CRLM-8, -12, -19, and -21); the other sections were free of control tissue. Control liver sections were demonstrated to be free of tumor tissue by standard histological examination and were taken at a minimum distance of 1 cm away from the tumor. All CRC sections included contained nontumorous colon tissue (by standard histological examination). All samples were included in the data analysis. Tissue sections and patient information were handled according to the Federation of Dutch Medical Societies (47). Therefore, no approval of the Medical Research and Ethics Committee was required.
Chemicals
Ultra-HPLC grade nano-LC solvents were obtained from Biosolve (Valkenswaard, The Netherlands). Two COL12A1 antibodies (NBP1-88062 and HPA009143) were obtained from Bio-Connect BV (Huissen, The Netherlands). EnVision Detection Systems Peroxidase/DAB, rabbit/mouse was obtained from Dako (Heverlee, Belgium). Tris-EDTA for heat-induced antigen retrieval was obtained from Klinipath (Duiven, The Netherlands). Other chemicals were obtained from Sigma-Aldrich (Zwijndrecht, The Netherlands).
IHC staining
Formalin-fixed paraffin-embedded tissue sections were analyzed by MS and IHC. Consecutive tissue sections (6-μm thickness) were cut. For IHC, tissue sections were deparaffinized and rehydrated, followed by inhibition of endogenous peroxidases. Prior to primary antibody labeling, heat-induced antigen retrieval was used. Samples were labeled with a primary antibody against COL12A1, followed by secondary labeling, visualized by incubation with DAB, and counterstained with hematoxylin. Tissue sections were scored by a gastrointestinal pathologist (MD). Tissues was scored according to the following criteria: 0, no staining; 0.5, small focal staining; 1, focal staining; 1.5, few focal staining areas; 2, several focal staining areas; 2.5, staining more than 40% and less than 50%; 3, >50% staining. The full IHC protocol is available in supporting information S1.
Sample treatment for MS
Tissue sections for MS analysis were placed in an Eppendorf cup; one tissue section was analyzed per sample, irrespective of the size of the resection material. Injection volumes were normalized based on the UV absorbance measured on a test system. The tissue sections were deparaffinized and rehydrated, followed by removal of formalin cross-links. Formalin cross-links were removed by incubation with a solution of Tris and RapiGest (42), followed by reduction, alkylation, and overnight trypsin digestion. Trypsin cleaves exclusively C-terminal to lysine or arginine unless proline is located at the C-terminal side (43). The full protocol for sample treatment for MS analysis and nano-LC and MS settings are available in supporting information S1. Mass spectrometry data were made publicly accessible via the PRIDE archive, accession number PXD008383.
Data analysis
MGF peak list files were extracted from raw files by ProteoWizard (version 3.0.9166). MGF files were searched using the Mascot search engine (version 2.3.2, Matrix Science Inc., London, UK) and the UniProt/Swiss-Prot database (20,194 entries), as described by Singh et al. (44). In short, the database search contained a mass tolerance of 10 ppm for the peptide mass and 0.5 Da for the fragment mass. A maximum of 4 missed cleavages was allowed. Hydroxylation (+16 Da) of proline, lysine, and methionine were included as variable modifications, and carbamidomethylation (+57 Da) of cysteine as a fixed modification. Mascot search results were further analyzed by Scaffold (version 4.6.2, Proteome Software, Portland, OR). In Scaffold, protein confidence levels were set to a 1% false discovery rate (FDR), at least 1 peptide/protein, and a 1% FDR at the peptide level. FDRs were estimated by inclusion of a decoy database search generated by Mascot. Subsequently, the Scaffold data were imported into Progenesis QI (version 4, Nonlinear Dynamics, Newcastle-upon-Tyne, UK) to align the LC runs. Features not matching the selection criteria: charge between +2 and +5, and at least two isotopes were excluded from further analysis. Identifications from Scaffold were imported via Scaffold into Progenesis QI, followed by export of the normalized abundance to Excel 2010 (Microsoft, Redmond, WA). Duplicate feature intensities were summed. Data were further processed with Excel, GraphPad Prism (version 5.01, GraphPad Software, Inc., La Jolla, CA), and R (version 3.3.1, R Consortium, Vienna, Austria). Prior to log10 transformation, a relatively small value of “10” was added, this to include missing values for further data analysis. The log10-transformed data were used for statistics; thereby, the data were assumed to be normally distributed after log transformation. Protein significance was determined by ranked peptide values and summation of all peptides per protein, followed by an unequal variance t test. In all following comparisons, an unequal-variance t test was used unless stated otherwise. p values < 0.05 were considered significant unless stated otherwise.
Data assessment
CRLM and control MS data were assessed; this included the analysis of normalization for injection volumes, permutation testing, and intra- and intercollagen-α chain correlations. To exclude a bias a priori in the data, normalization was tested by summation of all individual peptide values per patient, followed by testing for significance between CRLM and control tissue.
To exclude the possibility that results were found by chance in large data sets, permutation testing (n = 1000 iterations) was performed using R. The R script has been added to supporting information S2. Briefly, the data were randomly divided into two groups at the peptide level; significant differences between the two groups were determined using the Wilcoxon signed-rank test. Significant p values were summed per permutation, and the log10 was taken. It was assumed that the log10 summed significant p values were normally distributed. If the true data set value was greater than the average value of the permutation test plus twice the S.D. (p < 0.05), then a significant difference was assumed.
Statistical analysis
An unsupervised cluster analysis was performed with R on ranked peptides. The R code is available in the supporting information S3.
The observed up-regulation of collagen can be due to a disturbance in its normal turnover. To test this hypothesis, proteins included in collagen turnover pathways were retrieved from the reactome pathway knowledgebase (17, 18). Three pathways present in the reactome pathway knowledgebase are related to collagen production and degradation: “collagen biosynthesis and modifying enzymes,” “assembly of collagen fibrils and other multimetric structures,” and “collagen degradation.” Although not included in the reactome pathway knowledgebase, Xaa-Pro dipeptidase (PEPD) is involved in collagen degradation. PEPD cleaves Xaa-Pro and Xaa-Hyp, but not Pro-Pro, and is essential for the final degradation of collagen. PEPD was added to the retrieved list of proteins from the reactome pathway knowledgebase.
The CRC protein signature in CRLM was determined at two levels: collagen-specific and the general proteome. At the collagen level, the total unique peptide count was used as a measure of abundance. Proteins were considered as “hitchhiked” from the colon to CRLM if they matched the following criteria: 1) they were marked in the Human Protein Atlas (www.proteinatlas.org)3 (45) as tissue-enriched, group-enriched, or tissue-enhanced in colon tissue; 2) they had an intensity-based absolute quantification (iBAQ) value at the protein level for colon tissue but not for liver tissue; and 3) the RNA expression level was 100-fold lower in the liver versus colon tissue, and five peptides or more were identified per protein. iBAQ and RNA expression levels were taken from https://www.proteomicsdb.org3 (46).
Author contributions
The study was designed by L. J. M. D., J. N. M. I., N. A. v. H., R. R. J. C. v. d. B., and T. M. L. Experiments were performed by N. A. v. H., and acquired data were analyzed by N. A. v. H. and M. D. All authors were involved in writing of the manuscript and approved the submitted manuscript.
Supplementary Material
Acknowledgments
We thank the Erasmus MC Cancer Computational Biology Center for access to their IT-infrastructure and software, which was used for the computations and data analysis in this study.
The authors declare that they have no conflicts of interest with the contents of this article.
This article contains supplemental information S1–S8.
The MS proteomics data have been deposited to the ProteomeXchange Consortium via the PRIDE archive with the data set identifier PXD008383.
Please note that the JBC is not responsible for the long-term archiving and maintenance of this site or any other third party hosted site.
- ECM
- extracellular matrix
- CRC
- colorectal cancer
- CRLM
- colorectal liver metastasis
- IQR
- interquartile range
- FIB
- liver fibrosis
- IHC
- immunohistochemistry
- PEPD
- Xaa-Pro dipeptidase
- Hyp
- hydroxyproline
- iBAQ
- intensity-based absolute quantification.
References
- 1. Gjaltema R. A., and Bank R. A. (2017) Molecular insights into prolyl and lysyl hydroxylation of fibrillar collagens in health and disease. Crit. Rev. Biochem. Mol. Biol. 52, 74–95 10.1080/10409238.2016.1269716 [DOI] [PubMed] [Google Scholar]
- 2. Bissell M. J., and Hines W. C. (2011) Why don't we get more cancer? A proposed role of the microenvironment in restraining cancer progression. Nat. Med. 17, 320–329 10.1038/nm.2328 [DOI] [PMC free article] [PubMed] [Google Scholar]
- 3. Gout S., and Huot J. (2008) Role of cancer microenvironment in metastasis: focus on colon cancer. Cancer Microenviron. 1, 69–83 10.1007/s12307-008-0007-2 [DOI] [PMC free article] [PubMed] [Google Scholar]
- 4. Quail D. F., and Joyce J. A. (2013) Microenvironmental regulation of tumor progression and metastasis. Nat. Med. 19, 1423–1437 10.1038/nm.3394 [DOI] [PMC free article] [PubMed] [Google Scholar]
- 5. Provenzano P. P., Inman D. R., Eliceiri K. W., Knittel J. G., Yan L., Rueden C. T., White J. G., and Keely P. J. (2008) Collagen density promotes mammary tumor initiation and progression. BMC Med. 6, 11 10.1186/1741-7015-6-11 [DOI] [PMC free article] [PubMed] [Google Scholar]
- 6. Nyström H., Naredi P., Berglund A., Palmqvist R., Tavelin B., and Sund M. (2012) Liver-metastatic potential of colorectal cancer is related to the stromal composition of the tumour. Anticancer Res. 32, 5183–5191 [PubMed] [Google Scholar]
- 7. Naba A., Clauser K. R., Whittaker C. A., Carr S. A., Tanabe K. K., and Hynes R. O. (2014) Extracellular matrix signatures of human primary metastatic colon cancers and their metastases to liver. BMC Cancer 14, 518 10.1186/1471-2407-14-518 [DOI] [PMC free article] [PubMed] [Google Scholar]
- 8. Bröker M. E. E., Lalmahomed Z. S., Roest H. P., van Huizen N. A., Dekker L. J. M., Calame W., Verhoef C., IJzermans J. N. M., and Luider T. M. (2013) Collagen peptides in urine: a new promising biomarker for the detection of colorectal liver metastases. PLoS One 8, e70918 10.1371/journal.pone.0070918 [DOI] [PMC free article] [PubMed] [Google Scholar]
- 9. Lalmahomed Z. S., Bröker M. E., van Huizen N. A., Coebergh van den Braak R. R., Dekker L. J., Rizopoulos D., Verhoef C., Steyerberg E. W., Luider T. M., and IJzermans J. N. M. (2016) Hydroxylated collagen peptide in urine as biomarker for detecting colorectal liver metastases. Am. J. Cancer Res. 6, 321–330 [PMC free article] [PubMed] [Google Scholar]
- 10. Nyström H., Tavelin B., Björklund M., Naredi P., and Sund M. (2015) Improved tumour marker sensitivity in detecting colorectal liver metastases by combined type IV collagen and CEA measurement. Tumour Biol. 36, 9839–9847 10.1007/s13277-015-3729-z [DOI] [PMC free article] [PubMed] [Google Scholar]
- 11. Sluijter J. P. G., de Kleijn D. P. V., Pasterkamp G. (2006) Vascular remodeling and protease inhibition–bench to bedside. Cardiovasc. Res. 69, 595–603 10.1016/j.cardiores.2005.11.026 [DOI] [PubMed] [Google Scholar]
- 12. Snoek-van Beurden P. A. M., and Von den Hoff J. W. (2005) Zymographic techniques for the analysis of matrix metalloproteinases and their inhibitors. BioTechniques 38, 73–83 10.2144/05381RV01 [DOI] [PubMed] [Google Scholar]
- 13. Sternlicht M. D., and Werb Z. (2001) How matrix metalloproteinases regulate cell behaviour. Annu. Rev. Cell Dev. Biol. 17, 463–516 10.1146/annurev.cellbio.17.1.463 [DOI] [PMC free article] [PubMed] [Google Scholar]
- 14. Kahlert C., Pecqueux M., Halama N., Dienemann H., Muley T., Pfannschmidt J., Lasitschka F., Klupp F., Schmidt T., Rahbari N., Reissfelder C., Kunz C., Benner A., Falk C., Weitz J., and Koch M. (2014) Tumour-site-dependent expression profile of angiogenic factors in tumour-associated stroma of primary colorectal cancer and metastases. Br. J. Cancer 110, 441–449 10.1038/bjc.2013.745 [DOI] [PMC free article] [PubMed] [Google Scholar]
- 15. Zeng Z. S., and Guillem J. G. (1998) Unique activation of matrix metalloproteinase-9 within human liver metastasis from colorectal cancer. Br. J. Cancer 78, 349–353 10.1038/bjc.1998.497 [DOI] [PMC free article] [PubMed] [Google Scholar]
- 16. Zucker S., and Vacirca J. (2004) Role of matrix metalloproteinases (MMPs) in colorectal cancer. Cancer Metastasis Rev. 23, 101–117 10.1023/A:1025867130437 [DOI] [PubMed] [Google Scholar]
- 17. Fabregat A., Sidiropoulos K., Garapati P., Gillespie M., Hausmann K., Haw R., Jassal B., Jupe S., Korninger F., McKay S., Matthews L., May B., Milacic M., Rothfels K., Shamovsky V., et al. (2016) The reactome pathway knowledgebase. Nucleic Acids Res. 44, D481–D487 10.1093/nar/gkv1351 [DOI] [PMC free article] [PubMed] [Google Scholar]
- 18. Croft D., Mundo A. F., Haw R., Milacic M., Weiser J., Wu G., Caudy M., Garapati P., Gillespie M., Kamdar M. R., Jassal B., Jupe S., Matthews L., May B., Palatnik S., et al. (2014) The reactome pathway knowledgebase. Nucleic Acids Res. 42, D472–D477 10.1093/nar/gkt1102 [DOI] [PMC free article] [PubMed] [Google Scholar]
- 19. Fukai N., Eklund L., Marneros A. G., Oh S. P., Keene D. R., Tamarkin L., Niemelä M., Ilves M., Li E., Pihlajaniemi T., and Olsen B. R. (2002) Lack of collagen XVIII/endostatin results in eye abnormalities. EMBO J. 21, 1535–1544 10.1093/emboj/21.7.1535 [DOI] [PMC free article] [PubMed] [Google Scholar]
- 20. Saarela J., Rehn M., Oikarinen A., Autio-Harmainen H., and Pihlajaniemi T. (1998) The short and long forms of type XVIII collagen show clear tissue specificities in their expression and location in basement membrane zones in humans. Am. J. Pathol. 153, 611–626 10.1016/S0002-9440(10)65603-9 [DOI] [PMC free article] [PubMed] [Google Scholar]
- 21. Musso O., Rehn M., Saarela J., Théret N., Liétard J., Hintikka Lotrian D., Campion J. P., Pihlajaniemi T., and Clément B. (1998) Collagen XVIII is localized in sinusoids and basement membrane zones and expressed by hepatocytes and activated stellate cells in fibrotic human liver. Hepatology 28, 98–107 10.1002/hep.510280115 [DOI] [PubMed] [Google Scholar]
- 22. Musso O., Theret N., Heljasvaara R., Rehn M., Turlin B., Campion J. P., Pihlajaniemi T., and Clement B. (2001) Tumor hepatocytes and basement membrane-producing cells specifically express two different forms of the endostatin precursor, collagen XVIII, in human liver cancers. Hepatology 33, 868–876 10.1053/jhep.2001.23189 [DOI] [PubMed] [Google Scholar]
- 23. Gilkes D. M., Chaturvedi P., Bajpai S., Wong C. C., Wei H., Pitcairn S., Hubbi M. E., Wirtz D., and Semenza G. L. (2013) Collagen prolyl hydroxylases are essential for breast cancer metastasis. Cancer Res. 73, 3285–3296 10.1158/0008-5472.CAN-12-3963 [DOI] [PMC free article] [PubMed] [Google Scholar]
- 24. Afik R., Zigmond E., Vugman M., Klepfish M., Shimshoni E., Pasmanik-Chor M., Shenoy A., Bassat E., Halpern Z., Geiger T., Sagi I., and Varol C. (2016) Tumor macrophages are pivotal constructors of tumor collagenous matrix. J. Exp. Med. 213, 2315–2331 10.1084/jem.20151193 [DOI] [PMC free article] [PubMed] [Google Scholar]
- 25. Du H., Pang M., Hou X., Yuan S., and Sun L. (2017) PLOD2 in cancer research. Biomed. Pharmacother. 90, 670–676 10.1016/j.biopha.2017.04.023 [DOI] [PubMed] [Google Scholar]
- 26. Mori K., Toiyama Y., Otake K., Fujikawa H., Saigusa S., Hiro J., Kobayashi M., Ohi M., Tanaka K., Inoue Y., Kobayashi Y., Kobayashi I., Mohri Y., Goel A., and Kusunoki M. (2017) Proteomics analysis of differential protein expression identifies heat shock protein 47 as a predictive marker for lymph node metastasis in patients with colorectal cancer. Int. J. Cancer 140, 1425–1435 10.1002/ijc.30557 [DOI] [PubMed] [Google Scholar]
- 27. Seubert B., Grünwald B., Kobuch J., Cui H., Schelter F., Schaten S., Siveke J. T., Lim N. H., Nagase H., Simonavicius N., Heikenwalder M., Reinheckel T., Sleeman J. P., Janssen K. P., Knolle P. A., and Krüger A. (2015) Tissue inhibitor of metalloproteinases (TIMP)-1 creates a premetastatic niche in the liver through SDF-1/CXCR4-dependent neutrophil recruitment in mice. Hepatology 61, 238–248 10.1002/hep.27378 [DOI] [PMC free article] [PubMed] [Google Scholar]
- 28. Peinado H., Zhang H., Matei I. R., Costa-Silva B., Hoshino A., Rodrigues G., Psaila B., Kaplan R. N., Bromberg J. F., Kang Y., Bissell M. J., Cox T. R., Giaccia A. J., Erler J. T., Hiratsuka S., et al. (2017) Pre-metastatic niches: organ-specific homes for metastases. Nat. Rev. Cancer 17, 302–317 10.1038/nrc.2017.6 [DOI] [PubMed] [Google Scholar]
- 29. Kaplan R. N., Rafii S., and Lyden D. (2006) Preparing the “soil”: the premetastatic niche. Cancer Res. 66, 11089–11093 10.1158/0008-5472.CAN-06-2407 [DOI] [PMC free article] [PubMed] [Google Scholar]
- 30. Peinado H., Alečković M., Lavotshkin S., Matei I., Costa-Silva B., Moreno-Bueno G., Hergueta-Redondo M., Williams C., García-Santos G., Ghajar C., Nitadori-Hoshino A., Hoffman C., Badal K., Garcia B. A., Callahan M. K., et al. (2012) Melanoma exosomes educate bone marrow progenitor cells toward a pro-metastatic phenotype through MET. Nat. Med. 18, 883–891 10.1038/nm.2753 [DOI] [PMC free article] [PubMed] [Google Scholar]
- 31. Solé X., Crous-Bou M., Cordero D., Olivares D., Guinó E., Sanz-Pamplona R., Rodriguez-Moranta F., Sanjuan X., de Oca J., Salazar R., and Moreno V. (2014) Discovery and validation of new potential biomarkers for early detection of colon cancer. PLoS One 9, e106748 10.1371/journal.pone.0106748 [DOI] [PMC free article] [PubMed] [Google Scholar]
- 32. Karagiannis G. S., Petraki C., Prassas I., Saraon P., Musrap N., Dimitromanolakis A., and Diamandis E. P. (2012) Proteomic signatures of the desmoplastic invasion front reveal collagen type XII as a marker of myofibroblastic differentiation during colorectal cancer metastasis. Oncotarget 3, 267–285 [DOI] [PMC free article] [PubMed] [Google Scholar]
- 33. Cerna M., Holubec L. Jr, Pesta M., Kormunda S., Topolcan O., and Cerny R. (2006) Quantitative estimation of CEA and CK20 expression in tumour tissue of colorectal cancer and its liver metastases with reverse transcription and real-time PCR. Anticancer Res. 26, 803–808 [PubMed] [Google Scholar]
- 34. Gupta B. K., Maher D. M., Ebeling M. C., Sundram V., Koch M. D., Lynch D. W., Bohlmeyer T., Watanabe A., Aburatani H., Puumala S. E., Jaggi M., and Chauhan S. C. (2012) Increased expression and aberrant localization of mucin 13 in metastatic colon cancer. J. Histochem. Cytochem. 60, 822–831 10.1369/0022155412460678 [DOI] [PMC free article] [PubMed] [Google Scholar]
- 35. Blumenthal R. D., Leon E., Hansen H. J., and Goldenberg D. M. (2007) Expression patterns of CEACAM5 and CEACAM6 in primary and metastatic cancers. BMC Cancer 7, 2 10.1186/1471-2407-7-2 [DOI] [PMC free article] [PubMed] [Google Scholar]
- 36. Scott A. M., Lee F. T., Jones R., Hopkins W., MacGregor D., Cebon J. S., Hannah A., Chong G., U P., Papenfuss A., Rigopoulos A., Sturrock S., Murphy R., Wirth V., Murone C., et al. (2005) A phase I trial of humanized monoclonal antibody A33 in patients with colorectal carcinoma: biodistribution, pharmacokinetics, and quantitative tumor uptake. Clin. Cancer Res. 11, 4810–4817 10.1158/1078-0432.CCR-04-2329 [DOI] [PubMed] [Google Scholar]
- 37. Belov L., Zhou J., and Christopherson R. I. (2010) Cell surface markers in colorectal cancer prognosis. Int. J. Mol. Sci. 12, 78–113 10.3390/ijms12010078 [DOI] [PMC free article] [PubMed] [Google Scholar]
- 38. Bartolomé R. A., Barderas R., Torres S., Fernandez-Aceñero M. J., Mendes M., García-Foncillas J., Lopez-Lucendo M., and Casal J. I. (2014) Cadherin-17 interacts with α2β1 integrin to regulate cell proliferation and adhesion in colorectal cancer cells causing liver metastasis. Oncogene 33, 1658–1669 10.1038/onc.2013.117 [DOI] [PubMed] [Google Scholar]
- 39. Kopljar M., Patrlj L., Korolija-Marinic D., Horzic M., Cupurdija K., and Bakota B. (2015) High expression of DARPP-32 in colorectal cancer is associated with liver metastases and predicts survival for Dukes A and B patients: results of a pilot study. Int. Surg. 100, 213–220 10.9738/INTSURG-D-14-00022.1 [DOI] [PMC free article] [PubMed] [Google Scholar]
- 40. Wu X. Z., Ma F., and Wang X. L. (2010) Serological diagnostic factors for liver metastasis in patients with colorectal cancer. World J. Gastroenterol. 16, 4084–4088 10.3748/wjg.v16.i32.4084 [DOI] [PMC free article] [PubMed] [Google Scholar]
- 41. Piehowski P. D., Petyuk V. A., Orton D. J., Xie F., Moore R. J., Ramirez-Restrepo M., Engel A., Lieberman A. P., Albin R. L., Camp D. G., Smith R. D., and Myers A. J. (2013) Sources of technical variability in quantitative LC-MS proteomics: human brain tissue sample analysis. J. Proteome Res. 12, 2128–2137 10.1021/pr301146m [DOI] [PMC free article] [PubMed] [Google Scholar]
- 42. Kawashima Y., Kodera Y., Singh A., Matsumoto M., and Matsumoto H. (2014) Efficient extraction of proteins from formalin-fixed paraffin-embedded tissues requires higher concentration of tris(hydroxymethyl)aminomethane. Clin. Proteomics 11, 4 10.1186/1559-0275-11-4 [DOI] [PMC free article] [PubMed] [Google Scholar]
- 43. Olsen J. V., Ong S. E., and Mann M. (2004) Trypsin cleaves exclusively C-terminal to arginine and lysine residues. Mol. Cell. Proteomics 3, 608–614 10.1074/mcp.T400003-MCP200 [DOI] [PubMed] [Google Scholar]
- 44. Singh V., van Pelt E. D., Stoop M. P., Stingl C., Ketelslegers I. A., Neuteboom R. F., Catsman-Berrevoets C. E., Luider T. M., and Hintzen R. Q. (2015) Gray matter-related proteins are associated with childhood-onset multiple sclerosis. Neurol. Neuroimmunol. Neuroinflamm. 2, e155 10.1212/NXI.0000000000000155 [DOI] [PMC free article] [PubMed] [Google Scholar]
- 45. Uhlén M., Fagerberg L., Hallström B. M., Lindskog C., Oksvold P., Mardinoglu A., Sivertsson Å., Kampf C., Sjöstedt E., Asplund A., Olsson I., Edlund K., Lundberg E., Navani S., Szigyarto C. A., et al. (2015) Proteomics: tissue-based map of the human proteome. Science 347, 1260419 10.1126/science.1260419 [DOI] [PubMed] [Google Scholar]
- 46. Schmidt T., Samaras P., Frejno M., Gessulat S., Barnert M., Kienegger H., Krcmar H., Schlegl J., Ehrlich H. C., Aiche S., Kuster B., and Wilhelm M. (2018) ProteomicsDB. Nucleic Acids Res. 46, D1271–D1281 10.1093/nar/gkx1029 [DOI] [PMC free article] [PubMed] [Google Scholar]
- 47. FEDERA (2011) Human Tissue and Medical Research: Code of Conduct for Responsible Use. Stichting FMWV, Rotterdam, The Netherlands [Google Scholar]
Associated Data
This section collects any data citations, data availability statements, or supplementary materials included in this article.