

Abstract
Background
Nanotechnology can offer the advantages of increasing solubility and bioavailability of delivering drugs like Furosemide. The aim of the current study is to investigate the in vitro and in vivo performance of furosemide nanosuspensions.
Methods
Furosemide nanosuspensions were prepared by antisolvent precipitation method using full factorial experimental design. Four factors were employed namely; Stirring time, Injection rate, antisolvent: solvent ratio & stabilizer: drug ratio (at two levels = high & low). The in vitro dissolution experiments were conducted to compare the representative formulation with raw drug powder. The bioavailability of nanosuspension was, also, evaluated in mice as an animal model.
Results
Solid state characterization (PXRD, DSC and FESEM) did show physical changes during preparation and optimization of the furosemide nanosuspensions. Individual material attributes showed more significant impact on the average particle size of the nanocrystals compared to process parameters. Two-way interactions between material attributes and process parameters significantly affected nanosuspension particle size distribution. Dissolution rate of furosemide nanosuspemsion was significantly higher than that observed for raw furosemide powder. The in vivo pharmacokinetics parameters of nanosuspension in comparison to pure drug showed significant increase in Cmax and AUC(0-t), about 233% and 266%, respectively. The oral bioavailability of furosemide from nanosuspension was about 2.3 fold higher as compared with the bioavailability from pure drug.
Conclusions
Furosemide nanosuspensions prepared using antisolvent precipitation method enhanced the dissolution rate and oral bioavailability compared to raw furosemide powder.
Keywords: Furosemide, Nanosuspension, Antisolvent precipitation, Stabilizer, In vitro in vivo assessment
1. Introduction
Oral delivery of drug formulations has been the most preferred route of drug administration for almost a century, however, significant challenges exist. Since 1995, more than 90% of the approved drugs have either poor solubility or permeability, or both issues (Serajuddin, 2007). Moreover, poor solubility of approximately 16% of all currently marketed drugs has been estimated to be the cause of low bioavailability (Bevernage et al., 2010). Previous studies have been carried out to improve the bioavailability of these drugs including preparation of salts, solid dispersions, co-crystal formulations and supramolecular complexes. However, these methods have some downsides, hence; have encouraged considering alternative technologies, including nanotechnologies, which resolves the problem of poor bioavailability of BCS (Biopharmaceutics Classification Systems) class II and IV drugs.
Lately, nanosuspension has turned out to be one of the budding dosage form for water insoluble drugs (Müller et al., 2001). Nanosuspensions can be defined as colloidal dispersions and biphasic systems comprising of drug particles suspended in an aqueous medium, where the dispersed particles are less than 1 µm in diameter. These dispersed particles are stabilized with the help of a stabilizer. Apart from simplicity and benefits of nanosuspensions, they are also easy to scale up, superior in drug loading and use no harmful substances (Westesen et al., 1997, Patravale and Kulkarni, 2004). In nanosuspensions, the nano size particles provide a large drug surface area enhancing the dissolution rate, improving the overall bioavailability and causing rapid onset of action for poorly soluble drugs.
Nanosuspension can be generated by either bottom up or top down method. Bottom up comprises of dissolving drug in an organic solvent containing stabilizer. This can be executed in different forms (i) supercritical fluid process (ii) emulsion solvent (iii) solvent-anti-solvent method and (iv) spray drying. On the other hand, top down technique involves breaking down of large drug particles to smaller particles by- (i) microfluidization (ii) media milling, and (iii) high pressure homogenization (Zhang et al., 2009).
Furosemide is a weakly acidic loop diuretic typically used for oral treatment of hypertension and edema. It has poor oral bioavailability of 37–51%, with variable rate and extent of absorption. It has been reported that absorption of furosemide is bi-exponential and fast, when administered in the stomach but slower in small intestine. Furosemide has pKa values of ∼3.8 and ∼10. In the stomach pH of around 2.0, furosemide is expected to be mainly unionized allowing the molecule to be more lipophilic (Sistovaris et al., 1991, Klausner et al., 2003). This explains why furosemide shows significant permeability across stomach membrane. However, because of poor solubility in the acidic pH of the stomach, it exhibits partial and erratic absorption. Despite of its increasing solubility with the increasing pH of the lower intestine, the drug continues to remain largely unabsorbed, as it is less permeable in the intestinal region.
Full factorial experimental design were used to identify the most critical process parameters, material attributes, their interactions and sources of variability influencing product quality (Yu et al., 2008, Verma et al., 2009, Salazar et al., 2011). DOE can be used to generate design space, which determines the multidimensional combination and interaction of input variables (e.g., material attributes and process parameters) that have been demonstrated to provide assurance of product quality (ICH Q8(R2) 2009) (Guideline, 2009).
In our previous study, stable furosemide nanosuspensions were prepared using QbD approach. A statistical experimental design was conducted to identify the critical process parameters (CPP) and critical material attributes (CMA). Both CPP and CMA govern the critical quality attributes (CQA), such as; particle size, size distribution, polydispersity index and physical stability of the resulting furosemide nanosuspension batches. The interactions between various parameters were also determined and statistically evaluated using a full factorial experimental design with the help of Minitab Version17 software.
The purpose of this study was to enhance the dissolution rate of furosemide in gastric media so that the permeability through the stomach membrane can be increased for furosemide nanosuspensions processed using optimized conditions. Therefore, we revisited the dissolution study for the optimized nanosuspension batch and more importantly the bioavailability study was performed for the furosemide nanosuspension using mice model. In addition, we investigated that by controlling the critical process parameters (CPP) and material attributes (CMA) to render stable nanosuspension batches with quality attributes; particularly average particle size, PDI, dissolution and bioavailability. Solid state characterizations of the nanosuspensions batches were also carried out.
2. Materials and methods
2.1. Materials
Furosemide (purity 99.6%), 4-chloro-2-(furan-2-ylmethylamino)-5-sulfamoylbenzoic acid (Fig. 1) was obtained from Incepta Pharmaceuticals Ltd., Dhaka, Bangladesh. All reagents used acetone, ethanol, PVPK30 (Povidone), and PEG6000 were of analytical grade and supplied by Sigma Aldrich, India. Pluronic F68 (poloxamer 188) was obtained from Eskayef Bangladesh Ltd., Dhaka, Bangladesh. HPLC grade Methanol was purchased from BDH laboratory (BDH Chemicals Ltd., Poole, UK). Plasma samples containing citrate buffer as anticoagulant was collected in-house. The high purity Milli-Q water was obtained through a Milli-Q Integral Water Purification System (Millipore, Bedford, MA). All other reagents were of analytical grade and used without further purification.
Fig. 1.
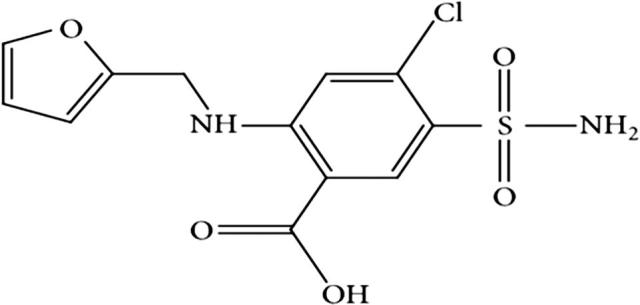
Structure of Furosemide, IUPAC name; 4-chloro-2-(furan-2-ylmethylamino)-5-sulfamoylbenzoic acid.
2.2. Methods
2.2.1. Preparation of nanosuspension
Nanosuspension of Furosemide was prepared using antisolvent-solvent precipitation technique. First, furosemide was dissolved in acetone (solvent) and this drug solution was then injected into water (antisolvent) containing poloxamer as a stabilizer. The drug solution in the antisolvent was mixed at a predetermined ratio using magnetic stirrer for predetermined time.
2.2.2. Experimental design
Previous research studies (Sahu and Das 2014), and prior knowledge of nano drug delivery systems have enabled the understanding of an experimental design, intended for the evaluation of the process parameters (PP) effect, material attributes (MA), critical process parameter (CPP), and critical material attributed (CMA) on product characteristics and formulation performance. Each factor was studied at two levels (Low = L and High = H), where preliminary experiments were used to identify the critical parameter range.
A full factorial experimental design was employed, which was focused on understanding the impact of critical process parameters; injection rate (0.2 ml/sec & 0.6 ml/sec) and stirring time (15 min/30 min). In addition, the critical material attributes of key formulation ingredients were also evaluated at two levels including solvent:anti-solvent ratio (1:10/1:20) and stabilizer:drug ratio (1:5/1:10) (Table 1). The critical quality attributes (CQA), for furosemide nanosuspensions were average particle size, polydispersity index (PDI), stability, assay, drug dissolution and in vivo studies, which were believed to be important for product safety and efficacy.
Table 1.
Furosemide nanosuspensions prepared using design of experiments (critical process parameters and critical material attributes, where H indicates high value and L indicates low value of individual process parameters and material attribute).
| Batch no. | Stirring time (min) | Injection rate (ml/sec) | Solvent antisolvent | Stabilizer drug |
|---|---|---|---|---|
| CC1 | H | H | L | L |
| CC2 | H | L | L | H |
| CC3 | H | H | H | L |
| CC4 | H | L | H | L |
| CC5 | H | L | L | L |
| CC6 | L | L | H | H |
| CC7 | L | L | H | L |
| CC8 | H | L | H | H |
| CC9 | L | H | L | L |
| CC10 | L | H | L | H |
| CC11 | L | L | L | H |
| CC12 | L | H | H | L |
| CC13 | H | H | H | H |
| CC14 | H | H | L | H |
| CC15 | L | H | H | H |
| CC16 | L | L | L | L |
Data obtained from experimental batches (Table 1) were evaluated using Minitab Version17 software to determine the variables which have marked impact on the critical quality attributes (CQAs) of the nanosuspension batches.
2.2.3. Statistical analysis
Data were analyzed using multiple linear regression and ANOVA to establish mathematical models. The mathematical model describing the relationships between independent and dependent variables in this study is shown by the following equation:
Where Y represents the dependent variable such as particle size and X1, X2, X3….… are the independent variables which control the output. B0 is the intercept; B1, B2, B3, B12, B23.... are experiment coefficients that describe the input variables (X1) or their interrelations with the response (Y).
2.2.4. Transmission electron microscopy (TEM)
The morphology of the nanosize particles from the optimized nanosuspension (CC5) was investigated using a FEI Tecnai G2 TEM (FEI, Holland). The optimized (CC5) system systems containing no furosemide were viewed using the TEM as there was a risk of crystallization of furosemide with subsequent damage to the TEM. The nanosuspension was freshly prepared, diluted with distilled water and one drop was placed on the carbon-coated copper grid which was left to dry. A drop of osmium was used to stain lipid components. Once dry, it was loaded into the TEM and viewed at 5000–20,000 magnifications (Jores et al., 2004).
2.2.5. Particle size, PDI and zeta potential measurement
Particle size distribution, polydispersity index (PDI) and zeta potential value of nanosuspensions batches were determined using disposable polystyrene cuvettes and plain folded capillary zeta cells by a Malvern Zetasizer Nano ZS90 (Malvern Instruments) were used to measured zeta potential at 25 °C (He et al., 2010).
2.2.6. Differential Scanning Calorimetry (DSC)
Differential Scanning Calorimetry (DSC), Q200 (TA Instruments, USA) was used to characterize the thermal behavior of the starting materials and freeze dried nanosuspension. The DSC was calibrated with indium (100% pure, melting point 156.60 °C, heat of fusion 6.80 cal/g). The samples were heated from 25 to 300 °C at a rate of 10 °C/min under dry nitrogen with a flow rate of 25 ml/min. Standard aluminum sample pans and lids were used with approximate sample sizes of 5 mg (Altamimi and Neau, 2016, Altamimi and Neau, 2017).
2.2.7. Powder X-ray diffraction (PXRD)
Rigaku multiflex diffractometer (Rigaku Americas) was used to obtain the X-ray powder diffraction (XRPD) patterns for furosemide samples. Ni filtered CuK-alpha radiation (wavelength 1.5418 A) was the source of X-ray. The X-ray tube was run at a power of 40 kV, 40 mA. The sample size was approximately 60 mg. The 2θ range scanned was 3–60° at a rate of 0.50°/min (Modi and Tayade 2006).
2.2.8. In vitro dissolution studies
The dissolution study of furosemide nanosuspension formulation was performed using the USP Apparatus II (paddle method) with a paddle speed of 75 rpm, 37 °C ± 0.5 °C temperature and 0.1 N hydrochloric acid (pH = 1.2) as a dissolution medium. The dissolution rate of furosemide nanosuspension was compared to raw powder. Pipette was used to collect samples (5 ml) at 0, 5, 10, 15, 30, and 60 min after addition of the formulations to the dissolution vessels. Filtered samples with 0.22 µm Millipore filter (Whatman, UK) were analyzed by UV (277 nm). 5 ml of fresh dissolution medium was replenished after each sample withdrawal.
2.2.9. UHPLC analysis of furosemide nanosuspension (in vitro samples)
The study employed with a highly sensitive UHPLC system (Ultimate 3000® binary solvent manager) equipped with automatic sampler and a Photodiode Array (PDA) eλ detector obtained from Thermo scientific, Bedford, MA, USA. The separation was achieved by reverse-phase isocratic elution using a mobile phase consisting of acetonitrile and water (0.25% Formic acid added) (40/60 %v/v) with a flow rate of 0.3 ml/min through an Acquity® UHPLC column HSS C18 (2.1 × 50 mm, 1.7 μm). Freshly prepared mobile phase was filtered outside using a 0.22 µm filter paper and degassed in the UHPLC system continuously by an online degasser. Column temperature was maintained at 40 °C and the injection volume was 2.0 µl.
2.2.10. In vivo pharmacokinetic studies
Male Wistar Swiss albino mice weighting 35–40 g were obtained from Experimental Animal Lab., Department of Pharmaceutical Sciences, North South University. The animals were maintained under controlled conditions of temperature (22 ± 1 °C), humidity (50–55%), light (12 h light/12 h dark cycle) with free access to mice chow and drinking water. Animals were acclimatized to the laboratory conditions for 7 days prior to experiments. All experimental procedures including handling, treatment and euthanasia were conducted in accordance with the National Institute of Health Guide for the Care and Use of Laboratory Animals (NIH Publications No. 80–23; 1996) as well as the Ethical committee of Experimental Animal Lab., North South University. Mice were randomly divided into two groups; one group was treated using furosemide microsuspension (prepared in-house using raw furosemide powder and saline water) other group was given furosemide nanosuspension, where n = 5.
2.2.11. Bioavailability of furosemide
The bioavailability study was performed in male Swiss albino mice. The bioavailability of nanosuspension formulation of furosemide was compared with microsuspension prepared in house using raw furosemide powder. The mice were fasted overnight before dosing but allowed free access to water during the whole experiment and were randomly allocated into two groups: furosemide nanosuspension (group A), and furosemide microsuspension (group B) in a crossover design. Both, nanosuspension formulation of furosemide and furosemide powder (suspended in saline) were administered at a dose equivalent to 1.4 mg/kg of mice by gavage. Blood samples were collected (200 µl) from cannula vein containing citrate buffer at five different time intervals (10, 20, 30, 40, 60, 80 min) in heparinized tubes. Plasma was separated from the blood samples by centrifugation at 2500g for 10 min and stored at −20 °C until analysis.
2.2.12. UHPLC analysis of plasma samples (in vivo samples)
The pharmacokinetic assessment of furosemide was done based on the concentration available in the mice plasma. Liquid-Liquid Extraction (LLE) procedure was used for the extraction of furosemide from the plasma. The plasma samples were transferred into a series of 1.5 ml centrifugation tubes. A fixed amount of the internal standard solution (diclofenac sodium, 40 µg/ml) was added to the plasma sample and vortexed for 2–3 min. Plasma precipitation was carried out using methanol (1 ml) and vortexed for 5 min. The tubes were centrifuged for 10 min at 15000 ×g. The whole supernatant (organic layer) was transferred into clean centrifuge tubes and was evaporated to dryness under nitrogen gas at 45–50 °C. Dry residues were then reconstituted in 200 μl methanol, and vortexed. The concentration of furosemide in the reconstituted residue was determined by a modified UHPLC method (Thermo scientific, Bedford, MA, USA). The mobile phase was an isocratic mixer of acetonitrile and 0.25 M fumaric acid in a ratio of 45:55 (%v/v). The flow rate of the mobile phase was 0.35 ml/min. An Acquity® UPLC BEH C18 column (2.1 × 50 mm, 1.7 µm) kept at 40 °C was used for the analysis. The total run time was 4 min. The detector wavelength was set at 230 nm and the injection volume was 5.0 µl. The developed method was validated as per International Conference on Harmonization (ICH) guidelines (Guideline 2005). The linearity of the method was found to be suitable in the range of 0.05–10 µg/ml (r2 = 0.9981).
2.2.13. Pharmacokinetic data analysis
A non-compartmental pharmacokinetic analysis was used to determine the pharmacokinetic behavior of furosemide. The pharmacokinetic parameters were calculated using PK solver program (Microsoft Excel). Area under plasma concentration-time curve (AUC) was calculated using linear trapezoidal method. The relative bioavailability (BA) of the furosemide nanosuspension to the control furosemide microsuspension using the same dose level (1.4 mg/kg) was calculated as follows: Relative BA % = AUC nanosuspension/AUC microsuspension. The apparent elimination half-life (T1/2) was calculated as 0.693/Kel. The maximum plasma concentration (Cmax) and time to maximum concentration (Tmax) after oral administration were determined directly from the time-concentration curve.
2.2.14. Statistical analysis of pharmacokinetic Data
Differences in pharmacokinetic parameters (e.g., AUC0-∞) of furosemide nanosuspension and control furosemide microsuspension prepared using raw furosemide powder were assessed by paired t-test using Graph Pad Prism version 3.00 for Windows (San Diego, CA, USA). Statistical significance was assumed when p ≤ 0.05.
3. Results and discussion
3.1. Solid state characterization of furosemide nanosuspension
3.1.1. Transmission electron microscopy (TEM)
The nanoparticles shown in Fig. 2 depicts the image of furosemide nanosuspension obtained by transmission electron microscopy did not produce any aggregation. The suspended nanoparticles were approximately round in shape and well dispersed. The crystalline substances of the nanosuspensions were physically more stable compared to amorphous forms.
Fig. 2.
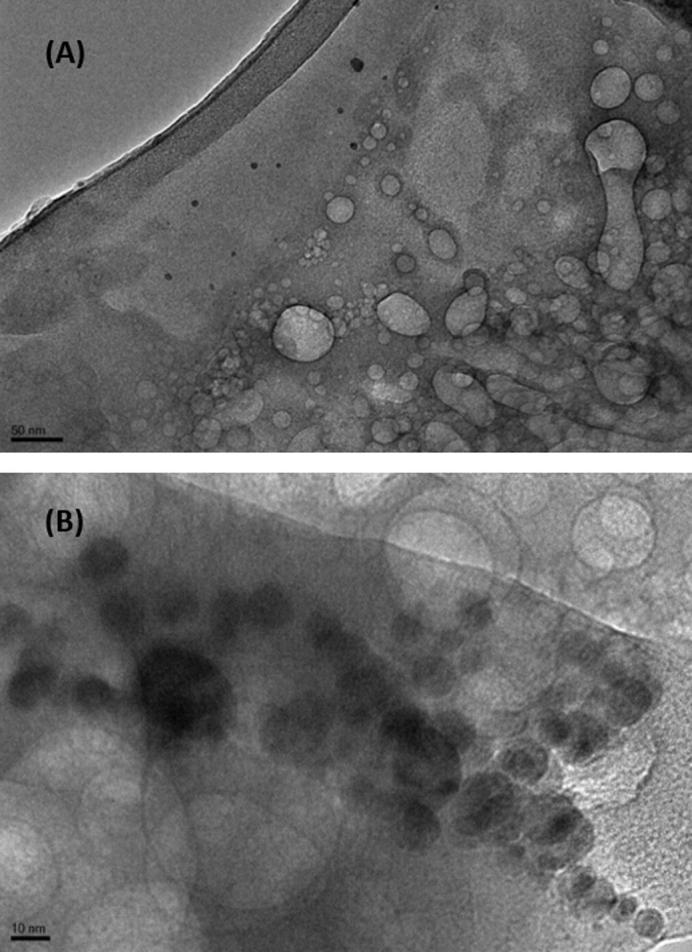
TEM images of nanoparticles in controlled furosemide nanosuspension at (A) 50, and (B) 10 nm range.
3.1.2. Differential Scanning Calorimetry (DSC)
DSC determines the thermotropic phase transition behavior in a quantitative mean. The generated DSC thermograms of pure furosemide, pure poloxamer, and the representative nanosuspension formulation (Batch CC5) are shown in Fig. 3. Sharp endothermic peaks of pure furosemide and pure poloxamer were observed at ∼216 °C and 55.95 °C, respectively. However, there was no sharp endothermic peak obtained for the representative nanosuspension formulation. Hence, no drug endothermic peak in the thermogram suggests that furosemide probably converted largely from crystalline to amorphous state during the preparation of nanosuspension using anti-solvent precipitation method or may be during freeze drying of furosemide nanosuspension. It is important to point out that furosemide have more than one polymorph and each polymorph has its own melting and transitioning behaviors especially during cooling cycles (Matsuda and Tatsumi 1990). Furosemide also, has a unique characteristic of decomposing directly after the melting endotherm, showing a clear exothermic event at peak temperature of 219.80 °C. It is documented that furosemide gives salumine (4-chloro-5-sulfamoyl-anthranilic acid) as a major by product after photochemical or thermal degradation. Salumine has a melting/degradation point around 270 °C, which is clear as an endothermic event in pure furosemide thermograms (Beyers et al., 2000, Goud et al., 2012)
Fig. 3.
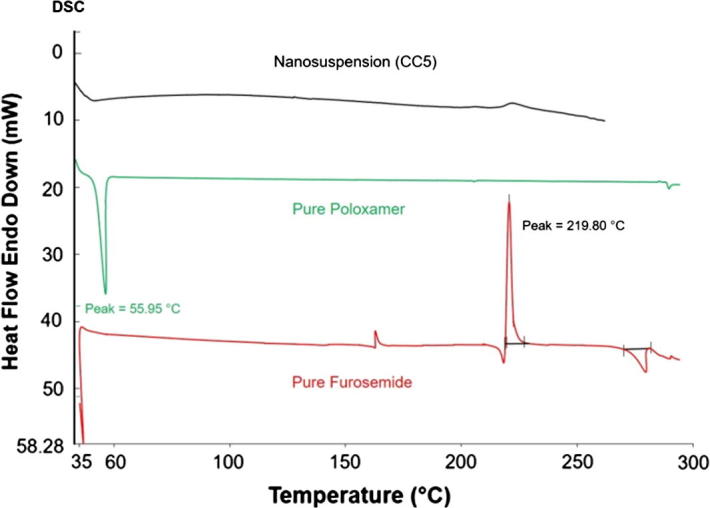
DSC thermograms of pure furosemide powder, pure poloxamer powder, and the representative freeze dried nanosuspension formulation (Batch CC5).
3.1.3. Powder X-ray diffraction (PXRD)
The spectra of X-ray diffractometry for pure furosemide, poloxamer, and the nanosuspension are presented in Fig. 4. The diffractogram of furosemide presents sharp peaks, which indicate a crystalline form, at diffraction angles (2θ) equal to 6.20°, 19.10°, 21.50°, 23.10°, 25.00°, and 28.80° (Patel, Patel et al. 2008). The spectra for poloxamer showed the typical two distinctive peaks, which represent the crystalline domain, at diffraction angles (2θ) equal to 19.30° and 23.50° (Chaulang et al., 2009, Eloy and Marchetti, 2014). No sharp peaks were observed for the nanosuspension formulation, which indicate conversion to the amorphous state. No physical or polymorphic transitions were observed during PXRD analysis of raw furosemide powder and the furosemide nanosuspensions (Fig. 4).
Fig. 4.

The PXRD spectra for pure furosemide, pure poloxamer 188 and freeze dried nanosuspension (batch CC5).
3.1.4. Particle size analysis
The average particle size and PDI values obtained using Malvern Zetasizer is shown in Table 2. Data showed that furosemide particles obtained were in the range of 120–360 nm. These results indicate that it is possible to prepare nanoparticles with low average particle size and PDI by controlling the critical process parameters and material attributes.
Table 2.
Mean Particle size and PDI value for furosemide nanoparticles prepared using critical process parameters and critical material attributes.
| Batch no. | Stirring time (min) | Injection rate *(30 = 0.6 ml/min) (10 = 0.2 ml/min) | Solvent:Antisolvent | Stabilizer:Drug | Mean particle size (nm)±SD | PDI ± SD |
|---|---|---|---|---|---|---|
| CC1 | 30 | 30 | 1:10 | 1:5 | 183.9 ± 64.0 | 0.45 ± 0.04 |
| CC2 | 30 | 10 | 1:10 | 1:10 | 236.4 ± 7.0 | 0.08 ± 0.08 |
| CC3 | 30 | 30 | 1:20 | 1:5 | 333.0 ± 13.0 | 0.02 ± 0.01 |
| CC4 | 30 | 10 | 1:20 | 1:5 | 273.3 ± 36.0 | 0.10 ± 0.06 |
| CC5 | 30 | 10 | 1:10 | 1:5 | 129.0 ± 3.0 | 0.09 ± 0.01 |
| CC6 | 15 | 10 | 1:20 | 1:10 | 308.7 ± 4.0 | 0.02 ± 0.01 |
| CC7 | 15 | 10 | 1:20 | 1:5 | 296.6 ± 7.0 | 0.03 ± 0.01 |
| CC8 | 30 | 10 | 1:20 | 1:10 | 210.0 ± 3.0 | 0.10 ± 0.10 |
| CC9 | 15 | 30 | 1:10 | 1:5 | 119.1 ± 6.0 | 0.30 ± 0.06 |
| CC10 | 15 | 30 | 1:10 | 1:10 | 322.1 ± 9.0 | 0.06 ± 0.02 |
| CC11 | 15 | 10 | 1:10 | 1:10 | 322.6 ± 5.0 | 0.07 ± 0.07 |
| CC12 | 15 | 30 | 1:20 | 1:5 | 339.6 ± 11.0 | 0.02 ± 0.01 |
| CC13 | 30 | 30 | 1:20 | 1:10 | 306.0 ± 0.6 | 0.06 ± 0.05 |
| CC14 | 30 | 30 | 1:10 | 1:10 | 350.1 ± 14.0 | 0.06 ± 0.06 |
| CC15 | 15 | 30 | 1:20 | 1:10 | 360.4 ± 8.0 | 0.10 ± 0.03 |
| CC16 | 15 | 10 | 1:10 | 1:5 | 132.8 ± 0.7 | 0.10 ± 0.03 |
3.1.5. Impact of critical process parameters and critical material attributes on the average particle size of furosemide nanoparticles
The Pareto plot for the mean particle size with p-values for the different factors and interaction in rank order show that the individual process parameters and material attributes tested demonstrate significant (p < 0.05) effects on the average particle size of furosemide nanosuspensions (Fig. 5A).
Fig. 5.

Critical Process Parameters (CPP) and Critical Material Attributes (CMA) on the average particle size of furosemide nanoparticles. The figures represent (A) Pareto plots and (B) Main effects.
Results suggest that the influence of individual material attributes were more significant, in comparison to individual parameters (Fig. 5A & B). Low solvent: antisolvent ratio generates smallest particle size (119 ± 6) compared to high solvent: antisolvent ratio (339 ± 11). This phenomenon could be attributed to a better mixing between solvent and antisolvent leading to decreased diffusion distance of the stabilizers thus providing the drug particles with improved steric stabilization.
Low average particle sizes were also achieved when samples were processed with low stabilizer concentration (119 ± 6) nm. Such an increase in the stabilizer amount probably enhances the efficiency of preventing coagulation and agglomeration. Nanosize particles have enormous surface area making the system thermodynamically unstable due to the increases in Gibb’s free energy. Therefore, nanoparticles tend to minimize their total energy by undergoing agglomeration. The stabilizer has formed a protective barrier between drug particles to prevent agglomeration by steric stabilization.
Injection rate showed marked impact compared to the other processing parameter stirring time. High injection rate of the drug solution into aqueous stabilizer solution produces smallest particle size (119 ± 6 nm). This may be due to intense mixing between solvent and antisolvent leading to increase nucleation rate with less time for crystal growth. At low injection rate, mixing between solvent-antisolvent becomes less, elongating crystal growth processes to give larger crystals (Kakran et al., 2012a, Kakran et al., 2012b).
Two way interactions between process parameters and material attributes were also shown to have marked impact on the critical quality attributes of furosemide nanosuspension (Fig. 6). The interaction between the ratios antisolvent: solvent with stabilizer: drug was found to be the most critical of all other factors and interactions (p < 0.001). It shows that when antisolvent: solvent ratio is low; particle size tends to be smallest with low stabilizer: drug ratio. However, when solvent: antisolvent ratio increases, the opposite effect is observed (Table 2). This phenomenon may be due the characteristics of the binding nature of the stabilizer poloxomer188 to the drug surface. For the higher number of nuclei, Poloxamer 188 may not be able to provide enough steric stabilization/assembly because at high volume of antisolvent (water) the adsorbed polymer molecules leave the furosemide nanocrystals surface and move towards the bulk of the liquid, hence, fail to inhibit the particle size growth (Deng et al., 2010).
Fig. 6.

Interaction plot for mean particle size of Critical Process Parameters (CPP) and Critical Material Attributes (CMA).
3.1.6. Impact of critical process parameters and critical material attributes on polydispersity index (PDI) of furosemide nanoparticles
Particle size distribution data for all nanosuspension batches prepared using DoE approach were found in the range of 0.02 to 0.45 (Table 2). PDI was observed to be dependent on the individual parameters (such as antisolvent: solvent volume ratio, stabilizer: drug ratio, injection rate) and also interactions between parameters with p value less than 0.05 (Fig. 7A). This result also suggests that monodisperse nanoparticles can be developed by controlling the critical parameters.
Fig. 7.

Critical Process Parameters (CPP) and Critical Material Attributes (CMA) on polydispersity index (PDI) of furosemide nanoparticles. The figures represent (A) Pareto plots and (B) Main effects.
Antisolvent: Solvent ratio was found to have the most significant impact (p < 0.001) on PDI value compared to other individual parameters used in this study (Fig. 7A &B). High antisolvent: solvent ratio showed low PDI for the nanosuspension batches compared to low antisolvent: solvent ratio.
In addition, a major two-way interaction (p < 0.01) was observed between the ratio of stabilizer: drug and antisolvent: solvent (Fig. 8). It is shown that when antisolvent ratio is high; PDI value decreases at low stabilizer: drug ratio. However, when antisolvent ratio decreases, the opposite effect was observed.
Fig. 8.

Interaction plot for PDI of Critical Process Parameters (CPP) and Critical Material Attributes (CMA).
The zeta potential value for the optimized batches of furosemide nanosuspensions were found to be approximately in the range of 20–24 mV. Previous studies indicate that an arbitrary value of ±20 mV is sufficient to provide stability when steric stabilization is provided by a surfactant (e.g. poloxamer) (Fig. 9)
Fig. 9.

Zeta potential distribution curve of furosemide nanosuspension.
3.1.7. In vitro dissolution of furosemide
Furosemide is a weakly acidic drug (pKa = 3.8) with poor bioavailability due to its low solubility in the stomach. Furosemide displays site specific absorption especially in the stomach and upper intestine. Hence improving the solubility in the gastric fluid to increase the systemic absorption of furosemide from stomach region where it has good permeability becomes crucial to enhance the overall bioavailability. We have examined the dissolution properties of furosemide nanosuspension in the gastric environment (pH = 1.2). The dissolution rate of furosemide nanosuspension was significantly faster (≥ 80% dissolved only after 5 min) compared to raw furosemide powder which did not show any noticeable dissolution after an hour (Fig. 10). The complete dissolution of furosemide nanosuspension was achieved at around 30 min. Such dissolution enhancement shows the potential of nanosuspension as successful formulation strategy to get absorbed through the stomach region to enhance the bioavailability of this kind of BCS IV class drugs.
Fig. 10.
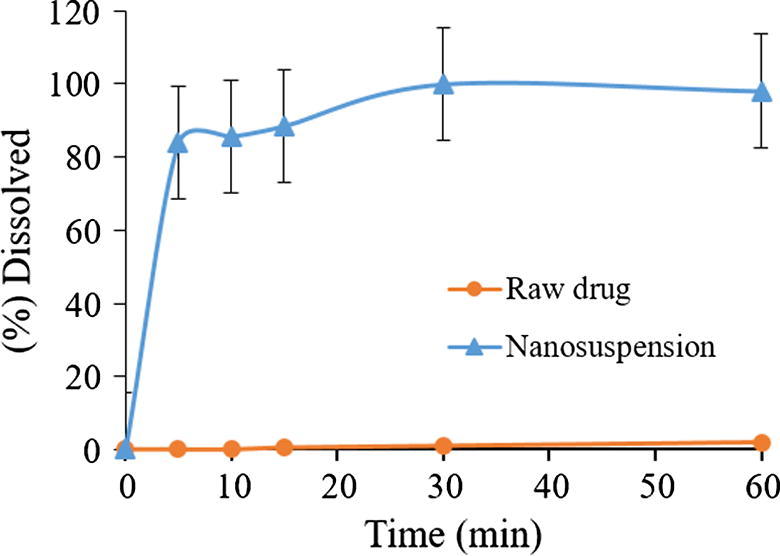
Dissolution profile of representative furosemide nanosuspension and pure raw furosemide powder.
3.1.8. In vivo bioavailability study
The in vivo pharmacokinetic behavior of a representative furosemide nanosuspension was studied to quantify furosemide in the plasma after oral administration. The pharmacokinetic of furosemide nanosuspension containing furosemide on comparison with pure drug microsuspension demonstrated the enhancement bioavailability of the drug (Table 3 and Fig. 11). The Cmax of furosemide after oral administration of furosemide microsuspension powder was 36.36 ± 3.32 ng ml−1 and the Tmax was 40 min, while orally administrated furosemide nanosuspension showed Cmax and Tmax of 85.03 ± 5.18 ng ml−1 and 40 min, respectively. The Cmax value of furosemide from the nanosuspension formulation was significantly increased (233.85%, p < 0.0001). The AUC 0–∞ of furosemide was also significantly increased in the nanosupension treated group compared to furosemide (microsuspension) treated group (266.55%, p < 0.0001) from 1611.83 ± 27.13 to 4296.32 ± 32.68, respectively. The increase in relative bioavailability was found to be 2.3 fold. The bioavailability study in mice shows that the bioavailability of furosemide improved for nanosuspensions formulation. The enhanced oral bioavailability of furosemide from nanosuspension may be due to the increased solubility and dispersion rate of the drug from the nanosuspension formulation.
Table 3.
Comparison of pharmacokinetic parameters of furosemide after oral administration of furosemide nanosuspension and control pure furosemide powder as microsuspension.
| Pharmacokinetic Parameters | Control (pure furosemide microsuspension, Mean ± SEM, n = 5) | Formulation (furosemide nanosuspension, Mean ± SEM, n = 5) |
|---|---|---|
| Cmax (ng/mL) | 36.36 ± 3.32 | 85.03 ± 5.18*** |
| Tmax (min) | 40 ± 0 | 40 ± 0 |
| AUC0-t (ng/mL*min) | 1610.00 ± 27.13 | 4293.14 ± 32.68*** |
| AUC0-∞ (ng/mL*min) | 1611.83 ± 29.19 | 4296.32 ± 52.32*** |
| T1/2 (min) | 8.24 | 7.96 |
| MRT (min) | 40.72 | 39.46 |
*Data are expressed as mean ± SEM (n = 5), *p < 0.05, **p < 0.001 and ***p < 0.0001.
Tmax = Time of peak concentration, Cmax = Peak of maximum concentration, AUC0→t = Area under the concentration time profile curve, AUC0→∞ = Area under the concentration time profile curve extrapolated to infinity, T1/2 = Half-life, MRT = Mean residence time.
Fig. 11.
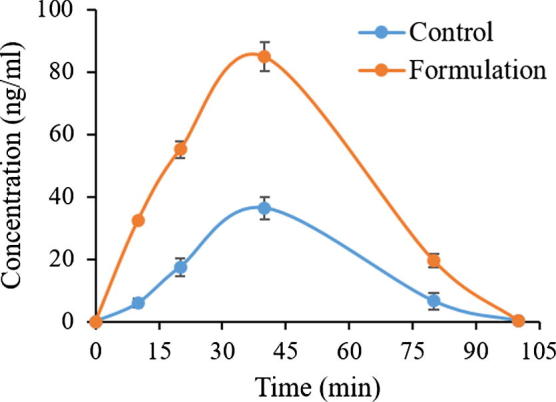
Plasma concentration– time profiles of furosemide after a single oral administration of furosemide nanosuspension formulation and furosemide control to mice at a dose equivalent to 1.4 mg/kg furosemide (Mean ± SEM, n = 5).
4. Conclusions
This study demonstrated that the antisolvent precipitation method produced stable furosemide nanocrystals with desirable quality attributes and thus enhanced dissolution rate and bioavailability as compared to the raw furosemide. This study further displayed the potential and usefulness of the quality by design approach, in understanding the related parameters for preparation and processing of nanosuspension by antisolvent precipitation technique. Controlling both critical process parameters and material attributes, enabled the development of nanosuspensions with low particle size and PDI, which exhibited better in vitro and in vivo performance compared to raw furosemide powder. The increase in relative bioavailability was found to be 2.3 fold due to enhanced solubility and dispersion rate of the drug from the nanosuspension formulation.
Acknowledgments
Acknowledgement
The authors are very grateful to the Deanship of Scientific Research and Research Centre, College of Pharmacy, King Saud University, Riyadh, Saudi Arabia for their funding and support.
Conflict of interest
The authors have confirmed that there is no conflict of interest.
Footnotes
Peer review under responsibility of King Saud University.
References
- Altamimi M.A., Neau S.H. Use of the Flory-Huggins theory to predict the solubility of nifedipine and sulfamethoxazole in the triblock, graft copolymer Soluplus. Drug Dev. Ind. Pharm. 2016;42(3):446–455. doi: 10.3109/03639045.2015.1075033. [DOI] [PubMed] [Google Scholar]
- Altamimi M.A., Neau S.H. Investigation of the in vitro performance difference of drug-Soluplus® and drug-PEG 6000 dispersions when prepared using spray drying or lyophilization. Saudi Pharmaceutical. J. 2017;25(3):419–439. doi: 10.1016/j.jsps.2016.09.013. [DOI] [PMC free article] [PubMed] [Google Scholar]
- Bevernage J., Brouwers J., Clarysse S., Vertzoni M., Tack J., Annaert P., Augustijns P. Drug supersaturation in simulated and human intestinal fluids representing different nutritional states. J. Pharmaceut. Sci. 2010;99(11):4525–4534. doi: 10.1002/jps.22154. [DOI] [PubMed] [Google Scholar]
- Beyers H., Malan S., Van der Watt J., De Villiers M. Structure-solubility relationship and thermal decomposition of furosemide. Drug Devel. Indus. Pharm. 2000;26(10):1077–1083. doi: 10.1081/ddc-100100271. [DOI] [PubMed] [Google Scholar]
- Chaulang G., Patel P., Hardikar S., Kelkar M., Bhosale A., Bhise S. Formulation and evaluation of solid dispersions of furosemide in sodium starch glycolate. Trop. J. Pharmaceut. Res. 2009;8(1):43–51. [Google Scholar]
- Deng J., Huang L., Liu F. Understanding the structure and stability of paclitaxel nanocrystals. Int. J. Pharmaceut. 2010;390(2):242–249. doi: 10.1016/j.ijpharm.2010.02.013. [DOI] [PMC free article] [PubMed] [Google Scholar]
- Eloy J.O., Marchetti J.M. Solid dispersions containing ursolic acid in Poloxamer 407 and PEG 6000: A comparative study of fusion and solvent methods. Powder Technol. 2014;253:98–106. [Google Scholar]
- Goud N.R., Gangavaram S., Suresh K., Pal S., Manjunatha S.G., Nambiar S., Nangia A. Novel furosemide cocrystals and selection of high solubility drug forms. J. Pharmaceut. Sci. 2012;101(2):664–680. doi: 10.1002/jps.22805. [DOI] [PubMed] [Google Scholar]
- Guideline, I.H.T., 2005. Validation of analytical procedures: text and methodology Q2 (R1). International Conference on Harmonization, Geneva, Switzerland.
- Guideline, I.H.T., 2009. Pharmaceutical Development Q8 (R2). Current step 4.
- He C., Hu Y., Yin L., Tang C., Yin C. Effects of particle size and surface charge on cellular uptake and biodistribution of polymeric nanoparticles. Biomaterials. 2010;31(13):3657–3666. doi: 10.1016/j.biomaterials.2010.01.065. [DOI] [PubMed] [Google Scholar]
- Jores K., Mehnert W., Drechsler M., Bunjes H., Johann C., Mäder K. Investigations on the structure of solid lipid nanoparticles (SLN) and oil-loaded solid lipid nanoparticles by photon correlation spectroscopy, field-flow fractionation and transmission electron microscopy. J. Controlled Release. 2004;95(2):217–227. doi: 10.1016/j.jconrel.2003.11.012. [DOI] [PubMed] [Google Scholar]
- Kakran M., Sahoo N.G., Li L., Judeh Z. Fabrication of quercetin nanoparticles by anti-solvent precipitation method for enhanced dissolution. Powder Technol. 2012;223:59–64. [Google Scholar]
- Kakran M., Sahoo N.G., Tan I.-L., Li L. Preparation of nanoparticles of poorly water-soluble antioxidant curcumin by antisolvent precipitation methods. J. Nanoparticle Res. 2012;14(3):757. [Google Scholar]
- Klausner E.A., Lavy E., Stepensky D., Cserepes E., Barta M., Friedman M., Hoffman A. Furosemide pharmacokinetics and pharmacodynamics following gastroretentive dosage form administration to healthy volunteers. J. Clin. Pharmacol. 2003;43(7):711–720. [PubMed] [Google Scholar]
- Matsuda Y., Tatsumi E. Physicochemical characterization of furosemide modifications. Int. J. Pharmaceut. 1990;60(1):11–26. [Google Scholar]
- Modi A., Tayade P. Enhancement of dissolution profile by solid dispersion (kneading) technique. AAPS Pharmscitech. 2006;7(3):E87–E92. doi: 10.1208/pt070368. [DOI] [PMC free article] [PubMed] [Google Scholar]
- Müller R., Jacobs C., Kayser O. Nanosuspensions as particulate drug formulations in therapy: rationale for development and what we can expect for the future. Adv. Drug Deliv. Rev. 2001;47(1):3–19. doi: 10.1016/s0169-409x(00)00118-6. [DOI] [PubMed] [Google Scholar]
- Patel R.P., Patel D.J., Bhimani D.B., Patel J.K. Physicochemical characterization and dissolution study of solid dispersions of furosemide with polyethylene glycol 6000 and polyvinylpyrrolidone K30. Dissolution Technol. 2008;15(3):17–25. [Google Scholar]
- Patravale V., Kulkarni R. Nanosuspensions: a promising drug delivery strategy. J. Pharm. Pharmacol. 2004;56(7):827–840. doi: 10.1211/0022357023691. [DOI] [PubMed] [Google Scholar]
- Sahu B.P., Das M.K. Nanoprecipitation with sonication for enhancement of oral bioavailability of furosemide. Acta Poloniae Pharmaceut. N Drug Res. 2014;71(1):129–137. [PubMed] [Google Scholar]
- Salazar J., Heinzerling O., Müller R.H., Möschwitzer J.P. Process optimization of a novel production method for nanosuspensions using design of experiments (DoE) Int. J. Pharmaceut. 2011;420(2):395–403. doi: 10.1016/j.ijpharm.2011.09.003. [DOI] [PubMed] [Google Scholar]
- Serajuddin A.T. Salt formation to improve drug solubility. Adv. Drug Deliv. Rev. 2007;59(7):603–616. doi: 10.1016/j.addr.2007.05.010. [DOI] [PubMed] [Google Scholar]
- Sistovaris N., Hamachi Y., Kuriki T. Multifunctional substances — Determination of pKa-values by various methods. Fresenius' J. Anal. Chem. 1991;340(6):345–349. [Google Scholar]
- Verma S., Lan Y., Gokhale R., Burgess D.J. Quality by design approach to understand the process of nanosuspension preparation. Int. J. Pharmaceut. 2009;377(1):185–198. doi: 10.1016/j.ijpharm.2009.05.006. [DOI] [PubMed] [Google Scholar]
- Westesen K., Bunjes H., Koch M.H.J. Physicochemical characterization of lipid nanoparticles and evaluation of their drug loading capacity and sustained release potential. J. Controlled Release. 1997;48(2):223–236. [Google Scholar]
- Yu S.-H., Cho I.-H., Chang S.-W., Lee S.-J., Chun S.-Y., Kim H.-L. Decomposition characteristics of fungicides (benomyl) using a design of experiment (DOE) in an E-beam process and acute toxicity assessment. J. Korean Soc. Environ. Eng. 2008;30(9):955–960. [Google Scholar]
- Zhang Z.-B., Shen Z.-G., Wang J.-X., Zhao H., Chen J.-F., Yun J. Nanonization of megestrol acetate by liquid precipitation. Indus. Eng. Chem. Res. 2009;48(18):8493–8499. [Google Scholar]