

Abstract
Adverse blood pressure (BP) is a major independent risk factor for epidemic cardiovascular diseases affecting almost one-quarter of the adult population worldwide. Dietary intake is a major determinant in the development and progression of high BP. Lifestyle modifications, including recommended dietary guidelines, are advocated by the American Society of Hypertension, the International Society of Hypertension, the Japanese Society of Hypertension, and many other organisations for treating all hypertensive people, prior to initiating drug therapy and as an adjunct to medication in persons already on drug therapy. Lifestyle modification can also reduce high BP and prevent development of hypertension. This review synthesizes results from the International Study of Macro/Micronutrients and Blood Pressure (INTERMAP), a cross-sectional epidemiological study of 4,680 men and women aged 40–59 years from Japan, the People’s Republic of China the United Kingdom, and the United States, published over the past few years on cross cultural BP differences. INTERMAP has previously reported that intakes of vegetable protein, glutamic acid, total and insoluble fibre, total polyunsaturated fatty acid and linoleic acid, total n-3 fatty acid and linolenic acid, phosphorus, calcium, magnesium, and non-heme iron were inversely related to BP. Direct associations of sugars (fructose, glucose and sucrose) and sugar-sweetened beverages, (especially combined with high sodium intake) cholesterol, glycine and alanine, and oleic acid from animal sources with BP were also reported by the INTERMAP Study.
Keywords: Blood Pressure, Diet, Guideline, Hypertension, INTERMAP, Management, Nutrient, Prevention
INTRODUCTION
Adverse blood pressure (BP), including pre-hypertensive [defined as systolic blood pressure (SBP) of 120 to 139 mmHg or a diastolic blood pressure (DBP) of 80 to 89 mmHg]1 and hypertensive [defined as SBP ≥140 mmHg and/or DBP ≥90 mmHg and/or current use of antihypertensive medication] levels,1,2 is a key independent risk factor for major cardiovascular diseases (CVD), afflicting a high and growing proportion of the adult population worldwide.3–6 Overall, an estimated 26% of the world’s adult population were hypertensive in 2000 and 29% are projected to have hypertension (HTN) by 2025.7 Health policies dependent on antihypertensive drugs alone are only partially successful as many persons with established HTN do not take medication or do not take enough medication to achieve control,8–10 while the large numbers of people with BP in the normal, but not optimal, and high-normal range go untreated. A challenge is how to set up an effective population-wide strategy to stem the BP rise with age and to reduce overall BP levels, and in turn, reduce cardiovascular morbidity and mortality. Lifestyle modification including adherence to evidence-based dietary guidelines is recommended in HTN management and included within prevention guidelines advocated by the American Society of Hypertension (ASH), the European Society of Hypertension, the International Society of Hypertension (ISH), and many other organisations for treatment of all hypertensive people and prevention among those with a strong family history of HTN.1,2,11–17 Dietary intake is a major determinant in the development and progression of high BP.6 Dietary factors identified as being associated with BP in the INTERnational study of MAcro/micronutrients and blood Pressure (INTERMAP) are reported here (surveyed 1996–1999) and placed in the context of the available literature.
EVIDENCE PRIOR TO THE INTERMAP STUDY
Lifestyle modification offers the potential for preventing development of raised BP and frank HTN and can lower BP at little cost and with minimal risk.18 The INTERSALT Study in 1988 reported that sodium (Na) intake, body mass index (BMI) and excessive alcohol intake were all directly associated with BP, while potassium (K) was inversely associated.19–22 These findings were reflected in dietary recommendations for management and prevention of high BP:23 reduction of Na intake24 (<100 mmol/day); restriction of alcohol intake25 (<30 ml/day ethanol for men and <15 ml/day ethanol for women); and maintenance of adequate K intake26 (90 mmol/day). Other lifestyle modifications recommended included weight reduction (body mass index <27 kg/m2), regular physical activity and tobacco avoidance.23 There were no recommended intakes of calcium (Ca), magnesium (Mg), cholesterol or fatty acids (e.g. n-3 fatty acids) though favourable intakes of these nutrients may further contribute to lowering BP.
THE INTERMAP STUDY – DESIGN AND METHODS
The INTERMAP Study is a cross-sectional epidemiological study of 4,680 men and women aged 40–59 years from 17 population samples (Figure 1) in Japan, the People’s Republic of China, the United Kingdom and the United States (www.clinicaltrials.gov NCT00005271).27 Participants were selected randomly from population lists, stratified by age/sex. Staff were trained, standardized and certified for BP measurement on the basis of a common protocol.27 Each participant attended four visits, visits 1 and 2 on consecutive days, visits 3 and 4 on consecutive days on average 3 weeks later. For BP measurement, each participant – having emptied his/her bladder – was seated comfortably for 5 min, with no physical activity in the preceding half hour. BP was measured twice at each visit with a random zero sphygmomanometer. Korotkoff sounds I and V were criteria for SBP and DBP. Measurements of height and weight were obtained at two visits, as were questionnaire data on daily alcohol consumption over the previous 7 days. Dietary data were collected at each visit by a trained certified interviewer with use of the in-depth multipass 24-h recall method.28 All foods, beverages, and supplements consumed in the previous 24 hours, including preparation methods, were recorded. Each participant provided two 24-h urine collections, start and end timed at the research centre; measurements included urinary volume, Na, K, Mg, Ca, urea and creatinine,27 amino acids,29 and proton nuclear magnetic resonance (1H NMR) spectroscopy.30 For external estimation of laboratory precision, a random 10% of samples were split locally and sent to the laboratory with different identification numbers. Questionnaire data were obtained on demographic and other possible confounders, including education, occupation, physical activity, cigarette smoking, history of CVD, or diabetes mellitus (DM), current use of a special diet, and use of antihypertensive and lipid-lowering drugs. Individuals were excluded if they did not attend all four visits; diet data were considered unreliable; energy intake from any 24-h dietary recall was <500 kcal/day or >5000 kcal/day for women, >8000 kcal/day for men; two urine collections were not available; data on other variables were incomplete or indicated protocol violation (total exclusions: 215 people).31 The study received institutional ethics committee approval for each site; all participants gave written informed consent.
Figure 1.
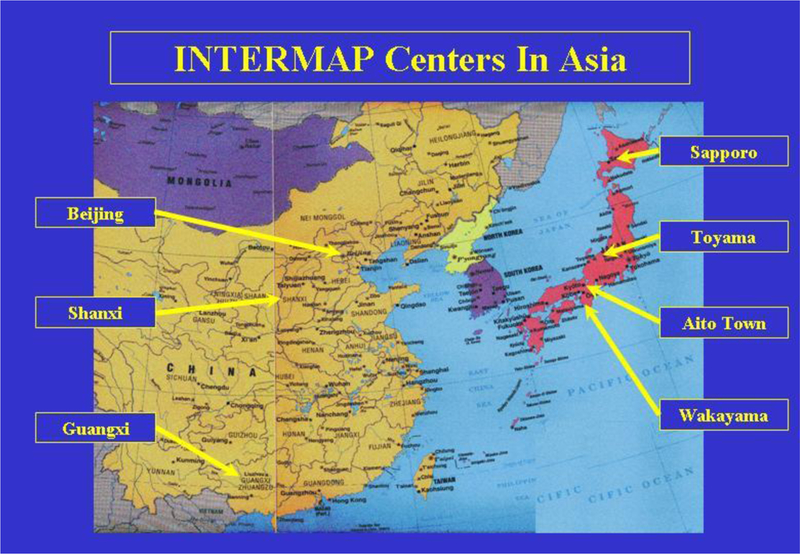
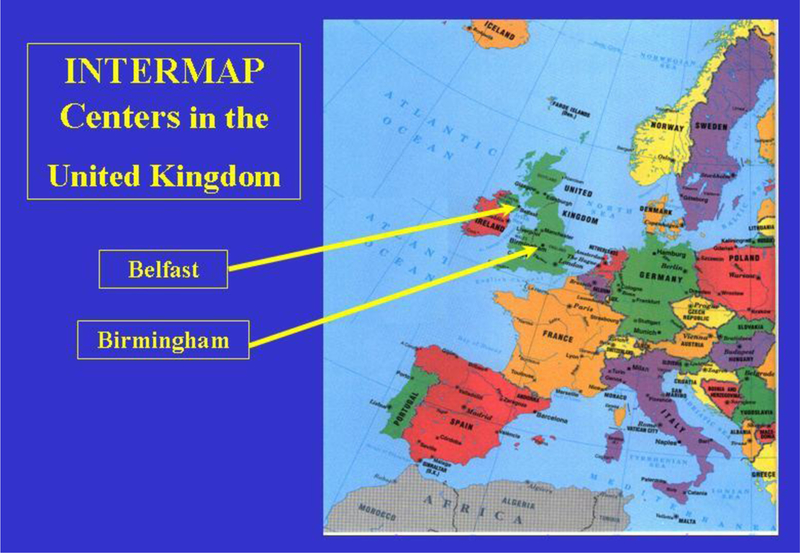

Locations of the field centres in Japan, People’s Republic of China, UK and USA, the INTERAMP Study27
INDIVIDUAL NUTRIENTS AND BLOOD PRESSURE
The INTERMAP Study reported that intakes of vegetable (plant) protein,31 glutamic acid,32 total and insoluble fibre33, total polyunsaturated fatty acid (PUFA) and linoleic acid,34 oleic acid from vegetable sources35, total n-3 fatty acid and linolenic acid,36 phosphorus (P), Ca and Mg,37 non-heme iron (Fe) and total Fe,38 and starch39 were inversely related to BP. Direct associations of sugars (fructose, glucose and sucrose),40 cholesterol,41 glycine and alanine,42 and oleic acid from animal sources35 with BP were also reported by the INTERMAP Study. Findings of individual nutrients and BP of the INTERMAP Study are summarized in Table 1 and in the following sections.
Table 1.
Mean difference in blood pressure with dietary intakes higher by 2 standard derivations, regression model§ for all INTERMAP participants (N=4,680)
| Nutrient | 2 SD difference | SBP difference (mmHg) | DBP difference (mmHg) | Note | ||
|---|---|---|---|---|---|---|
| Vegetable protein31 | 2.80 %kcal | −1.11 | ** | −0.71 | * | |
| −1.24 | * | −0.86 | * | (i) | ||
| Animal protein31 | 5.84 %kcal | 0.20 | −0.02 | |||
| Glutamic acid32 | 1.00 %kcal | −1.08 | * | −0.66 | * | (c) |
| Glycine42 | 0.89 %total protein |
2.03 | *** | 0.89 | ** | |
| 0.31 %kcal | 0.42 | 0.15 | (c) | |||
| Alanine42 | 0.85 %total protein |
1.32 | * | 0.38 | ||
| 0.34 %kcal | −0.18 | −0.17 | (c) | |||
| Total polyunsaturated fatty acid34 |
4.04 %kcal | −0.38 | −0.34 | |||
| −1.35 | * | −0.88 | * | (j) | ||
| Linoleic acid34 | 3.77 %kcal | −0.39 | −0.31 | |||
| −1.36 | * | −0.83 | * | (j) | ||
| Total n-3 fatty acid36 | 0.67 %kcal | −0.55 | −0.57 | * | (a) | |
| −1.01 | −0.98 | * | (a,j) | |||
| −0.74 | * | −0.72 | * | (a,k) | ||
| Linolenic acid36 | 0.57 %kcal | −0.60 | −0.50 | |||
| −0.97 | −0.87 | (j) | ||||
| −0.77 | * | −0.61 | * | (k) | ||
| Monounsaturated fatty acid35 |
5.35 %kcal | 0.05 | −0.84 | * | (e) | |
| −1.22 | −1.54 | * | (e,j) | |||
| Oleic acid from vegetable sources35 |
4.12 %kcal | −0.84 | * | −0.65 | * | (e) |
| −1.28 | * | −1.01 | * | (e,j) | ||
| Oleic acid from animal sources35 |
3.86 %kcal | 2.47 | *** | 0.94 | * | (j) |
| 1.80 | 1.22 | (e,j) | ||||
| Starch39 | 14.11 %kJ | −0.57 | −0.52 | |||
| −0.96 | −0.92 | * | (b) | |||
| −1.52 | −1.23 | * | (b,j) | |||
| Fructose40 | 5.60 %kcal | 0.73 | 0.44 | (l) | ||
| 1.07 | 0.62 | (c,l) | ||||
| 2.50 | ** | 1.71 | ** | (c,l,o) | ||
| Glucose40 | 5.10 %kcal | 0.75 | 0.44 | (l) | ||
| 1.08 | * | 0.60 | (c,l) | |||
| 2.69 | *** | 1.61 | ** | (c,l,o) | ||
| Sucrose40 | 9.80 %kcal | 0.21 | 0.71 | * | (l) | |
| 0.33 | 0.74 | * | (c,l) | |||
| Total fibre33 | 6.80 g/1000kcal | −1.01 | −0.42 | (f,m) | ||
| 6.90 g/1000kcal | −1.69 | ** | −1.15 | (f,n) | ||
| Insoluble fibre33 | 4.60 g/1000kcal | −1.81 | −1.16 | * | (g,m) | |
| 4.80 g/1000kcal | −2.48 | ** | −3.51 | ** | (g,n) | |
| Soluble fibre33 | 2.20 g/1000kcal | 0.88 | 0.68 | (h,m) | ||
| 2.20 g/1000kcal | 0.89 | −0.47 | (h,n) | |||
| Cholesterol41 | 131.0 mg/1000kcal |
0.94 | * | 0.24 | ||
| 1.42 | ** | 0.37 | (d) | |||
| 1.46 | ** | 0.66 | * | (d,k) | ||
| Phosphorus37 | 232.0 mg/1000kcal |
−1.36 | ** | −0.94 | ** | |
| −1.64 | * | −1.13 | * | (j) | ||
| Calcium37 | 240.2 mg/1000kcal |
−1.48 | *** | −0.97 | ** | |
| Magnesium37 | 75.6 mg/1000kcal |
−1.51 | ** | −0.61 | ||
| Total Iron38 | 4.20 mg/4.2 MJ | −1.44 | *** | −0.71 | ** | |
| Non-haem Iron38 | 4.13 mg/4.2 MJ | −1.51 | *** | −0.75 | ** | |
| Haem Iron38 | 0.61 mg/4.2 MJ | 0.19 | 0.10 | |||
Adjustment for population sample, age, sex, special diet, history of cardiovascular disease (CVD) or diabetes mellitus (DM), family history of hypertension, moderate or heavy physical activity (usual hours per day), dietary supplement intake, 24-h urinary sodium (Na) and potassium excretion and 7 day alcohol intake with either height and weight or body mass index
p < 0.05
p < 0.01
p < 0.001
Regression model with additional adjustment for cholesterol, saturated fatty acid (SFA), calcium (Ca) and phosphorus (P)
Regression model with additional adjustment for cholesterol, SFA, polyunsaturated fatty acid (PUFA) and Ca
Regression model with additional adjustment for cholesterol, SFA and PUFA
Regression model with additional adjustment for SFA, PUFA and P
Regression model with additional adjustment for cholesterol, SFA, and Ca
Regression model with additional adjustment for total energy, total protein, total fat, total sugar
Regression model with additional adjustment for total energy, total protein, total fat, total sugar, soluble fibre
Regression model with additional adjustment for total energy, total protein, total fat, total sugar, insoluble fibre
Excluding persons taking hypertensive or cardiovascular disease medications (N=3,930)
Non-intervened persons only (individuals not on a special diet, not consuming nutritional supplements, not with diagnosed CVD/diabetes, not taking medication for high BP/CVD/diabetes) and regressions not adjusted for special diet, supplement use, or CVD-DM (N=2,238)
Non-hypertensive persons only (N=3,671)
UK and US participants only (N=2,696)
US participants only (N=2,195)
Non-hypertensive US participants only (N=1,477)
With Na excretion > median values: UK men, >155 mmol/24-h; UK women, >125 mmol/24-h; USA men, >174 mmol/24-h; USA women, >137 mmol/24-h (N=1,347)
Protein and amino acids
As noted above, the relationship between individuals’ vegetable protein intake and BP was inverse (SBP difference with 2 standard deviation (SD) higher vegetable protein intake was −1.1 mmHg, P<0.01); while for animal protein, there was significant direct associations with BP, which did not persist after adjustment for height and weight; there was no significant association between total protein intake and BP.31 The INTERMAP Study subsequently reported that glutamic acid, the predominant dietary amino acid (especially in vegetable protein), was inversely associated with BP (SBP difference −1.1 mmHg for 2SD higher glutamic acid intake (4.72 %total protein), P<0.05).32 Dietary glycine and alanine levels (predominant in animal protein) had independent direct relations to BP: glycine intake higher by 2SD (0.89 %total protein) was associated with differences of 2.0 mmHg (P<0.001) for SBP.42 Systematic reviews have suggested a small beneficial effect of protein on BP, especially for plant protein.15,43 A meta-analysis of randomized controlled trials (RCTs) with 32 comparisons between protein and carbohydrate found that dietary protein intake increased on average by 40 g/day lower mean SBP and DBP by −1.8 mmHg and −1.1 mmHg, respectively (both P<0.001), with no heterogeneity in BP reduction based on protein source.44 A meta-analysis (2013) of observational studies and RCTs showed a small inverse association of total protein with BP, but a non-significant inverse association was found for plant protein.45 The analysis reported a pooled estimate of −0.2 mmHg (95% confidence interval [CI] −0.4 to −0.01) systolic per 25 g of total protein intake in 6 cross-sectional studies; in 14 intervention studies using carbohydrate as a control treatment, the pooled BP effect was −2.1 mm systolic (−2.9 to −1.4) for a mean contrast in protein intake of 41 g/day. However, the associations of plant protein and animal protein with BP were broadly similar in prospective studies and RCTs. The BP effect of specific types of protein remains to be established.
Fatty acids and fish oils
Participants in the INTERMAP Study who reported a higher intake of n-3 PUFA (rich in fish oil) had lower BP levels.36 The study also reported an inverse association of linoleic acid (the main dietary PUFA) with BP.34 Meta-analyses of RCTs on fish oil supplements reported significant BP reduction overall and in hypertensive participants.46,47 The analyses (1993) showed that, compared to control groups, pooled estimates of SBP and DBP change were −1.0 mmHg (95% CI −2.0 to 0.0) and −0.5 mmHg (−1.2 to 0.2) in normotensive individuals, and −5.5 mmHg (−8.1 to −2.9) and −3.5 mmHg (−5.0 to −2.1) in untreated hypertensive individuals with an average of >3 g/day n-3 PUFA supplementation.46 Fish oil supplementation (median of 3.7 g/day) was reported to reduce SBP by 2.1 mmHg (95% CI 1.0 to 3.2) and DBP by 1.6 mmHg (1.0 to 2.2), compared to placebo, in meta-analysis of 36 RCTs (2002).47 A review (2006) of RCTs of linolenic acid supplementation showed no significant difference in BP changes between participants taking supplementation compared to placebo control groups.48 Other INTERMAP Study findings include inverse associations of monounsaturated fatty acid (MUFA), total oleic acid (main MUFA) and oleic acid from vegetable sources with BP.35 A review (2006) of studies conducted in the Mediterranean countries reported that MUFA was inversely associated with BP; this contrasts with earlier studies conducted mainly in the USA and Northern Europe.49 This may due to the difference on food sources of MUFA: dairy, nut butter and meat for the western diet, and olives and olive oil for the traditional Mediterranean diet (MetDiet).50 A meta-analysis of 9 RCTs (2011) comparing a high MUFA diet to a low MUFA diet reported significant reduction on BP.51 The pooled effect of a high-MUFA diet was −2.3 mmHg (95% CI −4.3 to −0.3) for SBP. Another meta-analysis of 13 RCTs (2014) reported studies examined effect of total amount of fat and the quality of fat (proportions of SFA, MUFA or total unsaturated fat) on BP but results were inconsistent and no conclusions could be drawn.52
Starch and sugars
Among the participants of the INTERMAP study, there were modest inverse associations of starch intake and BP, which were attenuated by control for vegetable protein.39 Findings from the Multiple Risk Factor Intervention Trial (MRFIT) reported a direct association between dietary starch intake and BP.53 A meta-analysis of 10 studies (2007) comparing the effects of high-carbohydrate versus high-MUFA diets indicated that the high-carbohydrate diets were associated with significantly higher BP (mean SBP difference 2.6 mmHg, P=0.02).54
The INTERMAP Study reported direct fructose- and glucose-BP associations, with significant sugar-sodium interactions: for individuals with above-median 24-h urinary Na excretion, fructose intake higher by 2SD (5.6% kcal) was associated with systolic/diastolic BP differences of 2.5/1.7 mmHg.40 A meta-analysis of 13 RCTs of isocaloric diets (2012) with a median follow-up of 4 weeks found a significant DBP-lowering effect when fructose was substituted for other carbohydrates (mean difference −1.5 mmHg, 95% CI −2.8 to −0.3) but no significant effect on SBP.55 A meta-analysis of 7 studies (2014) showed that fructose consumption was positively associated with elevated SBP (0.3 mmHg, P=0.002) and there was statistically significant heterogeneity among studies (I2=83.4%, P=0.001).56 Another review of 12 RCTs (2014) reported no significant effect of higher sugar intakes on SBP and a significantly greater DBP of 1.4 mmHg (P=0.02); a significant and positive association of sugar intake with BP was found in a subgroup of 3 trials >8 weeks in duration (mean difference: 6.9 mmHg for SBP, P<0.0001 and 5.6 mmHg for DBP, P<0.001).57
Fibre
The INTERMAP Study reported higher intake of total dietary fibre, especially insoluble, was associated with lower BP.33 A meta-analysis (2005) of 25 RCTs demonstrated the hypotensive effects of dietary fibre in hypertensive persons (SBP −6.0 mmHg and DBP −4.2 mmHg per 10.7 g/day total fibre on average, both P<0.001) while in normotensive individuals, there was a smaller, non-significant reduction in BP.58 Another meta-analysis in the same year investigating the effect of fibre supplementation (average dose of 11.5 g/day) on BP from 24 RCTs reported a small BP-lowering effect of −1.1 mmHg (95% CI −2.5 to 0.2) SBP and −1.3 mmHg (−2.0 to −0.5) DBP.59 A recent review (2015) of RCTs of 7 types of fibre (e.g., arabinoxylan from wholegrain foods, beta-glucan from oats and barley) reported that higher consumption of fibre was associated with lower BP, and diets rich in beta-glucan reduced SBP by 2.9 mmHg (95% CI 0.2 to 2.7) and DBP by 1.5 mmHg (0.2 to 2.7) for a median difference in beta-glucan of 4 g.60
Phosphorus
The INTERMAP Study showed that higher P intake (per 2SD of 232.0 mg/1000kcal), independently of other nutrients, was associated with lower BP levels (−1.4 mmHg for SBP, −0.9 mmHg for DBP, both P<0.01).37 A study using dietary data for 13,444 participants from Atherosclerosis Risk in Communities cohort and the Multi-Ethnic Study of Atherosclerosis reported P intake (per 500 mg/day higher) was inversely associated with SBP (−2.1 mmHg, 95% CI −1.1 to −3.0), after adjustment for confounders and highly correlated nutrients.61
Calcium and magnesium
Epidemiological data have shown that both dietary and supplemental Ca are associated with small reductions in BP. For all 4,680 INTERMAP participants, estimated BP differences for dietary Ca higher by 240.2 mg/1000kcal (2SD) was −1.5 mmHg for SBP (P<0.001) and −1.0 mmHg for DBP (P<0.01).37 A meta-analysis of 22 RCTs (1996) reported an inverse relationship of Ca supplement on BP; overall pooled estimated of Ca supplementation were −0.9 mmHg (95% CI −1.74 to −0.05) for SBP and it was −1.7 mmHg (−3.2 to −0.2) for hypertensive persons.62 Another pooled meta-analysis of RCTs of Ca supplements (1999) also reported a reduction in SBP of 1.4 mmHg and in DBP of 0.8 mmHg (both P<0.001).63 Similar results were reported in a meta-analysis of 40 RCTs (2006); mean daily dose of 1,200mg Ca supplementation reduced SBP by −1.9 mmHg (95% CI, −2.9 to −0.8) and DBP by −1.0 mmHg (−1.6 to −0.4).64 A Cochrane review (2006) of 13 RCTs with between 8 and 15 weeks follow-up found that Ca supplementation was associated with a small statistically significant reduction in SBP (mean difference −2.5 mmHg) but had little effect on DBP.65
The INTERMAP Study suggested an inverse association between dietary Mg and BP, for dietary Mg higher by 75.6 mg/1000kcal (2SD), the estimated BP differences were −1.5 mmHg for SBP (P<0.01) and −0.6 mmHg for DBP.37 An early meta-analysis (1998) of 29 studies reported a negative correlation between dietary Mg intake and BP.66 Subsequently, a meta-analysis of 20 RCTs reported Mg supplementation resulted in only a small overall reduction in BP: estimates of BP change relative to placebo were −0.6 mmHg (95% CI −2.2 to 1.0) for SBP and −0.8 mmHg (−1.9 to 0.4) for DBP for average Mg increase of 367.6 mg/day.67 There was a dose-dependent effect of Mg, with reduction of 4.3 mmHg SBP (P<0.001) and of 2.3 mmHg DBP (P=0.09) for each 238.7 mg/day increase in Mg. In 2006, a Cochrane review of 12 RCTs with 8 to 26 weeks follow-up reported that supplemental Mg and lowered DBP (though not SBP): mean difference −2.2 mmHg DBP (95% CI −3.4 to-0.9). However, there was marked heterogeneity between studies (I2=47.0%).68
A prospective study of >136,000 Chinese men and women reported that persons with Ca/Mg ratios above the median (>1.7), intakes of Ca (≥600 mg/day) and Mg (≥320 mg/day) were associated with reduced risks of total mortality, and mortality due to coronary heart disease; conversely, participants with a Ca/Mg ratio ≤1.7, intake of Mg was associated with increased risks of total mortality and mortality due to CVD.69 The mean intake of Mg in Chinese population was similar to the US populations whereas the Ca/Mg intake ratio was significantly lower compared to US populations (3.0); the findings suggested that dietary Ca/Mg ratio, not Mg or Ca intake alone, might contribute to the different incidence and risks of mortality.69
Iron
The INTERMAP Study suggested an inverse association of total Fe intake and non-heme Fe intake with BP.38 Dietary total Fe intake higher by 4.20 mg/4.2MJ (2SD) was associated with −1.4 mmHg (P<0.001) SBP and non-heme Fe intake higher by 4.1 mg/4.2MJ (2SD) was associated with −1.5 mmHg (P<0.001) SBP. A follow-up study of 2,895 participants reported similar findings; low non-heme Fe intake at baseline was associated with a greater increase in SBP over time (P-trend = 0.002) and participants in the top tertile of non-heme Fe intake at baseline had a significantly lower risk of HTN after 5.4 y of follow-up compared with those in the bottom tertile.70 However, the relationship between Fe intake and raised BP or risk of CVD is not well established in the literature. A review of 55 studies (2013) suggested there was not a high level of evidence supporting the hypothesis that the Fe may be associated with CVD.71 A recent meta-analysis (2015) of 13 prospective cohort studies showed higher dietary intake of heme Fe (1 mg/day) was associated with an increased risk of CVD (relative risk [RR] = 1.07, 95% CI 1.01 to 1.14) and no association between CVD risk and dietary non-heme Fe (RR=0.98, 0.96 to 1.01) or total Fe (RR=1.00, 0.95 to 1.06).72
Multiple nutrients
The INTERMAP Study reported the combined effects of multiple nutrients on BP by assessing multiple regression models involving various combinations of dietary vegetable protein, Ca, Mg, P, non-heme Fe, Na, K, PUFA and heavy alcohol consumption adjusted for BMI (Table 2).73 For all 4,680 INTERMAP participants, improved Na and K intakes and elimination of heavy alcohol consumption, gave a combined estimated effect of SBP lower by 7 mmHg; with the addition of other dietary variables, the estimated effect on SBP was 2–3 mmHg lower (about 10 mmHg).
Table 2.
Estimated population-wide lower average systolic blood pressure (mmHg) of more favourable diet, the INTERMAP Study
| Variable | Improvement in level |
Estimated lower average SBP (mmHg) Multivariate models with BMI § |
|||
|---|---|---|---|---|---|
| Model 1: Ca, P, Vegetable Protein |
Model 2: Ca, Non- heme Fe, Vegetable Protein |
Model 3: Ca, P, Mg |
Model 4: Ca, Mg, Non-heme Fe |
||
| Urinary sodium (mmol/24h) | −110 | −0.7‡ | −0.7‡ | −0.7 | −0.7‡ |
| Urinary potassium (mmol/24h) | +60 | −2.8*** | −2.7*** | −1.2‡ | −2.8*** |
| Calcium, Ca (mg/1000kcal) | +240 | −1.4* | −1.2** | −1.8** | −1.1 |
| Phosphorus, P (mg/1000kcal) | +232 | −0.5 | -- | −0.2 | -- |
| Magnesium, Mg (mg/1000kcal) | +76 | -- | -- | −0.9‡ | −1.3** |
| Non-heme Iron, Fe (mg/1000kcal) |
+4.1 | -- | −0.9‡ | -- | −1.3** |
| Vegetable protein (%kcal) | +2.8 | −1.2** | −0.8‡ | -- | -- |
| Polyunsaturated fatty acid (%kcal) | +4.1 | −0.6 | −0.6 | −0.8 | −0.7 |
| Heavy alcohol intake Men>26g/day; Women>13g/day |
Prevalence None |
(−3.3***) −0.6† |
(−3.3***) −0.5† |
(−3.5***) −0.6† |
(−3.4***) −0.6† |
| Body mass index (kg/m2) | −4 | −3.4*** | −3.4*** | −3.5*** | −3.5*** |
| Sum – All Variables | -- | −11.2 | −10.9 | −10.4 | −11.0 |
| Sum – Na, K, Alcohol, BMI | -- | −7.5 | −7.4 | −7.6 | −7.7 |
controlled for age, gender, sample, family history of high BP, physical activity, diagnosis of cardiovascular disease/diabetes, use of special diet, dietary supplement use
p <0.10
p < 0.05
p < 0.01
p < 0.001
Using a systematic nutrient-wide association study (NWAS) approach to evaluate multiple associations between a wide range of nutrients and BP, the INTERMAP Study reported inverse associations between BP and intake of B vitamins (folacin, riboflavin, and thiamin) which replicated in National Health And Nutrition Examination Survey data. 74 Associations of BP with B vitamins had previously been poorly studied or were not replicated. This systematic evaluation of multiple nutrients also found inverse associations of dietary P, Mg, and non-heme Fe intakes with SBP, and previously established direct associations of Na/K ratio and alcohol with BP.
In the Dietary Approaches to Stop Hypertension (DASH) trial, participants were randomly assigned to control diet (the average diet in the US), fruits-and-vegetables diet (a diet rich in fruits and vegetables), or combination diet (a diet rich in fruits, vegetables, and low-fat dairy products and with reduced saturated and total fat).18 The combination diet reduced SBP by −5.5 mmHg (95% CI −7.4 to −3.7) more than the control diet did (P<0.001).18 In the DASH-Na trial, participants were randomly assigned to a control diet or the DASH diet; and participants ate foods with 3 different levels of Na intake.75 Reducing the Na intake from the high to the intermediate level reduced BP during both the control diet and the DASH diet. The Optimal Macronutrient Intake Trial for Heart Health (OMNIHEART) trial76 reported BP benefits from replacing carbohydrate in the DASH-Na diet with either protein or MUFA. The INTERMAP Study investigated associations of three OMNIHEART-like nutrient profiles with a typical American nutrient profile, using two different statistical methods: regression of BP on a linear OMNIHEART nutrient score calculated for each individual and Bayesian profile regression.77 After adjustment for potential confounders, an OMNIHEART score higher by 1 point was associated with differences of −1.0 mmHg for SBP and −0.5 mm Hg for DBP (both P<0.001). In the Bayesian analysis, mean systolic/diastolic BPs were 111.3/68.4 and 115.2/70.6 mmHg for OMNIHEART and Control profiles, respectively, after controlling for possible confounders, with BP differences of −3.9/−2.2 mmHg.
Foods and drinks
Because people consume foods and beverages, not isolated nutrients, there is a fundamental interest in these associations. The INTERMAP Study collected data on foods, beverages and preparation methods derived from four 24-h dietary recalls provided by all participants. The study reported a significant and inverse relationship between total vegetable intake and BP; estimated average SBP differences associated with raw vegetable intake (68 g/1000kcal) and cooked vegetable intake (92 g/1000kcal) were −1.3 mmHg (P=0.02) and −0.9 mmHg (P<0.1).78 The commonly consumed individual vegetables, tomatoes, carrots, scallions, peas, and celery, were related significantly inversely to BP. Apples and pears, citrus fruit, and bananas were the most commonly consumed raw fruit among the INTERAMP participants in each country; fruit juice intake was negligible in East Asian samples.79 Although there were no consistent associations between raw fruit and fruit juice intakes of individuals and BP, participants with higher raw fruit intakes had lower energy intake, and had lower BP than those with lower intakes. The higher raw fruit consumers in the UK and US had higher intakes of vegetables, low-fat dairy products, fiber-rich cereals and grains compared with lower raw fruit consumers. These INTERMAP findings on fruits and vegetables reinforce current dietary recommendations for HTN management and prevention.1, 2
The INTERMAP study reported sugar-sweetened beverage (SSB) intake higher by 1 serving/day (355 ml/day) was associated with systolic/diastolic BP differences of 1.1/0.4 mmHg (P<0.001/<0.05).40 These direct SSB-BP associations were stronger for the INTERAMP US participants with higher 24-h urinary Na excretion with significant sugar-Na interactions in relation to higher BP. The associations of diet beverages with BPs were consistently inverse; diet beverages intake higher by 1 serving/day was associated with systolic/diastolic BP differences of −0.6/−0.4 mmHg (both P<0.05).40 A recent review (2014) of studies reported a positive relation between increased SSB intake and high BP; 5 reported an increase in mean BP whereas 7 reported an increase in the incidence of high BP. Dietary guidelines to reduce sugar intake and SSB consumption potentially will have major beneficial effects to prevent HTN80 and CVD.81
DIETARY GUIDELINES FOR MANAGEMENT AND PREVENTION OF HIGH BLOOD PRESSURE
The DASH-Na diet is a well-balanced approach to prevent and control HTN.18,75 It is recommended as part of the HTN guidelines from Canada,82 India,83 Japan,14 the UK2 and the US.1 It is also associated with lower risk of several types of cancer,84, 85 and reduced risk of developing type 2 diabetes.86 The MedDiet has also been advocated as a means to reduce BP and risk of CVD.87 It is characterized by a high intake of olive oil, fruit, nuts, and vegetables; a moderate intake of fish and poultry; low intake of dairy products, and red meat; and wine in moderation, consumed with meals.88 This traditional dietary pattern was shown to be associated with reduced risk of CVD in the Seven Countries Study in 1950s,89 and in more recent studies.87,90 A meta-analysis (2011) of 10 RCTs reported that adherence to the MedDiet was associated with reduced BP: −2.4 mmHg (95% CI −3.5 to −1.2) for SBP and −1.6 mmHg (−2.0 to −1.1).91 MedDiet and DASH have in common greater intakes of fruit, vegetables, nuts and fish and low intake of meat, with the MedDiet including more olive oil but fewer dairy products compared to the DASH diet. The 2010 Dietary Guidelines Advisory Committee reviewed articles published between 2009 and 2010 concluded that moderate amounts of low-fat or reduced-fat dairy products improved BP and decreased HTN risk.92
The guidelines of lifestyle modifications for management and prevention of HTN (2014, by ASH and the ISH)93 remained unchanged compared to the 1995 guidelines:23 healthy weight, salt reduction, moderate alcohol consumption, regular aerobic exercise and quit smoking. Most of the guidelines do recommend a healthy eating pattern: mainly plant-based foods such as fruits, vegetables, wholegrain foods; moderate amounts of low-fat or reduced-fat dairy products, moderate amounts of lean unprocessed meats, poultry and fish, moderate amounts of PUFA and MUFA (e.g. olive oil), and reduce amounts of SFA and cholesterol. 1,2, 11–14,83 Persons with HTN are also advised to increase the intake of fish in a few guidelines.13,14 Although the DASH-Na diet is often recommended as part of the guidelines for management and prevention of HTN, it is not endorsed by many Asian countries, such as China, where populations consume fewer dairy products than in Western countries.
The 2002 China National Nutrition and Health Survey reported that a higher traditional southern pattern score (a diet characterized by high intakes of fruit, pork, poultry, rice, vegetables, fish and seafood, and nuts) was associated with a lower prevalence of HTN, independent of BMI (P for trend=0.01); odds ratio for the top vs bottom quartile of traditional southern pattern diet score was 0.8 (95% CI, 0.6–0.9).94 This southern Chinese diet has a similar combination of foods as the DASH diet, except dairy products. A pilot study, DASH for Koreans (K-DASH), developed culturally sensitive dietary guidelines by the adaptation of DASH-Na diet and demonstrated the efficacy of this K-DASH intervention in reducing HBP in Korean Americans.95 The country-specific foods and beverages from the dietary recalls in the INTERMAP Study may provide information for developing culturally tailored dietary guidelines for management and prevention of HTN.
In summary, the INTERMAP findings on nutrients and foods associated with BP levels of individuals from four countries support current recommendations for a diet high in fruit and vegetables, whole grains, nuts and legumes, fish and lean meats and poultry as well as low-fat dairy products, and low in Na and SFA, as part of comprehensive nutritional/lifestyle approaches to preventing and controlling major established cardiovascular risk factors and epidemic CVD. ]#
Reference
- 1.Chobanian AV, Bakris GL, Black HR, Cushman WC, Green LA, Izzo JL Jr., Jones DW, Materson BJ, Oparil S, Wright JT Jr., Roccella EJ, and the National High Blood Pressure Education Program Coordinating Committee: The seventh report of the joint national committee on prevention, detection, evaluation, and treatment of high blood pressure: The JNC 7 report. JAMA 2003;289:2560–2572 [DOI] [PubMed] [Google Scholar]
- 2.Hypertebsion: clinical management of primary hypertension in adults. CG127. London: National Institute for Health and Care Excellence August 2011 2011. [Google Scholar]
- 3.Van den Hoogen PC, Feskens EJ, Nagelkerke NJ, Menotti A, Nissinen A, Kromhout D: The relation between blood pressure and mortality due to coronary heart disease among men in different parts of the world. Seven countries study research group. The New England journal of medicine 2000;342:1–8 [DOI] [PubMed] [Google Scholar]
- 4.Ezzati M, Lopez AD, Rodgers A, Vander Hoorn S, Murray CJ, Comparative Risk Assessment Collaborating Group: Selected major risk factors and global and regional burden of disease. Lancet 2002;360:1347–1360 [DOI] [PubMed] [Google Scholar]
- 5.Murray CJ, Richards MA, Newton JN, Fenton KA, Anderson HR, Atkinson C, Bennett D, Bernabe E, Blencowe H, Bourne R, Braithwaite T, Brayne C, Bruce NG, Brugha TS, Burney P, Dherani M, Dolk H, Edmond K, Ezzati M, Flaxman AD, Fleming TD, Freedman G, Gunnell D, Hay RJ, Hutchings SJ, Ohno SL, Lozano R, Lyons RA, Marcenes W, Naghavi M, Newton CR, Pearce N, Pope D, Rushton L, Salomon JA, Shibuya K, Vos T, Wang H, Williams HC, Woolf AD, Lopez AD, Davis A: UK health performance: Findings of the global burden of disease study 2010. Lancet 2013;381:997–1020 [DOI] [PubMed] [Google Scholar]
- 6.Lim SS, Vos T, Flaxman AD, Danaei G, Shibuya K, Adair-Rohani H, Amann M, Anderson HR, Andrews KG, Aryee M, Atkinson C, Bacchus LJ, Bahalim AN, Balakrishnan K, Balmes J, Barker-Collo S, Baxter A, Bell ML, Blore JD, Blyth F, Bonner C, Borges G, Bourne R, Boussinesq M, Brauer M, Brooks P, Bruce NG, Brunekreef B, Bryan-Hancock C, Bucello C, Buchbinder R, Bull F, Burnett RT, Byers TE, Calabria B, Carapetis J, Carnahan E, Chafe Z, Charlson F, Chen H, Chen JS, Cheng AT, Child JC, Cohen A, Colson KE, Cowie BC, Darby S, Darling S, Davis A, Degenhardt L, Dentener F, Des Jarlais DC, Devries K, Dherani M, Ding EL, Dorsey ER, Driscoll T, Edmond K, Ali SE, Engell RE, Erwin PJ, Fahimi S, Falder G, Farzadfar F, Ferrari A, Finucane MM, Flaxman S, Fowkes FG, Freedman G, Freeman MK, Gakidou E, Ghosh S, Giovannucci E, Gmel G, Graham K, Grainger R, Grant B, Gunnell D, Gutierrez HR, Hall W, Hoek HW, Hogan A, Hosgood HD 3rd, Hoy D, Hu H, Hubbell BJ, Hutchings SJ, Ibeanusi SE, Jacklyn GL, Jasrasaria R, Jonas JB, Kan H, Kanis JA, Kassebaum N, Kawakami N, Khang YH, Khatibzadeh S, Khoo JP, Kok C, Laden F, Lalloo R, Lan Q, Lathlean T, Leasher JL, Leigh J, Li Y, Lin JK, Lipshultz SE, London S, Lozano R, Lu Y, Mak J, Malekzadeh R, Mallinger L, Marcenes W, March L, Marks R, Martin R, McGale P, McGrath J, Mehta S, Mensah GA, Merriman TR, Micha R, Michaud C, Mishra V, Mohd Hanafiah K, Mokdad AA, Morawska L, Mozaffarian D, Murphy T, Naghavi M, Neal B, Nelson PK, Nolla JM, Norman R, Olives C, Omer SB, Orchard J, Osborne R, Ostro B, Page A, Pandey KD, Parry CD, Passmore E, Patra J, Pearce N, Pelizzari PM, Petzold M, Phillips MR, Pope D, Pope CA 3rd, Powles J, Rao M, Razavi H, Rehfuess EA, Rehm JT, Ritz B, Rivara FP, Roberts T, Robinson C, Rodriguez-Portales JA, Romieu I, Room R, Rosenfeld LC, Roy A, Rushton L, Salomon JA, Sampson U, Sanchez-Riera L, Sanman E, Sapkota A, Seedat S, Shi P, Shield K, Shivakoti R, Singh GM, Sleet DA, Smith E, Smith KR, Stapelberg NJ, Steenland K, Stockl H, Stovner LJ, Straif K, Straney L, Thurston GD, Tran JH, Van Dingenen R, van Donkelaar A, Veerman JL, Vijayakumar L, Weintraub R, Weissman MM, White RA, Whiteford H, Wiersma ST, Wilkinson JD, Williams HC, Williams W, Wilson N, Woolf AD, Yip P, Zielinski JM, Lopez AD, Murray CJ, Ezzati M, AlMazroa MA, Memish ZA: A comparative risk assessment of burden of disease and injury attributable to 67 risk factors and risk factor clusters in 21 regions, 1990–2010: A systematic analysis for the global burden of disease study 2010. Lancet 2012;380:2224–2260 [DOI] [PMC free article] [PubMed] [Google Scholar]
- 7.Kearney PM, Whelton M, Reynolds K, Muntner P, Whelton PK, He J: Global burden of hypertension: Analysis of worldwide data. Lancet 2005;365:217–223 [DOI] [PubMed] [Google Scholar]
- 8.Miura K, Nagai M, Ohkubo T: Epidemiology of hypertension in japan: Where are we now? Circ J 2013;77:2226–2231 [DOI] [PubMed] [Google Scholar]
- 9.Gillespie CD, Hurvitz KA, Centers for Disease C, Prevention: Prevalence of hypertension and controlled hypertension - united states, 2007–2010. MMWR Surveill Summ 2013;62 Suppl 3:144–148 [PubMed] [Google Scholar]
- 10.Van den Berg N, Meinke-Franze C, Fiss T, Baumeister SE, Hoffmann W: Prevalence and determinants of controlled hypertension in a german population cohort. BMC Public Health 2013;13:594. [DOI] [PMC free article] [PubMed] [Google Scholar]
- 11.Australia National Heart Foundation. Guide to management of hypertension. 2008.
- 12.Blacher J, Halimi JM, Hanon O, Mourad JJ, Pathak A, Schnebert B, Girerd X, French Society of Hypertension: Management of hypertension in adults: The 2013 French Society of Hypertension guidelines. Fundam Clin Pharmacol 2014;28:1–9 [DOI] [PubMed] [Google Scholar]
- 13.Mancia G, Fagard R, Narkiewicz K, Redon J, Zanchetti A, Bohm M, Christiaens T, Cifkova R, De Backer G, Dominiczak A, Galderisi M, Grobbee DE, Jaarsma T, Kirchhof P, Kjeldsen SE, Laurent S, Manolis AJ, Nilsson PM, Ruilope LM, Schmieder RE, Sirnes PA, Sleight P, Viigimaa M, Waeber B, Zannad F, Redon J, Dominiczak A, Narkiewicz K, Nilsson PM, Burnier M, Viigimaa M, Ambrosioni E, Caufield M, Coca A, Olsen MH, Schmieder RE, Tsioufis C, van de Borne P, Zamorano JL, Achenbach S, Baumgartner H, Bax JJ, Bueno H, Dean V, Deaton C, Erol C, Fagard R, Ferrari R, Hasdai D, Hoes AW, Kirchhof P, Knuuti J, Kolh P, Lancellotti P, Linhart A, Nihoyannopoulos P, Piepoli MF, Ponikowski P, Sirnes PA, Tamargo JL, Tendera M, Torbicki A, Wijns W, Windecker S, Clement DL, Coca A, Gillebert TC, Tendera M, Rosei EA, Ambrosioni E, Anker SD, Bauersachs J, Hitij JB, Caulfield M, De Buyzere M, De Geest S, Derumeaux GA, Erdine S, Farsang C, Funck-Brentano C, Gerc V, Germano G, Gielen S, Haller H, Hoes AW, Jordan J, Kahan T, Komajda M, Lovic D, Mahrholdt H, Olsen MH, Ostergren J, Parati G, Perk J, Polonia J, Popescu BA, Reiner Z, Ryden L, Sirenko Y, Stanton A, Struijker-Boudier H, Tsioufis C, van de Borne P, Vlachopoulos C, Volpe M, Wood DA: 2013 ESH/ESC guidelines for the management of arterial hypertension: The Task Force for the Management of Arterial Hypertension of the European Society of Hypertension (ESH) and of the European Society of Cardiology (ESC). Eur Heart J 2013;34:2159–2219 [DOI] [PubMed] [Google Scholar]
- 14.Shimamoto K, Ando K, Fujita T, Hasebe N, Higaki J, Horiuchi M, Imai Y, Imaizumi T, Ishimitsu T, Ito M, Ito S, Itoh H, Iwao H, Kai H, Kario K, Kashihara N, Kawano Y, Kim-Mitsuyama S, Kimura G, Kohara K, Komuro I, Kumagai H, Matsuura H, Miura K, Morishita R, Naruse M, Node K, Ohya Y, Rakugi H, Saito I, Saitoh S, Shimada K, Shimosawa T, Suzuki H, Tamura K, Tanahashi N, Tsuchihashi T, Uchiyama M, Ueda S, Umemura S, Japanese Society of Hypertension Committee for Guidelines for the Management of Hypertension: The Japanese Society of Hypertension Guidelines for the Management of Hypertension (JSH 2014). Hypertens Res 2014;37:253–390 [DOI] [PubMed] [Google Scholar]
- 15.Liu L, Ikeda K, Sullivan DH, Ling W, Yamori Y. Epidemiological evidence of the association between dietary protein intake and blood pressure: A meta-analysis of published data. Hypertension Res 2002;25:689–695 [DOI] [PubMed] [Google Scholar]
- 16.Eckel RH, Jakicic JM, Ard JD, de Jesus JM, Houston Miller N, Hubbard VS, Lee IM, Lichtenstein AH, Loria CM, Millen BE, Nonas CA, Sacks FM, Smith SC Jr., Svetkey LP, Wadden TA, Yanovski SZ, American College of Cardiology/American Heart Association Task Force on Practice Group: 013 AHA/ACC guideline on lifestyle management to reduce cardiovascular risk: a report of the American College of Cardiology/American Heart Association Task Force on Practice Guidelines. J Am Coll Cardiol 2014;63:2960–2984 [DOI] [PubMed] [Google Scholar]
- 17.James PA, Oparil S, Carter BL, Cushman WC, Dennison-Himmelfarb C, Handler J, Lackland DT, LeFevre ML, MacKenzie TD, Ogedegbe O, Smith SC Jr., Svetkey LP, Taler SJ, Townsend RR, Wright JT Jr., Narva AS, Ortiz E: 2014 evidence-based guideline for the management of high blood pressure in adults: report from the panel members appointed to the Eighth Joint National Committee (JNC 8). JAMA 2014;311:507–520 [DOI] [PubMed] [Google Scholar]
- 18.Appel LJ, Moore TJ, Obarzanek E, Vollmer WM, Svetkey LP, Sacks FM, Bray GA, Vogt TM, Cutler JA, Windhauser MM, Lin PH, Karanja N. A clinical trial of the effects of dietary patterns on blood pressure. Dash Collaborative Research Group. N Engl J Med 1997;336:1117–1124 [DOI] [PubMed] [Google Scholar]
- 19.The INTERSALT co-operative research group: Sodium, potassium, body mass, alcohol and blood pressure: The INTERSALT Study. J Hypertens Suppl 1988;6:S584–586 [PubMed] [Google Scholar]
- 20.The INTERSALT co-operative research group: INTERSALT: An international study of electrolyte excretion and blood pressure. Results for 24 hour urinary sodium and potassium excretion. BMJ 1988;297:319–328 [DOI] [PMC free article] [PubMed] [Google Scholar]
- 21.Dyer AR, Elliott P: The INTERSALT Study: Relations of body mass index to blood pressure. Intersalt co-operative research group. J.Hum.Hypertens 1989;3:299–308 [PubMed] [Google Scholar]
- 22.Marmot MG, Elliott P, Shipley MJ, Dyer AR, Ueshima H, Beevers DG, Stamler R, Kesteloot H, Rose G, Stamler J: Alcohol and blood pressure: The INTERSALT Study. BMJ 1994;308:1263–1267 [DOI] [PMC free article] [PubMed] [Google Scholar]
- 23.The sixth report of the joint national committee on prevention, detection, evaluation, and treatment of high blood pressure. Arch Intern Med 1997;157:2413–2446 [DOI] [PubMed] [Google Scholar]
- 24.Cutler JA, Follmann D, Allender PS: Randomized trials of sodium reduction: An overview. Am J Clin Nutr 1997;65:643S–651S [DOI] [PubMed] [Google Scholar]
- 25.Stamler J, Caggiula AW, Grandits GA: Relation of body mass and alcohol, nutrient, fiber, and caffeine intakes to blood pressure in the special intervention and usual care groups in the multiple risk factor intervention trial. Am J Clin Nutr 1997;65:338S–365S [DOI] [PubMed] [Google Scholar]
- 26.Midgley JP, Matthew AG, Greenwood CM, Logan AG: Effect of reduced dietary sodium on blood pressure: A meta-analysis of randomized controlled trials. JAMA 1996;275:1590–1597 [DOI] [PubMed] [Google Scholar]
- 27.Stamler J, Elliott P, Dennis B, Dyer AR, Kesteloot H, Liu K, Ueshima H, Zhou BF for the INTERMAP Research Group: INTERMAP: Background, aims, design, methods, and descriptive statistics (nondietary). J Hum Hypertens 2003;17:591–608 [DOI] [PMC free article] [PubMed] [Google Scholar]
- 28.Dennis B, Stamler J, Buzzard M, Conway R, Elliott P, Moag-Stahlberg A, Okayama A, Okuda N, Robertson C, Robinson F, Schakel S, Stevens M, Van HN, Zhao L, Zhou BF: INTERMAP: The dietary data--process and quality control. J Hum Hypertens 2003;17:609–622 [DOI] [PMC free article] [PubMed] [Google Scholar]
- 29.Kaspar H, Dettmer K, Chan Q, Daniels S, Nimkar S, Daviglus ML, Stamler J, Elliott P, Oefner PJ: Urinary amino acid analysis: A comparison of iTRAQ (R)-LC-MS/MS, GC-MS, and amino acid analyzer. Journal of Chromatography B-Analytical Technologies in the Biomedical and Life Sciences 2009;877:1838–1846 [DOI] [PMC free article] [PubMed] [Google Scholar]
- 30.Holmes E, Loo RL, Stamler J, Bictash M, Yap IKS, Chan Q, Ebbels T, De Iorio M, Brown IJ, Veselkov KA, Daviglus ML, Kesteloot H, Ueshima H, Zhao L, Nicholson JK, Elliott P: Human metabolic phenotype diversity and its association with diet and blood pressure. Nature 2008;453:396–U350 [DOI] [PMC free article] [PubMed] [Google Scholar]
- 31.Elliott P, Stamler J, Dyer AR, Appel L, Dennis B, Kesteloot H, Ueshima H, Okayama A, Chan Q, Garside DB, Zhou B: Association between protein intake and blood pressure: The intermap study. Arch Intern Med 2006;166:79–87 [DOI] [PMC free article] [PubMed] [Google Scholar]
- 32.Stamler J, Brown IJ, Daviglus ML, Chan Q, Kesteloot H, Ueshima H, Zhao L, Elliott P for the INTERMAP Research Group: Glutamic acid, the main dietary amino acid, and blood pressure: The INTERMAP study (international collaborative study of macronutrients, micronutrients and blood pressure). Circulation 2009;120:221–228 [DOI] [PMC free article] [PubMed] [Google Scholar]
- 33.Aljuraiban GS, Griep LM, Chan Q, Daviglus ML, Stamler J, Van Horn L, Elliott P, Frost GS: Total, insoluble and soluble dietary fibre intake in relation to blood pressure: The intermap study. Br J Nutr 2015:1–7 [DOI] [PMC free article] [PubMed]
- 34.Miura K, Stamler J, Nakagawa H, Elliott P, Ueshima H, Chan Q, Brown IJ, Tzoulaki I, Saitoh S, Dyer AR, Daviglus ML, Kesteloot H, Okayama A, Curb JD, Rodriguez BL, Elmer PJ, Steffen LM, Robertson C, Zhao L, Elliott P for the INTERMAP Research Group: Relationship of dietary linoleic acid to blood pressure - the international study of macro-micronutrients and blood pressure study. Hypertension 2008;52:408–414 [DOI] [PMC free article] [PubMed] [Google Scholar]
- 35.Miura K, Stamler J, Brown IJ, Ueshima H, Nakagawa H, Sakurai M, Chan Q, Appel LJ, Okayama A, Okuda N, Curb JD, Rodriguez BL, Robertson C, Zhao L, Elliott P for the INTERMAP Research Group: Relationship of dietary monounsaturated fatty acids to blood pressure: The international study of macro/micronutrients and blood pressure. J Hypertens 2013;31:1144–1150 [DOI] [PMC free article] [PubMed] [Google Scholar]
- 36.Ueshima H, Stamler J, Elliott P, Chan Q, Brown IJ, Carnethon MR, Daviglus ML, He K, Moag-Stahlberg A, Rodriguez BL, Steffen LM, Van Horn L, Yarnell J, Zhou B: Food omega-3 fatty acid intake of individuals (total, linolenic acid, long-chain) and their blood pressure INTERMAP study. Hypertension 2007;50:313–319 [DOI] [PMC free article] [PubMed] [Google Scholar]
- 37.Elliott P, Kesteloot H, Appel LJ, Dyer AR, Ueshima H, Chan Q, Brown IJ, Zhao L, Stamler J for the INTERMAP Research Group: Dietary phosphorus and blood pressure: International study of macro- and micro-nutrients and blood pressure. Hypertension 2008;51:669–675 [DOI] [PMC free article] [PubMed] [Google Scholar]
- 38.Tzoulaki I, Brown IJ, Chan Q, Van Horn L, Ueshima H, Zhao L, Stamler J, Elliott P for the International Collaborative Research Group on Macro-/Micronutrients and Blood Pressure: Relation of iron and red meat intake to blood pressure: Cross sectional epidemiological study. BMJ 2008;337 [DOI] [PMC free article] [PubMed] [Google Scholar]
- 39.Brown IJ, Elliott P, Robertson CE, Chan Q, Daviglus ML, Dyer AR, Huang CC, Rodriguez BL, Sakata K, Ueshima H, Van HL, Zhao L, Stamler J: Dietary starch intake of individuals and their blood pressure: The international study of macronutrients and micronutrients and blood pressure. J.Hypertens 2009;27:231–236 [DOI] [PMC free article] [PubMed] [Google Scholar]
- 40.Brown IJ, Stamler J, Van Horn L, Robertson CE, Chan Q, Dyer AR, Huang CC, Rodriguez BL, Zhao L, Daviglus ML, Ueshima H, Elliott P, International Study of Macro/Micronutrients, Blood Pressure Research Group: Sugar-sweetened beverage, sugar intake of individuals, and their blood pressure: International Study of Macro/Micronutrients and Blood Pressure Research Group. Hypertension 2011;57:695–701 [DOI] [PMC free article] [PubMed] [Google Scholar]
- 41.Sakurai M, Stamler J, Miura K, Brown IJ, Nakagawa H, Elliott P, Ueshima H, Chan Q, Tzoulaki I, Dyer AR, Okayama A, Zhao L for the INTERMAP Research Group: Relationship of dietary cholesterol to blood pressure: The INTERMAP study. J Hypertens 2011;29:222–228 [DOI] [PMC free article] [PubMed] [Google Scholar]
- 42.Stamler J, Brown IJ, Daviglus ML, Chan Q, Miura K, Okuda N, Ueshima H, Zhao L, Elliott P: Dietary glycine and blood pressure: The international study on macro/micronutrients and blood pressure. Am J Clin Nutr 2013;98:136–145 [DOI] [PMC free article] [PubMed] [Google Scholar]
- 43.Altorf-van der Kuil W, Engberink MF, Brink EJ, van Baak MA, Bakker SJ, Navis G, van’t Veer P, Geleijnse JM: Dietary protein and blood pressure: A systematic review. PloS one 2010;5:e12102. [DOI] [PMC free article] [PubMed] [Google Scholar]
- 44.Rebholz CM, Friedman EE, Powers LJ, Arroyave WD, He J, Kelly TN: Dietary protein intake and blood pressure: A meta-analysis of randomized controlled trials. Am J Epidemiol 2012;176 Suppl 7:S27–43 [DOI] [PubMed] [Google Scholar]
- 45.Tielemans SM, Altorf-van der Kuil W, Engberink MF, Brink EJ, van Baak MA, Bakker SJ, Geleijnse JM: Intake of total protein, plant protein and animal protein in relation to blood pressure: A meta-analysis of observational and intervention studies. J Hum Hypertens 2013;27:564–571 [DOI] [PubMed] [Google Scholar]
- 46.Appel LJ, Miller ER 3rd, Seidler AJ, Whelton PK: Does supplementation of diet with ‘fish oil’ reduce blood pressure? A meta-analysis of controlled clinical trials. Arch Intern Med 1993;153:1429–1438 [PubMed] [Google Scholar]
- 47.Geleijnse JM, Giltay EJ, Grobbee DE, Donders AR, Kok FJ: Blood pressure response to fish oil supplementation: Metaregression analysis of randomized trials. J Hypertens 2002;20:1493–1499 [DOI] [PubMed] [Google Scholar]
- 48.Wendland E, Farmer A, Glasziou P, Neil A: Effect of alpha linolenic acid on cardiovascular risk markers: A systematic review. Heart 2006;92:166–169 [DOI] [PMC free article] [PubMed] [Google Scholar]
- 49.Alonso A, Ruiz-Gutierrez V, Martinez-Gonzalez MA: Monounsaturated fatty acids, olive oil and blood pressure: Epidemiological, clinical and experimental evidence. Public Health Nutr 2006;9:251–257 [DOI] [PubMed] [Google Scholar]
- 50.Nicklas TA, Hampl JS, Taylor CA, Thompson VJ, Heird WC: Monounsaturated fatty acid intake by children and adults: Temporal trends and demographic differences. Nutr Rev 2004;62:132–141 [DOI] [PubMed] [Google Scholar]
- 51.Schwingshackl L, Strasser B, Hoffmann G: Effects of monounsaturated fatty acids on cardiovascular risk factors: A systematic review and meta-analysis. Ann Nutr Metab 2011;59:176–186 [DOI] [PubMed] [Google Scholar]
- 52.Schwab U, Lauritzen L, Tholstrup T, Haldorssoni T, Riserus U, Uusitupa M, Becker W: Effect of the amount and type of dietary fat on cardiometabolic risk factors and risk of developing type 2 diabetes, cardiovascular diseases, and cancer: A systematic review. Food Nutr Res 2014;58 [DOI] [PMC free article] [PubMed] [Google Scholar]
- 53.Stamler J, Caggiula A, Grandits GA, Kjelsberg M, Cutler JA: Relationship to blood pressure of combinations of dietary macronutrients. Findings of the Multiple Risk Factor Intervention Trial (MRFIT). Circulation 1996;94:2417–2423 [DOI] [PubMed] [Google Scholar]
- 54.Shah M, Adams-Huet B, Garg A: Effect of high-carbohydrate or high-cis-monounsaturated fat diets on blood pressure: A meta-analysis of intervention trials. Am J Clin Nutr 2007;85:1251–1256 [DOI] [PubMed] [Google Scholar]
- 55.Ha V, Sievenpiper JL, de Souza RJ, Chiavaroli L, Wang DD, Cozma AI, Mirrahimi A, Yu ME, Carleton AJ, Dibuono M, Jenkins AL, Leiter LA, Wolever TM, Beyene J, Kendall CW, Jenkins DJ: Effect of fructose on blood pressure: A systematic review and meta-analysis of controlled feeding trials. Hypertension 2012;59:787–795 [DOI] [PubMed] [Google Scholar]
- 56.Kelishadi R, Mansourian M, Heidari-Beni M: Association of fructose consumption and components of metabolic syndrome in human studies: A systematic review and meta-analysis. Nutrition 2014;30:503–510 [DOI] [PubMed] [Google Scholar]
- 57.Te Morenga LA, Howatson AJ, Jones RM, Mann J: Dietary sugars and cardiometabolic risk: Systematic review and meta-analyses of randomized controlled trials of the effects on blood pressure and lipids. Am J Clin Nutr 2014;100:65–79 [DOI] [PubMed] [Google Scholar]
- 58.Whelton SP, Hyre AD, Pedersen B, Yi Y, Whelton PK, He J: Effect of dietary fiber intake on blood pressure: A meta-analysis of randomized, controlled clinical trials. J Hypertens 2005;23:475–481 [DOI] [PubMed] [Google Scholar]
- 59.Streppel MT, Arends LR, van ‘t Veer P, Grobbee DE, Geleijnse JM: Dietary fiber and blood pressure: A meta-analysis of randomized placebo-controlled trials. Arch Intern Med 2005;165:150–156 [DOI] [PubMed] [Google Scholar]
- 60.Evans CE, Greenwood DC, Threapleton DE, Cleghorn CL, Nykjaer C, Woodhead CE, Gale CP, Burley VJ: Effects of dietary fibre type on blood pressure: A systematic review and meta-analysis of randomized controlled trials of healthy individuals. J Hypertens 2015;33:897–911 [DOI] [PubMed] [Google Scholar]
- 61.Alonso A, Nettleton JA, Ix JH, de Boer IH, Folsom AR, Bidulescu A, Kestenbaum BR, Chambless LE, Jacobs DR Jr, : Dietary phosphorus, blood pressure, and incidence of hypertension in the atherosclerosis risk in communities study and the multi-ethnic study of atherosclerosis. Hypertension 2010;55:776–784 [DOI] [PMC free article] [PubMed] [Google Scholar]
- 62.Allender PS, Cutler JA, Follmann D, Cappuccio FP, Pryer J, Elliott P: Dietary calcium and blood pressure: A meta-analysis of randomized clinical trials. Ann Intern Med 1996;124:825–831 [DOI] [PubMed] [Google Scholar]
- 63.Griffith LE, Guyatt GH, Cook RJ, Bucher HC, Cook DJ: The influence of dietary and nondietary calcium supplementation on blood pressure: An updated metaanalysis of randomized controlled trials. Am J Hypertens 1999;12:84–92 [DOI] [PubMed] [Google Scholar]
- 64.van Mierlo LA, Arends LR, Streppel MT, Zeegers MP, Kok FJ, Grobbee DE, Geleijnse JM. Blood pressure response to calcium supplementation: A meta-analysis of randomized controlled trials. J Hum Hypertens 2006;20:571–580 [DOI] [PubMed] [Google Scholar]
- 65.Dickinson HO, Nicolson DJ, Cook JV, Campbell F, Beyer FR, Ford GA, Mason J: Calcium supplementation for the management of primary hypertension in adults. Cochrane Database Syst Rev 2006:CD004639. [DOI] [PubMed]
- 66.Mizushima S, Cappuccio FP, Nichols R, Elliott P: Dietary magnesium intake and blood pressure: A qualitative overview of the observational studies. J Hum Hypertens 1998;12:447–453 [DOI] [PubMed] [Google Scholar]
- 67.Jee SH, Miller ER 3rd, Guallar E, Singh VK, Appel LJ, Klag MJ: The effect of magnesium supplementation on blood pressure: A meta-analysis of randomized clinical trials. Am J Hypertens 2002;15:691–696 [DOI] [PubMed] [Google Scholar]
- 68.Dickinson HO, Nicolson DJ, Campbell F, Cook JV, Beyer FR, Ford GA, Mason J: Magnesium supplementation for the management of essential hypertension in adults. Cochrane Database Syst Rev 2006:CD004640. [DOI] [PubMed]
- 69.Dai Q, Shu XO, Deng X, Xiang YB, Li H, Yang G, Shrubsole MJ, Ji B, Cai H, Chow WH, Gao YT, Zheng W: Modifying effect of calcium/magnesium intake ratio and mortality: A population-based cohort study. BMJ open 2013;3 [DOI] [PMC free article] [PubMed] [Google Scholar]
- 70.Galan P, Vergnaud AC, Tzoulaki I, Buyck JF, Blacher J, Czernichow S, Hercberg S: Low total and nonheme iron intakes are associated with a greater risk of hypertension. J Nutr 2010;140:75–80 [DOI] [PubMed] [Google Scholar]
- 71.Munoz-Bravo C, Gutierrez-Bedmar M, Gomez-Aracena J, Garcia-Rodriguez A, Navajas JF: Iron: Protector or risk factor for cardiovascular disease? Still controversial. Nutrients 2013;5:2384–2404 [DOI] [PMC free article] [PubMed] [Google Scholar]
- 72.Fang X, An P, Wang H, Wang X, Shen X, Li X, Min J, Liu S, Wang F: Dietary intake of heme iron and risk of cardiovascular disease: A dose-response meta-analysis of prospective cohort studies. Nutr Metab Cardiovasc Dis 2015;25:24–35 [DOI] [PubMed] [Google Scholar]
- 73.Stamler J, Brown IJ, Elliott P, Daviglus ML, Dyer AR, Garside DB, Van HL, Appel LJ, Chan Q, Tzoulaki I, Kesteloot H, Miura K, Okuda N, Ueshima H, Zhao LC: Improved nutrition: Key to solving the populationwide blood pressure problem. In: Mancini M, Ordovas J, Riccardi G, Rubba P, Strazzullo P, eds. Nutritional and metabolic bases of cardiovascular disease Oxford, UK.: Wiley-Blackwell; 2011:303–324. [Google Scholar]
- 74.Tzoulaki I, Patel CJ, Okamura T, Chan Q, Brown IJ, Miura K, Ueshima H, Zhao L, Van Horn L, Daviglus ML, Stamler J, Butte AJ, Ioannidis JP, Elliott P: A nutrient-wide association study on blood pressure. Circulation 2012;126:2456–2464 [DOI] [PMC free article] [PubMed] [Google Scholar]
- 75.Svetkey LP, Sacks FM, Obarzanek E, Vollmer WM, Appel LJ, Lin PH, Karanja NM, Harsha DW, Bray GA, Aickin M, Proschan MA, Windhauser MM, Swain JF, McCarron PB, Rhodes DG, Laws RL: The dash diet, sodium intake and blood pressure trial (dash-sodium): Rationale and design. Dash-sodium collaborative research group. J Am Diet Assoc 1999;99:S96–104 [DOI] [PubMed] [Google Scholar]
- 76.Appel LJ, Sacks FM, Carey VJ, Obarzanek E, Swain JF, Miller ER III, Conlin PR, Erlinger TP, Rosner BA, Laranjo NM, Charleston J, McCarron P, Bishop LM. Effects of protein, monounsaturated fat, and carbohydrate intake on blood pressure and serum lipids: Results of the omniheart randomized trial. JAMA 2005;294:2455–2464 [DOI] [PubMed] [Google Scholar]
- 77.Molitor J, Brown IJ, Chan Q, Papathomas M, Liverani S, Molitor N, Richardson S, Van Horn L, Daviglus ML, Dyer A, Stamler J, Elliott P for the INTERMAP Research Group: Blood pressure differences associated with Optimal Macronutrient Intake Trial for Heart Health (OMNIHEART)-like diet compared with a typical American Diet. Hypertension 2014;64:1198–1204 [DOI] [PMC free article] [PubMed] [Google Scholar]
- 78.Chan Q, Stamler J, Brown IJ, Daviglus ML, Van Horn L, Dyer AR, Oude Griep LM, Miura K, Ueshima H, Zhao L, Nicholson JK, Holmes E, Elliott P for the INTERMAP Research Group: Relation of raw and cooked vegetable consumption to blood pressure: The intermap study. J Hum Hypertens 2014;28:353–359 [DOI] [PMC free article] [PubMed] [Google Scholar]
- 79.Oude Griep LM, Stamler J, Chan Q, Van Horn L, Steffen LM, Miura K, Ueshima H, Okuda N, Zhao L, Daviglus ML, Elliott P for the INTERMAP Research Group: Association of raw fruit and fruit juice consumption with blood pressure: The intermap study. Am J Clin Nutr 2013;97:1083–1091 [DOI] [PMC free article] [PubMed] [Google Scholar]
- 80.He FJ, MacGregor GA: Salt and sugar: Their effects on blood pressure. Pflugers Arch 2015;467:577–586 [DOI] [PubMed] [Google Scholar]
- 81.Singh GM, Micha R, Khatibzadeh S, Lim S, Ezzati M, Mozaffarian D, Global Burden of Diseases Nutrition and Chronic Diseases Expert Group (NutriCoDE): Estimated global, regional, and national disease burdens related to sugar-sweetened beverage consumption in 2010. Circulation 2015;132:639–666 [DOI] [PMC free article] [PubMed] [Google Scholar]
- 82.Khan NA, Hemmelgarn B, Herman RJ, Bell CM, Mahon JL, Leiter LA, Rabkin SW, Hill MD, Padwal R, Touyz RM, Larochelle P, Feldman RD, Schiffrin EL, Campbell NR, Moe G, Prasad R, Arnold MO, Campbell TS, Milot A, Stone JA, Jones C, Ogilvie RI, Hamet P, Fodor G, Carruthers G, Burns KD, Ruzicka M, DeChamplain J, Pylypchuk G, Petrella R, Boulanger JM, Trudeau L, Hegele RA, Woo V, McFarlane P, Vallee M, Howlett J, Bacon SL, Lindsay P, Gilbert RE, Lewanczuk RZ, Tobe S, Canadian Hypertension Education Program: The 2009 canadian hypertension education program recommendations for the management of hypertension: Part 2--therapy. Can J Cardiol 2009;25:287–298 [DOI] [PMC free article] [PubMed] [Google Scholar]
- 83.Gupta R, Guptha S: Strategies for initial management of hypertension. Indian J Med Res 2010;132:531–542 [PMC free article] [PubMed] [Google Scholar]
- 84.Fung TT, Hu FB, Wu K, Chiuve SE, Fuchs CS, Giovannucci E: The mediterranean and dietary approaches to stop hypertension (dash) diets and colorectal cancer. Am J Clin Nutr 2010;92:1429–1435 [DOI] [PMC free article] [PubMed] [Google Scholar]
- 85.Fung TT, Hu FB, Hankinson SE, Willett WC, Holmes MD: Low-carbohydrate diets, dietary approaches to stop hypertension-style diets, and the risk of postmenopausal breast cancer. Am J Epidemiol 2011;174:652–660 [DOI] [PMC free article] [PubMed] [Google Scholar]
- 86.de Koning L, Chiuve SE, Fung TT, Willett WC, Rimm EB, Hu FB: Diet-quality scores and the risk of type 2 diabetes in men. Diabetes care 2011;34:1150–1156 [DOI] [PMC free article] [PubMed] [Google Scholar]
- 87.Estruch R, Ros E, Salas-Salvado J, Covas MI, Corella D, Aros F, Gomez-Gracia E, Ruiz-Gutierrez V, Fiol M, Lapetra J, Lamuela-Raventos RM, Serra-Majem L, Pinto X, Basora J, Munoz MA, Sorli JV, Martinez JA, Martinez-Gonzalez MA: Primary prevention of cardiovascular disease with a mediterranean diet. N Engl J Med 2013;368:1279–1290 [DOI] [PubMed] [Google Scholar]
- 88.Willett WC, Sacks F, Trichopoulou A, Drescher G, Ferro-Luzzi A, Helsing E, Trichopoulos D: Mediterranean diet pyramid: A cultural model for healthy eating. Am J Clin Nutr 1995;61:1402S–1406S [DOI] [PubMed] [Google Scholar]
- 89.Keys A: Coronary heart disease--the global picture. Atherosclerosis 1975;22:149–192 [DOI] [PubMed] [Google Scholar]
- 90.Martinez-Gonzalez MA, Bes-Rastrollo M, Serra-Majem L, Lairon D, Estruch R, Trichopoulou A: Mediterranean food pattern and the primary prevention of chronic disease: Recent developments. Nutr Rev 2009;67 Suppl 1:S111–116 [DOI] [PubMed] [Google Scholar]
- 91.Kastorini CM, Milionis HJ, Esposito K, Giugliano D, Goudevenos JA, Panagiotakos DB: The effect of mediterranean diet on metabolic syndrome and its components: A meta-analysis of 50 studies and 534,906 individuals. J Am Coll Cardiol 2011;57:1299–1313 [DOI] [PubMed] [Google Scholar]
- 92.McGrane MM, Essery E, Obbagy J, Lyon J, Macneil P, Spahn J, Van Horn L: Dairy consumption, blood pressure, and risk of hypertension: An evidence-based review of recent literature. Curr Cardiovasc Risk Rep 2011;5:287–298 [DOI] [PMC free article] [PubMed] [Google Scholar]
- 93.Weber MA, Schiffrin EL, White WB, Mann S, Lindholm LH, Kenerson JG, Flack JM, Carter BL, Materson BJ, Ram CV, Cohen DL, Cadet JC, Jean-Charles RR, Taler S, Kountz D, Townsend RR, Chalmers J, Ramirez AJ, Bakris GL, Wang J, Schutte AE, Bisognano JD, Touyz RM, Sica D, Harrap SB: Clinical practice guidelines for the management of hypertension in the community: A statement by the American Society of Hypertension and the International Society of Hypertension. Clin Hypertens (Greenwich) 2014;16:14–26 [DOI] [PMC free article] [PubMed] [Google Scholar]
- 94.Wang D, He Y, Li Y, Luan D, Yang X, Zhai F, Ma G: Dietary patterns and hypertension among Chinese adults: A nationally representative cross-sectional study. BMC Public Health 2011;11:925. [DOI] [PMC free article] [PubMed] [Google Scholar]
- 95.Kim H, Song HJ, Han HR, Kim KB, Kim MT: Translation and validation of the dietary approaches to stop hypertension for koreans intervention: Culturally tailored dietary guidelines for korean americans with high blood pressure. J Cardiovasc Nurs 2013;28:514–523 [DOI] [PMC free article] [PubMed] [Google Scholar]