Abstract
The Liver Imaging-Reporting and Data System (LI-RADS or LR) is a classification system for reading and reporting imaging studies in patients with high risk for hepatocellular carcinoma (HCC). One of its main goals is to improve communication between specialties, especially radiologists, hepatologists, surgeons, and pathologists. LI-RADS defines imaging features of the lesions and stratifies the risk of HCC into categories. It is the most comprehensive and highly specific system; however, its seeming complexity prevents many radiologists from using it in everyday practice. This article is a detailed review of the latest version of LI-RADS (v. 2017), which should be helpful for radiologists who are not very familiar with the system and its latest update.
Keywords: hepatocellular carcinoma, HCC, LI-RADS, liver imaging
Introduction
The Liver Imaging-Reporting and Data System (LI-RADS or LR) is a system created to standardise reading and reporting of CT and MR studies for hepatocellular carcinoma (HCC). The system has been designed by a committee consisting of diagnostic and interventional radiologists, surgeons, hepatologists, and pathologists and is supported by the American College of Radiology (ACR) [1].
There have been many attempts [2] to standardise diagnosis and management of HCC over the last 15 years (Table 1). LI-RADS was designed to add more shades of grey to existing systems and to create a comprehensive system that can be used by any radiologist. The result should give the highest possible specificity for HCC because the LR-5 category is supposed to be a guarantee that a lesion is HCC and intervention can be done based solely on the imaging report. The studies published so far have reported very good sensitivity and specificity of LI-RADS for HCC diagnosis [3-5]. The CT/MRI LI-RADS v2017 classification applies to multiphase CT and MR examinations only. The system can guide a radiologist through the reading and reporting process. The result should be uniform for any radiologist in the world and easily understood by any physician involved in HCC diagnosis and treatment.
Table 1.
Popular guidelines for imaging diagnosis of hepatocellular carcinoma (HCC)
|
AASLD and EASL – for patients at risk for HCC being in an ultrasound surveillance program. Meant to be used by radiologists with expertise in liver imaging. OPTN – used for eligibility for liver transplantation based on CT and MRI criteria, meant to be used by radiologists in liver transplantation centres. LI-RADS – for all patients at risk for HCC, meant to be used by all radiologists. ESGAR – liver MR imaging guidelines including HCC diagnosis, but without management recommendations. |
LI-RADS does not offer definite management recommendations but it does give some suggestions. Above all, it is supposed to detect probable or definite HCC and leave the management options open.
There are three LI-RADS algorithms, and they all apply to high-risk patients:
Ultrasound LI-RADS uses unenhanced ultrasound for screening and surveillance for HCC in high-risk patients.
CEUS LI-RADS uses contrast-enhanced ultrasound (CEUS) for diagnosis of HCC.
CT/MRI LI-RADS uses multiphase CT and MR examinations for diagnosis of HCC and for treatment response assessment. For the purpose of this article the CT/MRI LI-RADS® v2017 algorithm will be referred to as LI-RADS.
The first version of LI-RADS was released in 2011, and since then there have been changes in every version, including the most recent one from 2017 (Figure 1).
Figure 1.
LI-RADS CT/MRI algorithm (https://www.acr.org/Quality-Safety/Resources/LIRADS/LIRADS-v2017)
Many changes were introduced in the 2017 version of LI-RADS including a new algorithm (Treatment Response Assessment), new and revised categories (LR-NC and LR-TIV), new threshold growth definition, modifications of ancillary features, and clarification on how to use many other features of the system. The next update is expected to be released in 2020 or 2021, and it should include a Path category for pathologically proven HCCs.
The aim of this article is to show how to use CT/MRI LI-RADS in everyday practice.
LI-RADS can be applied to CT or MR examinations in patients with high risk of HCC. The risk factors are: cirrhosis OR chronic HBV infection OR diagnosed HCC now or in the past.
The following patients are excluded from LI-RADS classification:
no risk factors,
< 18 years old,
with cirrhosis due to congenital hepatic fibrosis and vascular disorders such as hereditary haemorrhagic telangiectasia, Budd-Chiari syndrome, chronic portal vein occlusion, cardiac congestion, or diffuse nodular regenerative hyperplasia.
The rationale behind this is that in paediatric patients or in patients with the above conditions there can be many false positives and the positive predictive value may be too low.
Technique
LI-RADS v2017 does not suggest any particular contrast agent; however, there are technical recommendations on modalities and contrast media used in the imaging studies. Arterial phase, portal venous phase, and delayed venous phase (or transitional phase with gadoxetate disodium [Gd-EOB-DTPA]) are required. Pre-contrast phase is suggested. Late arterial phase is strongly preferred over early arterial phase because some HCCs hyperenhance only in the late arterial phase [6,7]. Post-contrast phases with liver appearances are listed in Table 2.
Table 2.
Liver appearance in specific phases after contrast injection
| Phase | Time after contrast injection | Appearance of liver parenchyma and vessels |
|---|---|---|
| Early arterial phase | 15-25 s | Portal vein is not enhanced. |
| Late arterial phase | 30-40 s | Portal vein is enhanced, hepatic veins are not yet enhanced. |
| Portal venous phase (PVP) | 70-80 s | Portal veins and liver parenchyma are fully enhanced and hepatic veins already get antegrade flow. |
| Delayed phase – obtained with extracellular contrast agents or gadobenate dimeglumine (Gd-BOPTA) | 2-5 min | Portal and hepatic veins as well as (usually) liver parenchyma enhancing less than in PVP. |
| Transitional phase – obtained with gadoxetate disodium (Gd-EOB-DTPA) |
2-5 min | Similar enhancement of liver vessels and parenchyma (overlap of extracellular and intracellular effect of Gd-EOB-DTPA). |
| Hepatobiliary phase | 20 min after Gd-EOB-DTPA; 1-3 hours after Gd-BOPTA | Contrast is visible in biliary tree and liver vessels are hypointense compared to liver parenchyma. |
Reporting
The term “observation” rather than “lesion” or “nodule” is preferred because not all suspicious findings are actual lesions in follow-up. This is supposed to exclude pseudo- lesions.
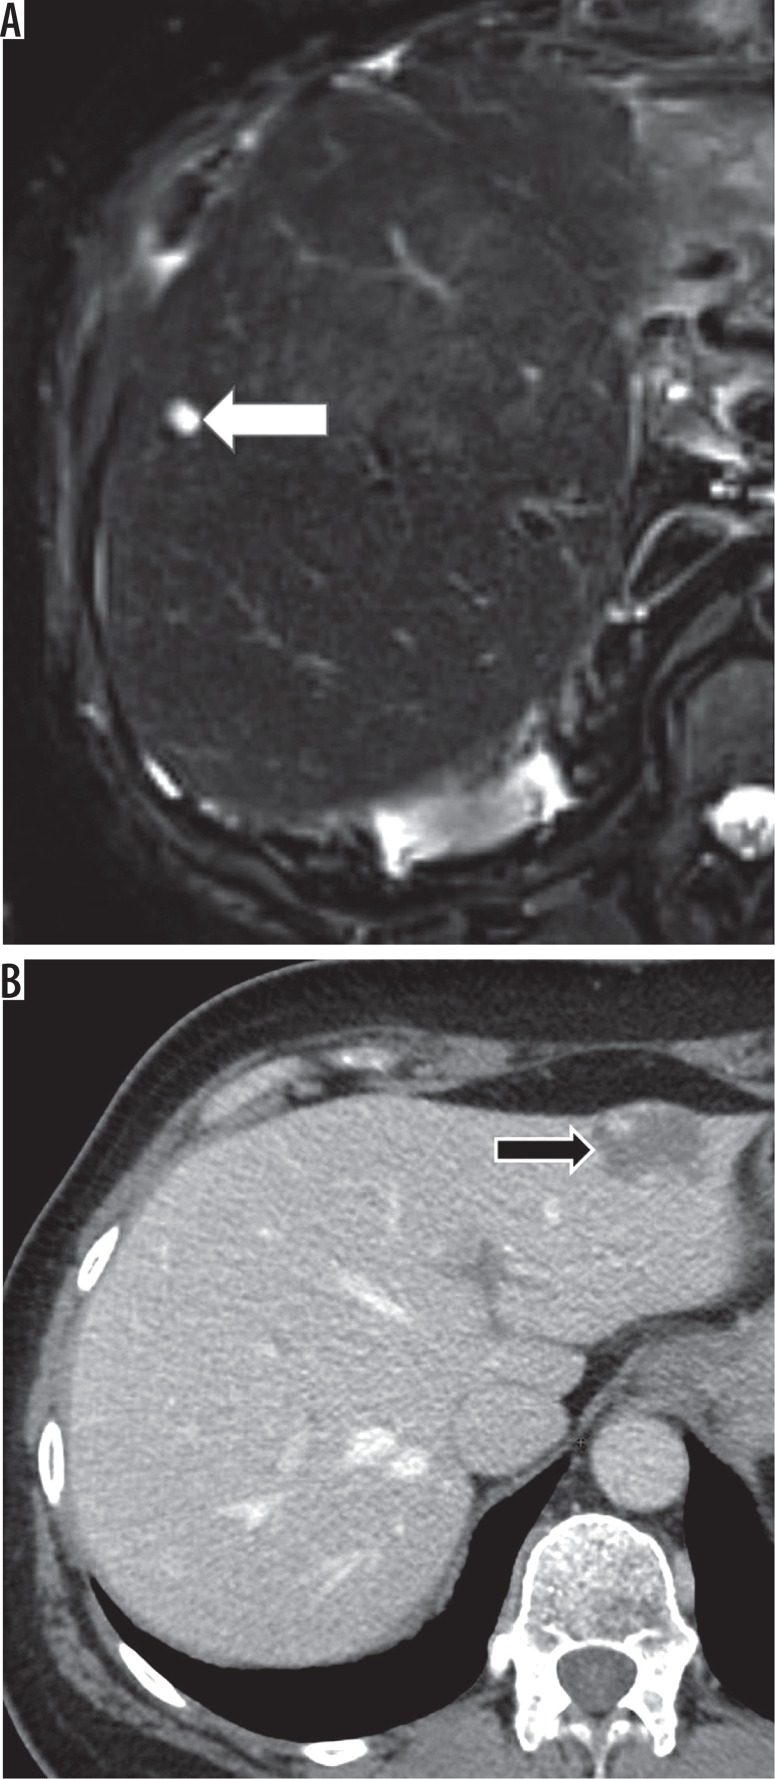
According to the guidelines, LR-1 entities that are definitely benign (Figures 2A-B) and LR-2 that causes no diagnostic confusion have no clinical relevance and therefore should be reported in aggregate unless they were suspicious in the previous examinations (then a rationale for this downgrade should be provided). Examples of LR-1 and LR-2 observations are listed in Table 3 and Table 4. All LR-3, LR-4, LR-5, LR-5V, and LR-M observations must be reported.
Figure 2.
LI-RADS 1 observations. A) T2-weighted image – simple cyst (white arrow). B) Contrast enhanced computed tomography – haemangioma (black arrow)
Table 3.
Examples of LI-RADS 1 observations
| LI-RADS 1 entities (examples) |
|---|
|
Definitely:
Cyst Haemangioma Vascular anomaly Perfusion alteration (e.g. arterioportal shunt) Hepatic fat deposition or sparing Hypertrophic pseudomass Confluent fibrosis or focal scar Observation that spontaneously disappears at follow-up |
Table 4.
Examples of LI-RADS 2 observations
| LI-RADS 2 entities (examples) |
|---|
|
Probably:
Cyst Haemangioma Vascular anomaly Perfusion alteration (e.g. arterioportal shunt) Hepatic fat deposition or sparing Hypertrophic pseudomass Confluent fibrosis or focal scar |
| Distinctive nodule without malignant features is a solid lesion < 2 cm, which does not have any major or ancillary features of malignancy. |
Lesions that have features of FNH or adenoma typically should be classified as LR-3 because the classification concerns patients with high risk of HCC.
Observations categorised as LR-3 have a similar probability of being benign and being HCC. They should be reported, and the clinician’s choice whether to proceed with further investigation, e.g. additional imaging or shorter follow-up, is clinically justified.
LR-4 observation is not 100% HCC, but this diagnosis is very likely, so the patient should probably have a biopsy, shorter follow-up (for example, 2-3 months), or correlation with laboratory results – all depending on practice and guidelines at a local institution.
LR-TIV – tumour in vein – should be reported with the most probable aetiology:
If tumour in vein is a continuation of an LR-5 lesion, then use the term “definitely due to HCC”. If it is associated with an LR-4 lesion or infiltrative mass, then use term “probably due to HCC”.
The lesions that are associated with targetoid mass should be reported as “may be due to non-HCC malignancy”. All other cases should be reported as “aetiology uncertain”. LR-M means a non-HCC malignancy seen as any targetoid mass or as a non-targetoid mass with at least one of the following features:
infiltrative appearance,
pronounced restriction of diffusion,
necrosis or severe ischaemia,
other features suggesting non-HCC malignancy (should be specified in the report).
The LR-M lesion should not meet LR-5 or LR-TIV criteria.
Targetoid or target-like appearance presents as concentric alignment of the lesion’s components; for example, rim of arterial enhancement or washout, delayed central enhancement or concentric pattern on diffusion weighted images (DWI), or hepatobiliary phase.
Any relevant change of the observation since prior studies should be reported.
Pathologically proven lesions should not have LI-RADS category assigned. The only exception is a benign lesion of hepatocellular origin, e.g. regenerative or dysplastic nodule, because it will help in future monitoring of the observation.
Categorisation
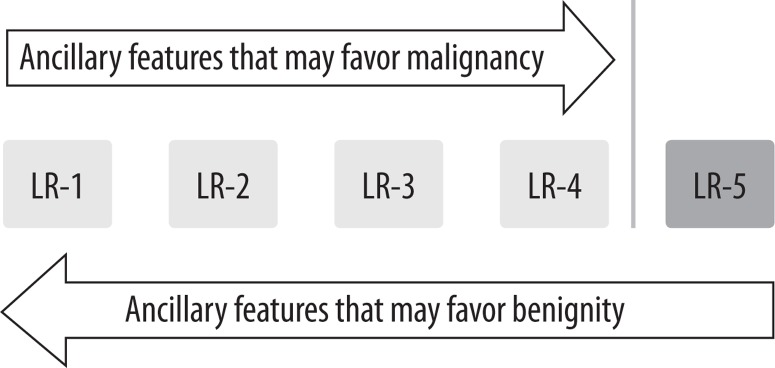
First apply major features (Figure 1). If uncertain about the category, apply ancillary features (Figure 3) to upgrade (up to – but not above – LR-4) or downgrade category. If still unsure, apply tie-breaking rules (Table 5). Generally, a category with lower level of certainty should be reported.
Figure 3.
Ancillary features of LI-RADS classification
Table 5.
Tie-breaking rules of LI-RADS classification
| Tie-breaking rules |
|---|
| LR-1 or LR-2 = LR-2 |
| LR-2 or LR-3 = LR-3 |
| LR-3 or LR-4 = LR-3 |
| LR-4 or LR-5 = LR-4 |
| LR-3 or LR-M = LR-3 |
| LR-4 or LR-M = LR-M |
| LR-5 or LR-M = LR-M |
STEP 1 – first apply the algorithm
In the first step the following categories should be excluded:
LR-NC – observation cannot be categorised due to poor quality or lack of images,
LR-1 – definitely benign,
LR-2 – probably benign,
LR-TIV – tumour in vein,
LR-M – probably or definitely malignant but not typical HCC.
If none of the abovementioned categories is appropriate, then apply the CT/MRI LI-RADS table (LIRADS-table.jpg). The table includes the following categories:
LR-3 – intermediate probability of malignancy,
LR-4 – probably HCC,
LR-5 – definitely HCC.
If unsure whether the feature is present, do not report it.
Categories
An observation classified as LI-RADS 1 is definitely benign based on benign features or disappearance in follow-up examination (examples in Table 3).
LI-RADS 2 category observations are probably benign since the features are suggestive but not diagnostic for benign lesions (examples in Table 4).
LI-RADS 3 category is for observations that do not meet criteria for other LI-RADS categories and have similar probability of being benign and malignant.
LI-RADS 4 category contains observations that are probably HCCs but imaging features are not diagnostic.
LI-RADS 5 category contains observations that are 100% proven HCCs based on their imaging features.
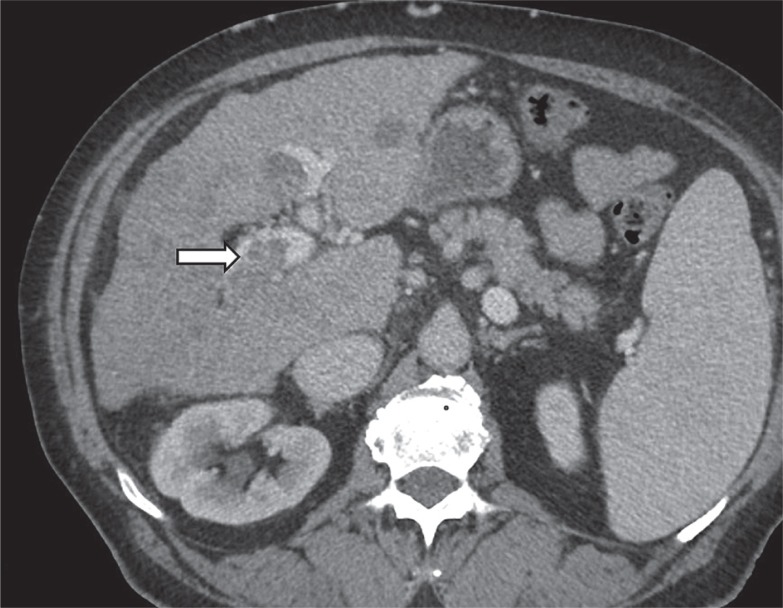
LI-RADS TIV category is for tumours that definitely invade a vein presenting as enhancing tissue expanding the vein (Figure 4). There are additional features that suggest tumour in vein and should prompt a more detailed examination of the vein in the search for enhancing soft tissue. The features include: occluded vein with ill-defined walls or restricted diffusion, occluded or obscured vein adjacent to malignant parenchymal mass, and heterogeneous vein enhancement that is not caused by artefact.
Figure 4.
Contrast enhanced computed tomography. Tumour tissue expanding right branch of portal vein (arrow)
LI-RADS 5G is for observations that have grown by > 50% within six months, which is an equivalent to OPTN 5A-g category.
LI-RADS 5US is for observations that present washout AND are visible on ultrasound (typically for patients in surveillance program, as in AASLD criteria).
LI-RADS M category is for malignant tumours other than HCC.
LI-RADS TR stands for loco-regionally treated tumour, e.g. transarterial chemoembolisation (TACE) or ablation.
Major features
Major features are used for categorisation of LR-3, LR-4,and LR-5 observations. They need to be unequivocally present to be considered in this classification.
Arterial phase hyperenhancement
HCCs can be roughly divided into early and progressed stages. Early HCCs are well differentiated and have minimal neo-arterialisation, which leads to poor or no enhancement in the arterial phase. Late (progressed) HCCs are poorly differentiated, have well developed new arterial vessels, and they hyperenhance in the arterial phase.
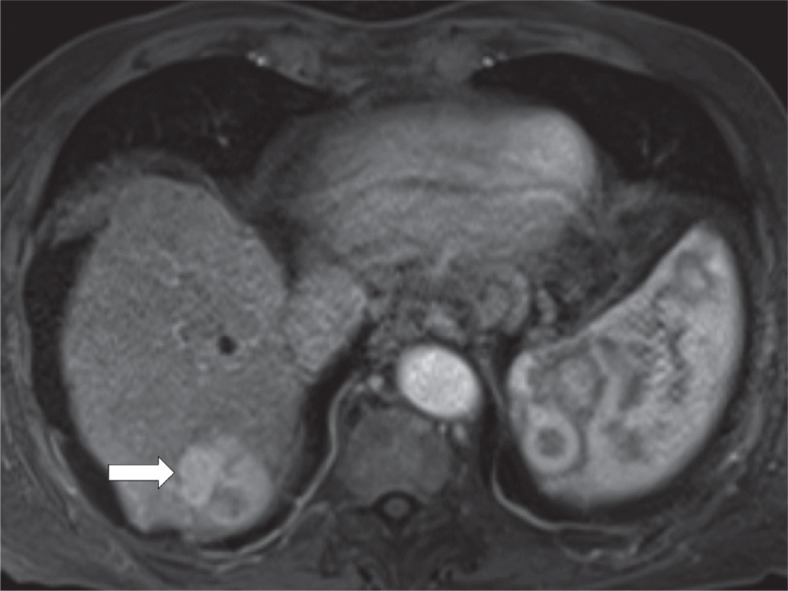
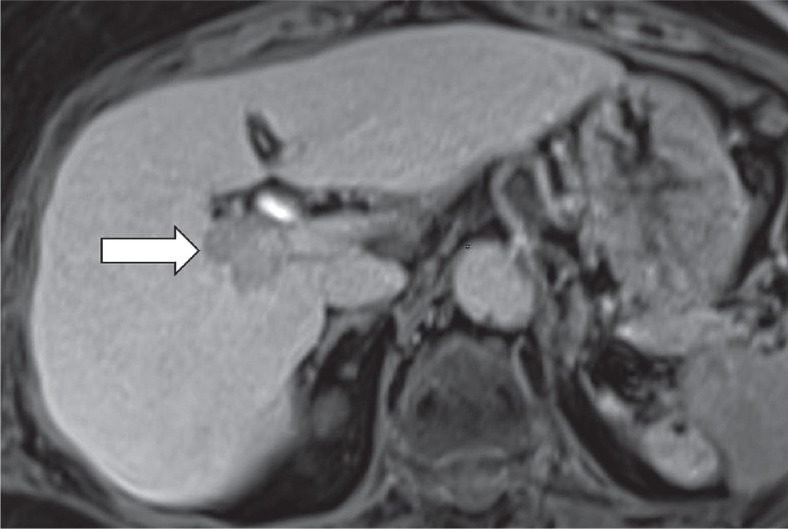
Arterial phase hyperenhancement is a major LI-RADS feature and describes observations that have higher attenuation than the rest of the liver (Figure 5). It applies to both whole and parts of observations. It should be assessed in the late arterial phase when arteries and portal veins are enhanced but before antegrade flow into hepatic veins. The rationale behind this is higher sensitivity of the late comparing to early arterial phase [7]. Arterial phase hyperenhancement is the essential feature for a lesion to be categorised as LR-5. Rim hyperenhancement in arterial phase is considered targetoid in appearance and is a feature of LR-M category.
Figure 5.
Contrast enhanced magnetic resonance imaging. Observation presenting arterial hyperenhancement (arrow)
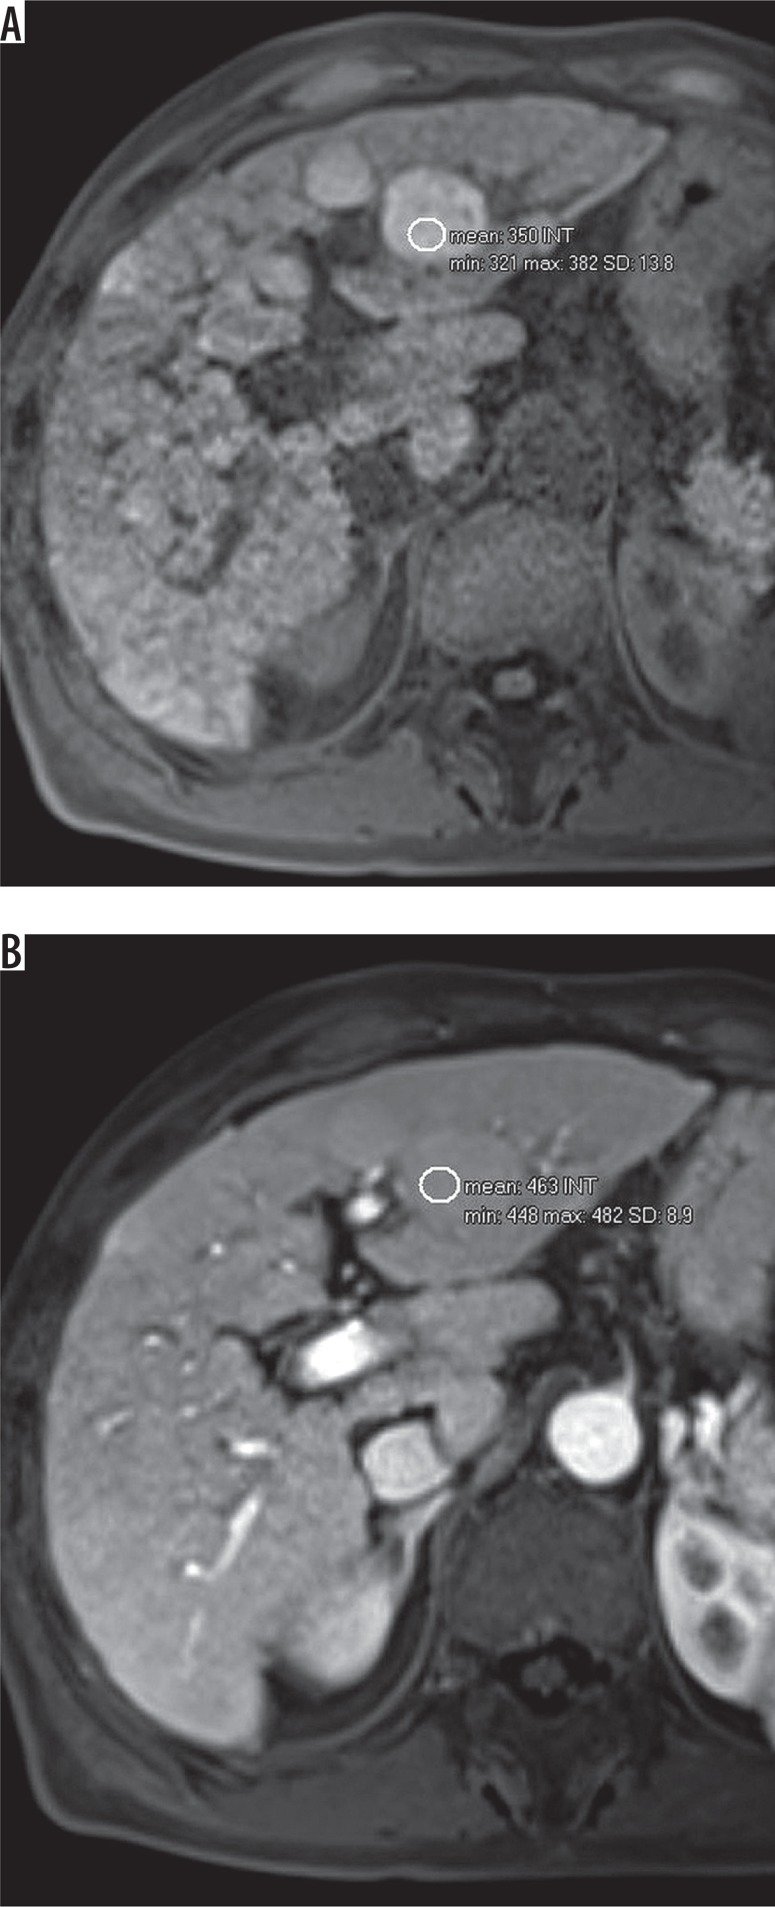
Arterial phase hypo- or isoenhancement includes observations that enhance less or the same as the rest of the liver. This applies to both whole and parts of observations. It does not apply to non-enhancing observations. Observations that show hypo- or isoenhancement should be categorised as LR-3 or LR-4 (depending on other features, e.g. diameter). Subtraction or region of interest (ROI) measurements can be used if the observation is hyperintense on pre-contrast T1-weighted images (Figures 6A-B).
Figure 6.
A) T1-weighted image with hyperintense observation. B) Signal intensity measurement with region of interest (ROI) shows enhancement of the lesion
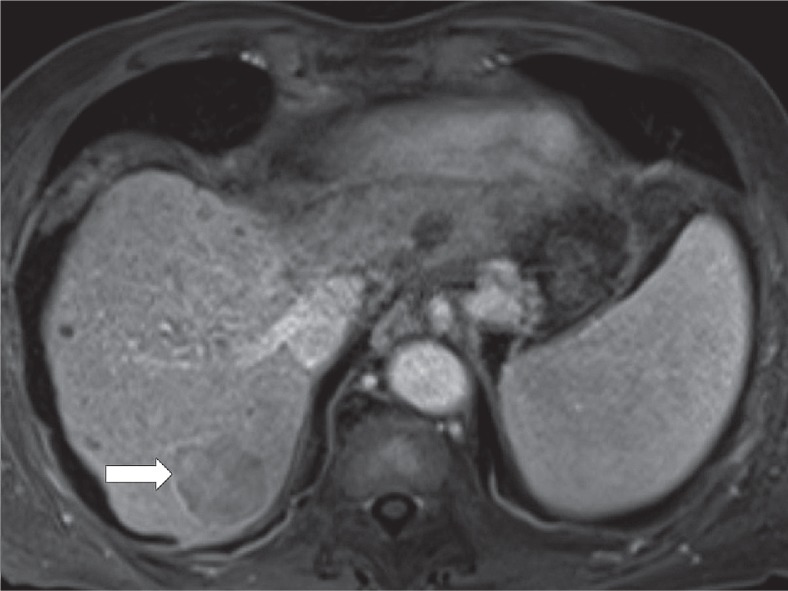
Washout appearance
It is defined as decreased enhancement of the observation or part of it, compared to the liver parenchyma surrounding the observation (Figure 7). It must be visible in portal venous phase or delayed venous phase. For Gd-EOB-DTPA it can be reported in portal venous phase only. It should not be mistaken for peripheral “washout”, which is a feature of LR-M category.
Figure 7.
Washout and capsule appearance (arrow) – delayed venous phase magnetic resonance imaging
Any enhancing observation can have washout appearance reported – arterial phase hyperenhancement is not required.
Washout appearance is assessed visually, but radiologists may use region of interest (ROI) measurements and subtraction at their discretion.
Capsule appearance
The term “capsule appearance” is preferred over “capsule” because the observation can sometimes represent pseudocapsule rather than true capsule. Capsule appearance means a rim of hyperenhancement (Figure 7) in portal, delayed, or transitional phase, which is unequivocally thicker than fibrotic tissue around background nodules.
It should not be mistaken for corona enhancement or nonenhancing capsule, which are ancillary features favouring, respectively, malignancy and particularly HCC.
Size
The observation’s size should be measured as the largest diameter including the capsule. The measurement should be made on the sequence where the observation’s border is distinct enough. Arterial phase and DWI should not be used for measurement if other sequences show the observation’s border. Perilesional enhancement in arterial phase and anatomic distortion on DWI make these sequences less reliable in terms of size measurement.
Threshold growth
It is defined as the increase of the diameter of the observation by at least 5 mm and one of the following:
≥ 50% increase in size within ≤ 6 months,
≥ 100% increase in size within > 6 months.
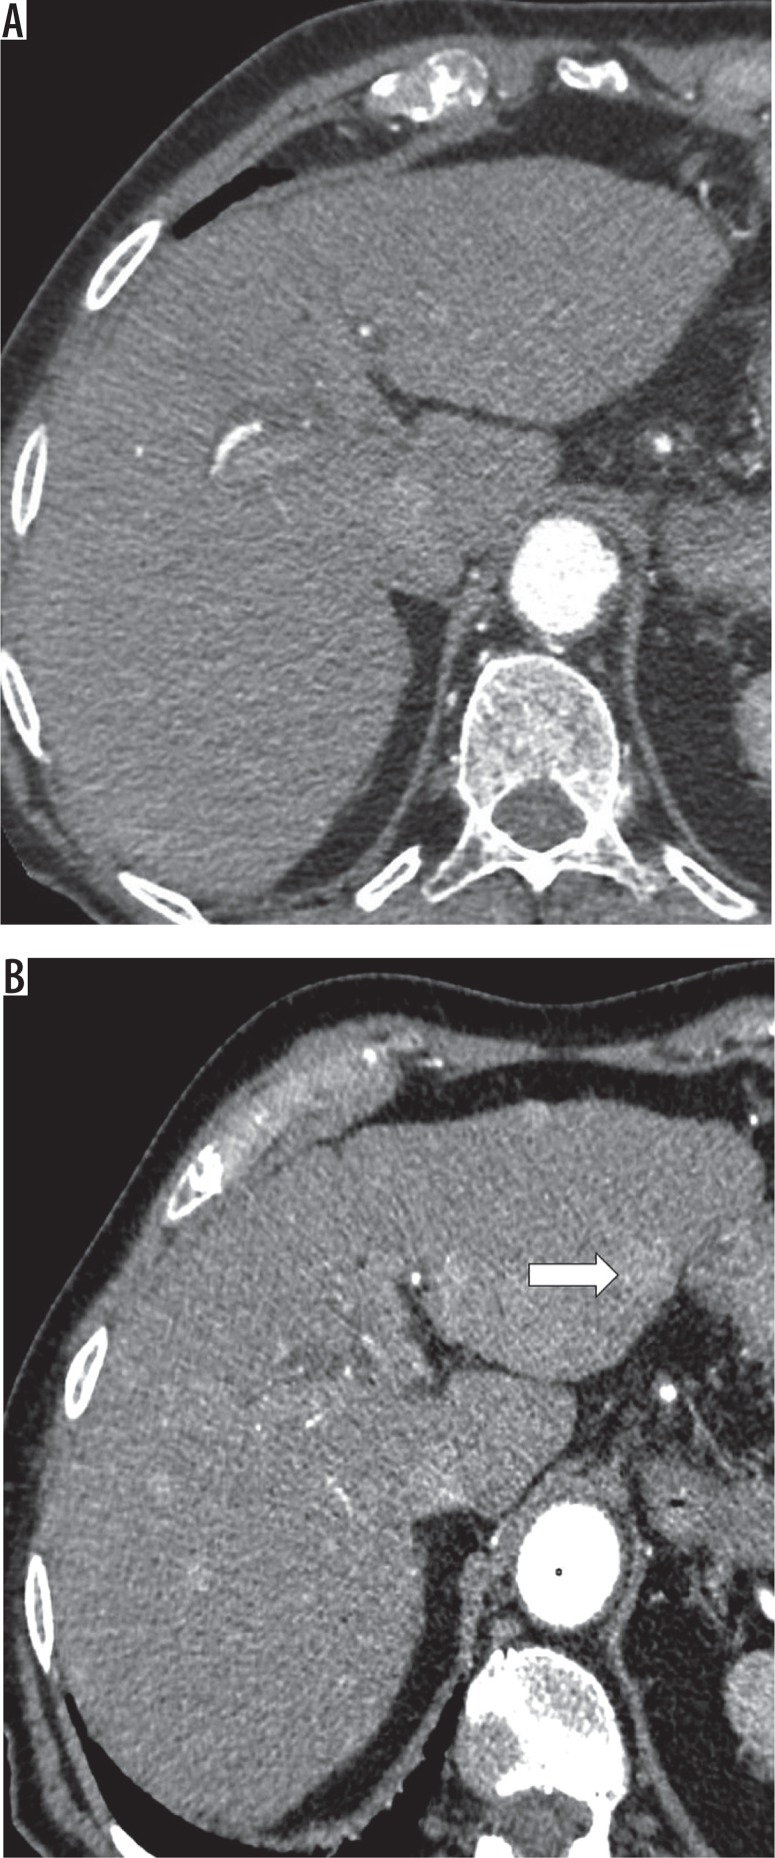
A new (not seen on CT or MRI in the previous two years) observation ≥ 10 mm also represents threshold growth (Figures 8A-B). The diameter should be assessed on images in the same plane and, if possible, acquired in the same phase / sequence with margins of the observation well defined.
Figure 8.
Contrast enhanced computed tomography (CT), arterial phase. A) No suspicious lesions on first CT. B) Several hyperenhancing observations on CT performed 7 months later, including one observation 12 mm in diameter in left lobe (white arrow)
Step 2 – if not sure, apply ancillary features
Application of ancillary features may be used at the radiologist’s discretion. Ancillary features can be used to downgrade or upgrade the category. However, they cannot be used to upgrade the category to LR-5. The absence of ancillary features cannot be used as a reason to upgrade or downgrade the category.
Ancillary features favouring malignancy (not necessary HCC)
Ultrasound visibility as discrete nodule
It refers to an observation detected on CT or MRI that is visible as a discrete nodule or a mass on unenhanced ultrasound.
Subthreshold growth
It is defined as a growth lower than the threshold (described above).
Corona enhancement
A zone of hyperenhancement around the observation visible in late arterial and early portal phases is called corona enhancement. It applies to masses that hyperenhance diffusely in the early arterial phase. Enhancement of the lesion later fades away while the perilesional rim of enhancement increases. It is a feature of late HCC and represents drainage of contrast from tumour to surrounding tissue.
Fat sparing in solid mass
It applies to observations that have less fat than the surrounding fatty liver or non-fatty fragment of observation in a steatotic nodule. It should be differentiated from hepatic fat sparing; in lesional fat sparing the observation is a mass that enhances differently than the rest of the liver.
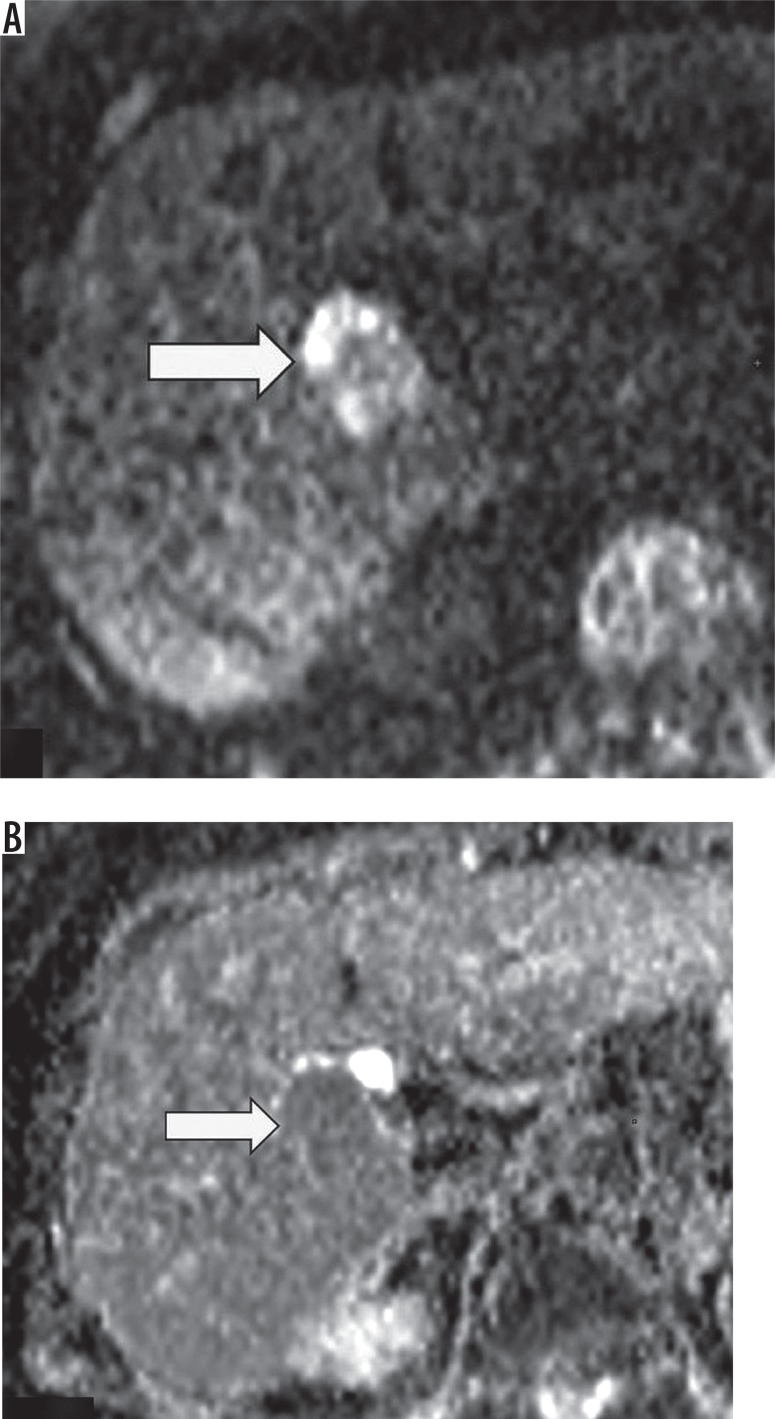
Restricted diffusion
High signal on DWI (with moderate and high β values, e.g. > 400 s/mm<sup>2</sup>) and/or low ADC map signal represent restricted diffusion, which is an ancillary feature favouring malignancy (Figures 9A-B). Intra-lesional fat, cirrhosis, and relative lack of increased cellularity (compared to metastases) may decrease its sensitivity.
Figure 9.
Observation presenting restriction of diffusion – high signal on diffusion weighted image (A) (arrow) with low signal on ADC map (B) (arrow)
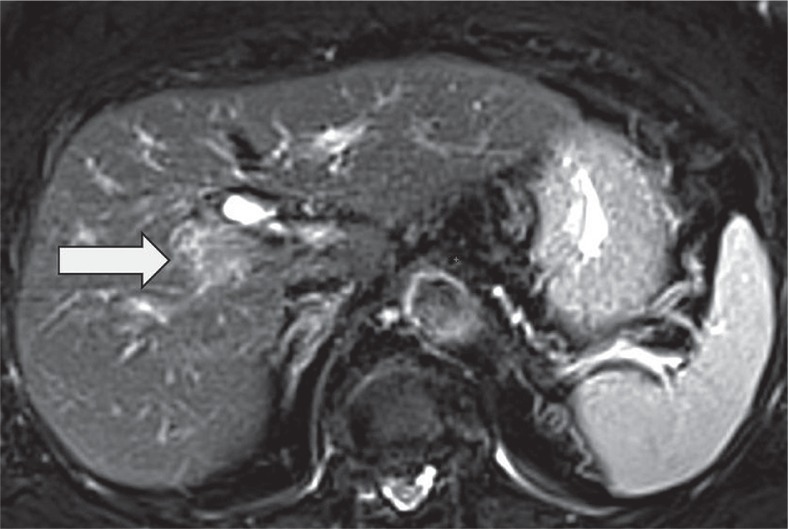
Mild–moderate T2 hyperintensity
It is defined as mildly to moderately higher signal of the observation compared to the rest of the liver (Figure 10). Infiltrative HCCs are often hyperintense on T2-weighted images, sometimes without arterial hyperenhancement. If unsure, do not report as mild-moderate T2 hyperintensity.
Figure 10.
Moderately hyperintense observation on T2-weighted image
Iron sparing in solid mass
It describes an observation with lower iron content than iron-overloaded liver parenchyma or in a fragment of otherwise siderotic lesion. On T2-weighted MR images it presents as increased intensity of the lesion relative to hypointense, iron-overloaded liver parenchyma. MRI is more sensitive than CT for the detection of iron overload nodules.
Transitional phase hypointensity
Transitional phase occurs after delayed venous phase but before hepatobiliary phase and applies only to Gd-EOB-DTPA. In this phase both intra- and extracellular components of the Gd-EOB-DTPA effect contribute to contrast enhancement. Hypoenhancement in this phase is an ancillary feature favouring malignancy. Transitional phase is typically acquired 2-5 minutes after injection of gadoxetate.
Hepatobiliary phase hypoenhancement
It is defined as lower attenuation than the rest of the liver in the hepatobiliary phase (Figure 11). It should not be mistaken for washout, which is a major feature. Washout should be assessed only in the extracellular phase (portal venous or delayed phase), before hepatobiliary contrast media uptake by hepatocytes. Hepatobiliary phase hypointensity is characteristic but not specific for HCC; therefore, it was defined as an ancillary feature.
Figure 11.
Hypointense observation (arrow) on magnetic resonance imaging in hepatobiliary phase
If unsure whether the observation is hypo- or isoenhancing in the hepatobiliary phase, report it as isoenhancing.
Ancillary features favouring HCC in particular
Nonenhancing “capsule”
It is defined as capsule appearance without its enhancement. It is defined as a smooth border around the observation, different in signal from both observation and the rest of the liver. It does not qualify as capsule appearance, which presents as rim enhancement limited to portal venous and delayed phase.
Nodule-in-nodule appearance
It presents as a small nodule within a larger outer nodule, and both nodules differ in appearance. It is one of the types of mosaic appearance (see below). The whole (larger) nodule should be measured, not the small nodule inside.
Mosaic architecture
It applies to different appearances with random distribution in different areas (nodules, compartments) within the same observation. It is an ancillary feature favouring malignancy, especially HCC. Examples include nodule-in-nodule, multi-nodule-in-nodule, multi-compartment-in-nodule, and septated solid mass. In patients with cirrhosis or other risk factors for HCC, most masses with mosaic architecture are HCCs.
Fat in mass
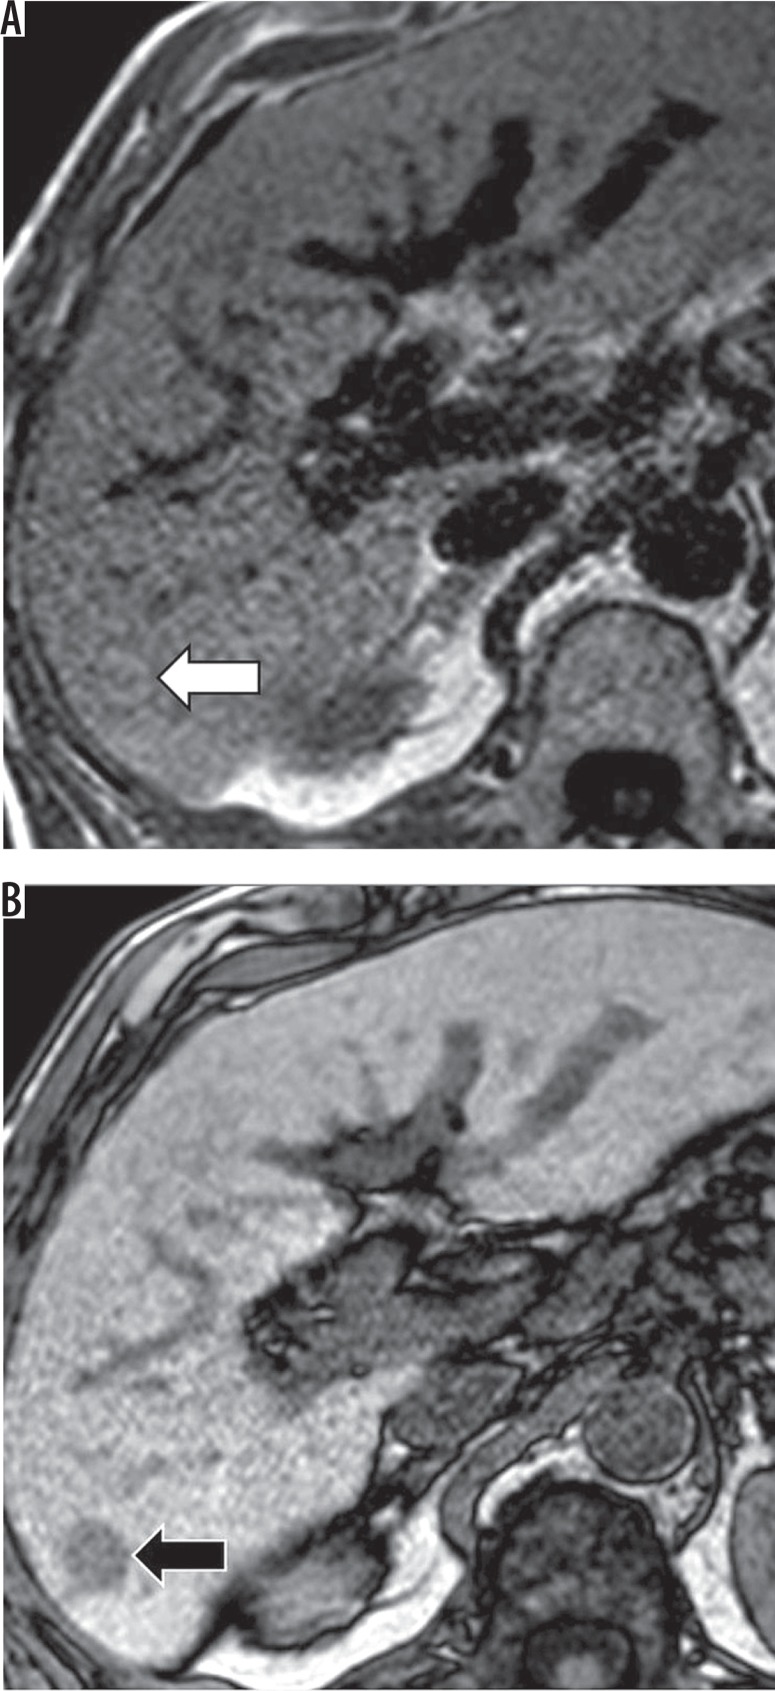
It is defined as higher fat content than in the liver parenchyma. MRI is more sensitive and specific for fat detection. In-phase and out-of-phase images (Figures 12A-B) as well as sequences with fat saturation can be used. The most common form of intralesional fat is intracellular lipids, and they can be detected by in- and out-of-phase images, while frequency-selective fat saturation technique can be used to detect less common macroscopic fat.
Figure 12.
Signal intensity drop in out-of-phase magnetic resonance imaging image (A) (black arrow) compared to in-phase image (B) (white arrow)
It needs to be differentiated with hepatic fat deposition in background liver. Intra-lesional fat is favoured over hepatic fat deposition if the observation is a mass or it enhances differently than the liver parenchyma in at least one phase.
Blood products in mass
It presents as blood products within or around the observation without a history of trauma or intervention. On CT blood products usually present with increased density, but it applies mostly to early phases of haemorrhage. On MRI blood products typically show heterogeneous hyperintensity on T1-weighted images and hypointensity on T2-weighted images. However, T1-hyperintensity can be also seen in the presence of fat, copper, or concentrated proteins. Also, blood degradation products often look different than fresh blood, with non-uniform appearance on both T1- and T2-weighted sequences.
MRI is more sensitive and specific for blood product detection than CT.
Ancillary features favouring benignity
Size stability ≥ 2 years
The observation is considered stable when there is no significant change in size over a two-year period. This applies to patients who were not treated.
Size reduction
It is defined as a spontaneous decrease in observation diameter that is not due to technique, artefact, measurement error, or resorption of blood products.
Parallels blood pool enhancement
Observation’s enhancement matching blood pool is a characteristic feature of haemangioma thus being an ancillary feature favouring benignity.
Undistorted vessels
Undistorted vessels are defined as arteries or veins passing through the observation without displacement or any other alteration.
Iron in mass, more than liver
It presents as increased iron content in the observation compared to the remaining liver parenchyma. It can be difficult to estimate on CT. MRI is more sensitive than CT in terms of iron detection, and it shows low signal intensity on T2-weighted images.
Marked T2 hyperintensity
High signal on T2-weighted images, similar to fluid in bile ducts or gallbladder, is a feature typical for haemangioma and thus favouring benignity.
Hepatobiliary phase isointensity
It is defined as identical or almost identical signal intensity of the observation and the surrounding liver parenchyma.
The ancillary features can only be applied after taking major features into consideration, and they allow for moving observation from lower categories up to LR-4. The LR-5 category needs to be confirmed by major features. If the observation has ancillary features favouring both benignity and malignancy, then do not adjust the category.
An observation that, according to major features, belongs to LR-5 but has at least two ancillary benign features [8] can be downgraded to lower categories (Figure 3).
STEP 3 – if still not sure, apply tie-breaking rules…
Tie-breaking rules can be used when major and ancillary features still do not give a certain answer. They can be applied as in Table 5, after going through major features algorithm and then using ancillary features. The general rule is that tie-breaking rules move observations to a category with a lower degree of certainty.
Infiltrative appearance
Infiltrative appearance is a description of ill-defined observations, frequently extending over multiple segments. They often represent HCCs, while hepatocholangiocarcinoma, intrahepatic cholangiocarcinoma, lymphoma, or metastases are less frequent. It is also difficult to distinguish between true malignancy and benign entities such as perfusion alteration or non-homogenous fat or iron deposition. Such benign entities should be categorised as LR-2. Vein invasion should be reported as LR-TIV and LR-5 lesions – according to major LI-RADS features. All other observations should be categorised as LR-M. There are features that suggest a malignant nature of the infiltrative appearance and they include tumour in vein, ill-defined veins, heterogeneity of the observation (with or without contrast), low T1 and moderately high T2 signal, restricted diffusion, multiple indistinct nodules, and generally distorted architecture of the parenchyma.
Treatment response algorithm
In the new version of LI-RADS a detailed treatment response assessment algorithm was introduced. The algorithm should be applied in the first step of treatment response evaluation.
First, it should be determined whether the technical features of the images allow assessment of the treated lesion.
If the images are corrupt or missing, then the lesion should have the “LR-TR Nonevaluable” category assigned.
If the images are technically acceptable, then one of the following three categories should be used:
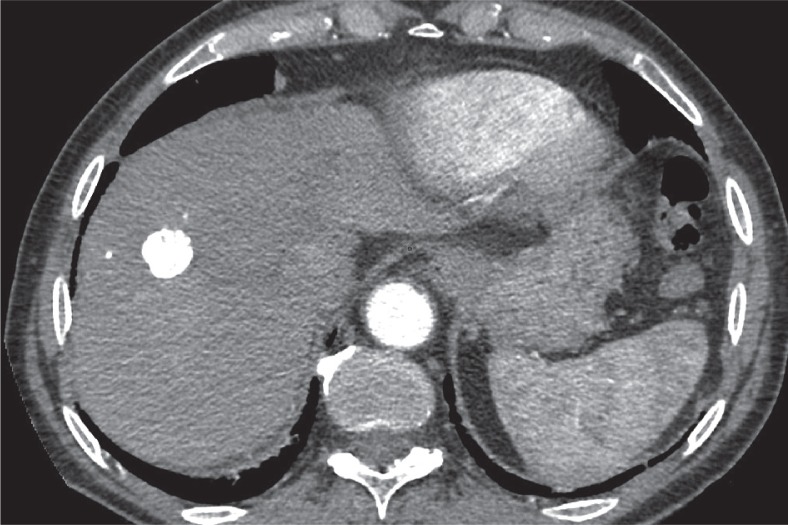
The LR-TR Nonviable category should be assigned for non-enhancing lesions (Figure 13) or presenting enhancement pattern typical for the treatment.
Figure 13.
Contrast enhanced computed tomography, arterial phase. The whole lesion is filled with lipiodol, no viable tissue visible
The LR-TR Equivocal category is for lesions that do not show typical viable tumour pattern and their enhancement is atypical for treated lesions.
The LR-TR Viable category should be assigned for lesions with or adjacent to irregular tissue with: arterial hyperenhancement (Figure 14) OR washout OR enhancement pattern resembling lesion before the treatment.
Figure 14.
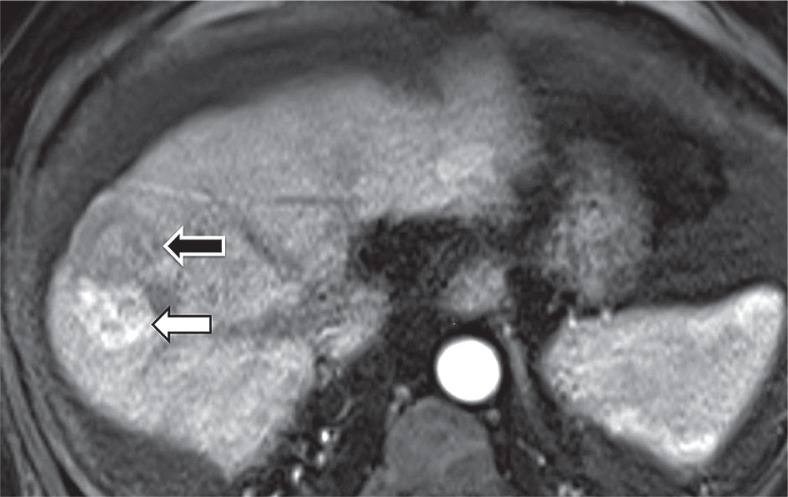
Magnetic resonance imaging, arterial phase. Viable tissue presenting as hyperenhancing mass (white arrow) adjacent to post-TACE area (black arrow)
In the second step viable tumour tissue diameter should be measured. The largest enhancing area should be measured along its longest dimension, but the measurement cannot pass through the nonenhancing part of the observation.
If not sure about category choice, one should use LR-TR Equivocal, which is the category with lower certainty.
In the final check make sure the category choice is reasonable.
Management
AASLD and EASL have recommendations for lesions that are definitely HCCs (LR-5) but not for “indeterminate” nodules (LI-RADS-2, -3, and -4). LI-RADS does not give definite answers on management, but it does give some suggestions.
Management options for LR-2, LR-3, or LR-4 observations may include continuation of standard surveillance, accelerated surveillance, or repeated exam with an alternative imaging method or biopsy. The decision between these options does not come directly from the LI-RADS category because clinical data should be taken into consideration. Recommendation of biopsy should be based on multidisciplinary team discussion, not solely on imaging [1].
LR-1 and LR-2 observations should be under standard surveillance, which is ultrasound every six months. For LR-3 observations diagnostic imaging (CT or MR) should be repeated within 3-6 months or an alternative modality should be used. Observations that have higher risk of being malignant should be evaluated by a multidisciplinary team, which includes LR-TR-viable lesions.
Other classification systems
Some of the most popular guidelines for liver cancer have been issued by the American Association for the Study of Liver Diseases (AASLD) [9], the European Association for the Study of the Liver, and the European Organisation for Research and Treatment of Cancer (EASL-EORTC) [10].
AASLD and EASL criteria categorise nodules into one of three classes: HCC, indeterminate, or benign. LI-RADS with its five categories adds more granularity to HCC categorisation.
EASL and AASLD algorithms are very similar. Both algorithms are for cirrhotic patients who are under ultrasound surveillance. Ultrasound examinations are performed every six months. For detected nodules < 1 cm ultrasound should be repeated every three months (AASLD) or four months (EASL). For nodules > 1 cm both algorithms recommend dynamic MR or CT (EASL prefers both modalities for lesions 1-2 cm) [11].
In the United States there are also the Organ Procurement and Transplantation Network (OPTN) criteria for patients with HCC, who are considered for liver transplantation [12]. OPTN 0 class means incomplete/inadequate study, which is similar to LR-NC category of LI-RADS. The classes 1-5 are also similar to LI-RADS, with OPTN 5 class meaning definitely HCC. OPTN class 5 is divided into subclasses: 5A: 1-2 cm lesion (hyperenhancement + growth over 50% in 6 months), 5B: 2-5 cm lesion, 5T: lesion with prior regional treatment, and 5X: > 5 cm lesion. There are some differences between OPTN and LI-RADS. For example, OPTN includes all liver transplantation candidates, and LI-RADS has its eligibility criteria, e.g. concerning risk factors. OPTN recognises threshold growth as > 50% increase in size within < 6 months, while LI-RADS also accepts > 100% increase in size within > 6 months and a new observation > 10 mm.
The European Society of Gastrointestinal and Abdominal Radiology (ESGAR) in 2016 issued its own guidelines on liver MR imaging including HCC diagnosis. There are no named categories, but diagnosis is also based on size (> 1 cm) and major features (arterial hyperenhancement and washout) as well as additional features: hepatobiliary phase hypointensity, T2-hyperintensity, and diffusion restriction, which is similar to LI-RADS. It does not give recommendations on management though.
The typical enhancement pattern is much more frequent in larger HCCs than in smaller nodules: 24% in nodules < 1 cm, 28% in 1-2 cm nodules, and 47% in tumours > 2 cm [13]. Smaller nodules, due to dual blood supply, are more often hypovascular.
For lesions above 1 cm in diameter that do not show typical enhancement AASLD and EASL recommend biopsy because imaging is not sufficient to make a definite diagnosis. For lesions under 1 cm in diameter recommendations remain unchanged: follow-up at three months with the same technique that discovered the nodule. It is worth noting though that the prevalence of malignancy among 1-2 cm indeterminate nodules is low (14-23%), and biopsy of all such nodules results in many negative results [14]. For lesions < 1 cm the percentage of malignant lesions is probably even smaller.
According to LI-RADS, sub-centimetre lesions can be classified as LR-4 (probably HCC) at most. None of the classification systems is specific enough for lesions < 1 cm in diameter or for hypovascular lesions in HCC diagnosis. In such cases follow-up and biopsy, respectively, can be taken into consideration.
Conclusions
There is a need for language unification and thus improvement of communication between specialists involved in HCC diagnosis and management, including hepatologists. There are many systems that attempt to address this problem, and each of them does it with a different approach. They are not flawless – they all lack specificity in sub-centimetre and hypovascular lesions.
LI-RADS is focused on maximising specificity for the diagnosis of HCC with few management suggestions, and as such it is a very useful tool in everyday practice. LI-RADS is frequently updated, very detailed, and constantly evolving. The 2017 update emphasised its advantages especially with the introduction of the treatment response algorithm and clarification of many of its features. LI-RADS, with its granularity, high specificity of LR-5 category, and frequent updates, seems the most thorough and useful classification system for HCC imaging.
Conflict of interest
The authors report no conflict of interest.
References
- 1.LI-RADS CT/MRI v 2017. [Internet]. Available from: https://www.acr.org/Clinical-Resources/Reporting-and-Data-Systems/LI-RADS/CT-MRI-LI-RADS-v2017.
- 2.Cruite I, Tang A, Sirlin CB. Imaging-based diagnostic systems for hepatocellular carcinoma. Am J Roentgenol. 2013;201:41–55. doi: 10.2214/AJR.13.10570. [DOI] [PubMed] [Google Scholar]
- 3.Liu W, Qin J, Guo R, et al. Accuracy of the diagnostic evaluation of hepatocellular carcinoma with LI-RADS. Acta Radiol. 2018;59:140–146. doi: 10.1177/0284185117716700. [DOI] [PubMed] [Google Scholar]
- 4.Abd Alkhalik Basha M, Abd El Aziz El Sammak D, El Sammak AA. Diagnostic efficacy of the Liver Imaging-Reporting and Data System (LI-RADS) with CT imaging in categorising small nodules (10-20 mm) detected in the cirrhotic liver at screening ultrasound. Clin Radiol. 2017;72:901.e1–901.e11. doi: 10.1016/j.crad.2017.05.019. [DOI] [PubMed] [Google Scholar]
- 5.Kim YY, An C, Kim S, Kim M. Diagnostic accuracy of prospective application of the Liver Imaging Reporting and Data System (LI-RADS) in gadoxetate-enhanced MRI. Eur Radiol. 2018;28:2038–2046. doi: 10.1007/s00330-017-5188-y. [DOI] [PubMed] [Google Scholar]
- 6.Murakami T, Kim T, Takamura M, et al. Hypervascular hepatocellular carcinoma: detection with double arterial phase multi-detector row helical CT. Radiology. 2001;218:763–767. doi: 10.1148/radiology.218.3.r01mr39763. [DOI] [PubMed] [Google Scholar]
- 7.Ichikawa T, Kitamura T, Nakajima H, et al. Hypervascular hepatocellular carcinoma: can double arterial phase imaging with multidetector CT improve tumor depiction in the cirrhotic liver? AJR Am J Roentgenol. 2002;179:751–758. doi: 10.2214/ajr.179.3.1790751. [DOI] [PubMed] [Google Scholar]
- 8.Chernyak V, Tang A, Flusberg M, et al. LI-RADS ancillary features on CT and MRI. Abdom Radiol (NY) 2018;43:82–100. doi: 10.1007/s00261-017-1220-6. [DOI] [PubMed] [Google Scholar]
- 9.Bruix J, Sherman M. Management of hepatocellular carcinoma: An update. Hepatology. 2011;53:1020–1022. doi: 10.1002/hep.24199. [DOI] [PMC free article] [PubMed] [Google Scholar]
- 10.Dufour JF, Greten TF, Raymond E, et al. Clinical Practice Guidelines EASL – EORTC Clinical Practice Guidelines : Management of hepatocellular carcinoma European Organisation for Research and Treatment of Cancer. J Hepatol. 2012;56:908–943. doi: 10.1016/j.jhep.2011.12.001. [DOI] [PubMed] [Google Scholar]
- 11.Kudo M. Clinical Practice Guidelines for Hepatocellular Carcinoma Differ between Japan , United States , and Europe. Liver Cancer. 2015;4:85–95. doi: 10.1159/000367730. [DOI] [PMC free article] [PubMed] [Google Scholar]
- 12.Wald C, Russo MW, Heimbach JK, et al. New OPTN/UNOS policy for liver transplant allocation: standardization of liver imaging, diagnosis, classification, and reporting of hepatocellular carcinoma. Radiology. 2013;266:376–382. doi: 10.1148/radiol.12121698. [DOI] [PubMed] [Google Scholar]
- 13.Yoon SH, Lee JM, So YH, et al. Multiphasic MDCT enhancement pattern of hepatocellular carcinoma smaller than 3 cm in diameter: Tumor size and cellular differentiation. Am J Roentgenol. 2009;193:482–489. doi: 10.2214/AJR.08.1818. [DOI] [PubMed] [Google Scholar]
- 14.Khalili K, Kyoung Kim T, Jang HJ, et al. Indeterminate 1-2-cm nodules found on hepatocellular carcinoma surveillance: Biopsy for all, some, or none? Hepatology. 2011;54:2048–2054. doi: 10.1002/hep.24638. [DOI] [PubMed] [Google Scholar]


