Abstract
Currently the major aim in peripheral vascular malformation diagnosis, crucial for subsequent management and treatment, is to identify its haemodynamic characteristics. Other significant features that should be specified by a radiologist are the exact location of the anomaly, its size, and its morphology. Until recently the diagnostic methods available for comprehensive evaluation of malformations have been rather limited. Moreover, they were often associated with the necessity of exposing the patient to X-ray radiation and with invasive procedures, as for example in angiography. The development of imaging techniques used in the diagnosis of vascular abnormalities in recent years, especially magnetic resonance imaging, has contributed to improved diagnostic value of the tests. In this article we review the currently available imaging modalities with particular consideration of magnetic resonance imaging and its capability to distinguish between high- and low-flow malformations.
Keywords: magnetic resonance imaging, vascular malformation, high-flow malformations, low-flow malformations
Introduction
Peripheral vascular malformations (PVM) are a heterogeneous group of abnormalities that may present a significant diagnostic and therapeutic challenge. The frequency of PVM occurrence in the general population is approx. 0.8-1% [1], and their most common locations are in the head and neck (approx. 40% of cases), limbs (40%), and trunk (20%) [2]. PVMs manifest in a wide spectrum of non-specific symptoms depending on their location and size, ranging from small subcutaneous lesions to limb deformation when the malformation affects growth cartilage and to potentially life-threatening malformations that cause haemodynamic dysfunctions leading to heart failure [3].
Classification
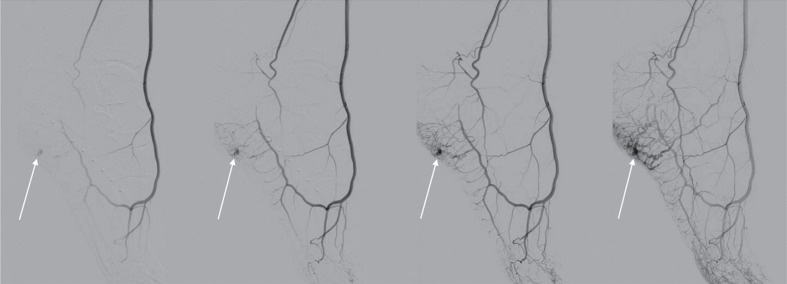
The first classification of vascular anomalies based on their biological and histological characteristics and natural history was presented in 1982 by Mulliken and Glowacki, who divided the anomalies into two major categories: haemangiomas and vascular malformations [4]. In 1993 Jackson et al. presented their classification of vascular malformations based on the lesions’ radiological characteristics, and flow dynamics, distinguishing between high- and low-flow malformations [5]. The aim of such classification was to provide a communication platform for both radiologists and surgeons and most importantly to allow dedicated treatment planning for individual lesions. The division into high- and low-flow malformations was made using angiography. The researchers defined high-flow malformations as those where arterial and venous phases appear in one angiographic image and consist of multiple and twisted arterial and venous vessels with a visible feeding artery, a nidus, and/or shunting (Figure 1).
Figure 1.
Digital subtraction angiography of high-flow vascular malformation of the foot. In all expositions there can be seen a nidus of the malformation (arrows). In the two lasts expositions there can be seen both arterial and venous phase and nidus
A nidus is a tangle of abnormal, small, and twisted vessels forming the transition between the feeding arteries and the draining veins, bypassing a capillary bed. Due to a big pressure difference within the nidus some of the vessels form direct connections whose haemodynamic characteristics correspond to arteriovenous shunts.
In 1996 both classifications were adapted and expanded by the International Study of Vascular Anomalies (ISSVA). The update made in 2014 currently represents the conclusive, widely used classification (Table 1) [6]. It divides the malformations based on their haemodynamic and morphological characteristics, respectively, into high- and low-flow malformations and then further narrows down the division distinguishing between simple and complex malformations. All malformations with the arterial component in their morphology are classified as high-flow malformations.
Table 1.
International Study of Vascular Anomalies classification of vascular malformation [6]
| Flow | Vascular malformation | |
|---|---|---|
| Simple | Combined | |
| Low-flow | Capillary malformations Lymphatic malformations Venous malformations |
CVM, CLM LVM, CLVM |
| High-flow | Arteriovenous malformation Arteriovenous fistula |
CAVM, CLAVM |
Diagnostics
For each disease the key components of diagnosis are a detailed physical examination and patient interview. However, in the case of PVM they are not sufficient for a physician to determine the size, location, and type of the anomaly. Thus, diagnostic imaging is essential in diagnosing patients suffering from PVM. Radiological imaging allows the precise identification of the location of the anomaly, its size, the extent of the affected tissues, and the type of the malformation. Identification of the flow type is crucial. It determines further management and treatment of the condition. Currently, low-flow malformations are usually treated with the use of percutaneous sclerotherapy and high-flow malformations with transarterial embolisation or with both methods simultaneously [7]. Imaging modalities as well as their role and adequacy in PVM diagnosis are reviewed below.
Ultrasound examination
Doppler ultrasound examination is the basic, widely available diagnostic tool. It is usually the first imaging examination for patients with a malformation presenting as a subcutaneous lesion. The exam allows the evaluation of the characteristics and the flow velocity within the malformation in real time. Percutaneous sclerotherapy of PVM is often performed with the assistance of ultrasound guidance. Ultrasound is also extremely useful to monitor patients who have undergone therapeutic procedures treating PVM.
The disadvantages of the ultrasound are its lack of precision in evaluating anomalies located deep in the tissues or in the immediate vicinity of the bone, and its dependency on the experience of the person performing the examination [7,8]. The characteristic features of the high- and low-flow malformations are presented in Table 2 [9]. In the currently available literature there are no data on the sensitivity and specificity of the ultrasound technique in differentiating between vascular malformations.
Table 2.
B-Mode and Doppler ultrasound imaging features of common vascular malformations [9]
| Vascular malformation | B-Mode | Doppler |
|---|---|---|
| Low-flow | ||
| Venous | Echogenic mass Phleboliths Often multispatial and compressible |
Monophasic or no flow pattern |
| Lymphatic | Variable multicystic Multispatial masses with or without fluid and debris level |
No flow, except in septa |
| High-flow | ||
| Arteriovenous malformation and fistulas | Cluster of vessels with no intervening Well-defined mass |
Arterial and venous signals from vessels in the lesions with arterialisation of venous structures |
Radiography
Conventional radiography plays a limited role in PVM diagnostics. It does not allow classification of the anomaly. Nevertheless, radiographs showing anomalies in the bones such as erosions, sclerotisation, periosteal reaction, and pathologic fractures suggest that the malformation affects the bone tissue. The presence of calcifications (phleboliths) in soft tissue projection points to a low-flow venous malformation [7].
Arteriography and phlebography
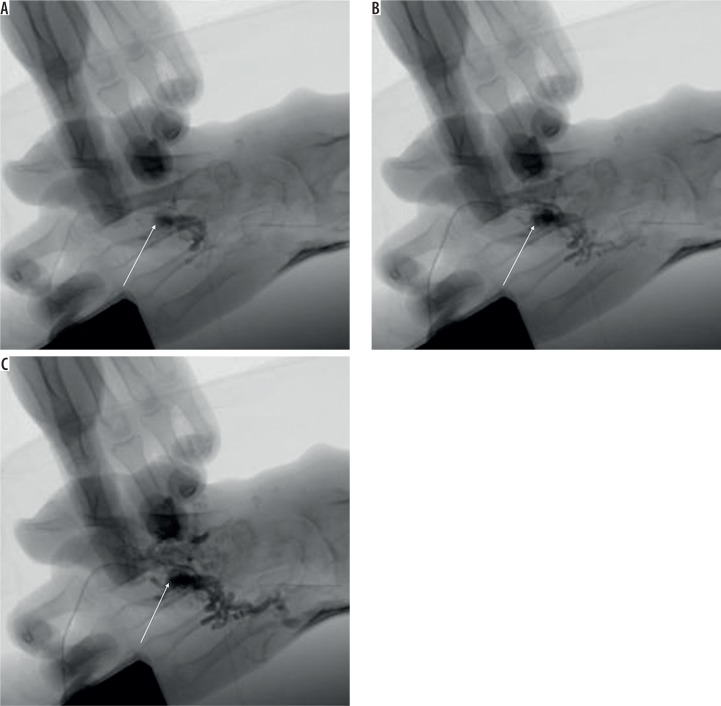
Arteriography and phlebography are imaging methods directly preceding a potential medical procedure. Although the methods are invasive and expose the patient to X-ray radiation, at the same time they offer adequate assessment of the size of the nidus as well as the feeding and draining vessels, in particular through percutaneous nidus puncture [10] (Figure 2).
Figure 2.
Angiography of vascular malformation of the hand through direct percutaneous nidus puncture (arrows shows the puncture place)
Computer tomography
With multi-slice computer tomography (CT) with intravenous contrast administration one can perform a fast evaluation of the malformation and the potential complications that may occur. High spatial resolution makes it possible to precisely assess the location and configuration of the feeding and draining vessels. The disadvantage of CT is a significant dose of ionising radiation. Consequently, the number of acquisitions in the dynamic test is limited, which makes the evaluation of blood flow dynamics difficult.
Magnetic resonance
Magnetic resonance imaging (MRI) is the most valuable imaging method when diagnosing vascular malformations. MRI allows the precise identification of the location of the anomaly and the extent of the affected tissues. Also, dynamic MRI is the only method that allows the classification of the malformation as low- or high-flow with a high level of sensitivity and specificity.
Currently most of the available tests used to diagnose vascular malformations have been performed with 1.5T systems because they are more accessible. The first reviews of the use of the 3.0T system have recently been published [11]. However, there are no data offering a direct comparison between sensitivity and specificity of the two systems in differentiating vascular malformations.
Most of the diagnostic protocols consist of the following sequences: spin echo (SE) or fast spin echo (FSE) T1-weighted, T2-weighted with fat saturation or short tau inversion recovery (STIR), T2-weighted GRE, volumetric interpolated breath-hold examination (VIBE), and dynamic MR angiography (DCE-MRA) [12]. Detailed imaging protocols are presented in Table 3 [12,13]. T1-weighted sequences are used to identify the location and anatomic relationship with adjacent structures. With T2-weighted sequence and STIR it is possible to determine the extent of the malformation, demonstrate more precisely the lesion within the surrounding fat tissue, and conduct preliminary assessment of the flow dynamics. DCE-MRA, e.g. time-resolved angiography with interleaved stochastic trajectories (TWIST), enhanced with gadolinium contrast material, is the essential sequence that makes it possible to conduct a detailed evaluation of the architecture and haemodynamic properties of the malformation. VIBE and T1-weighted sequences are usually repeated after TWIST sequence (after contrast injection) as the delayed venous phase. This is used to examine the very-low-flow malformations and the extent of its drainage in the venous system [13-15]. The above described sequences are also applied in checkup tests after medical procedures, e.g. sclerotherapy or embolisation.
Table 3.
| Parameter | Single-shot SSFP | STIR | T1W Fast SE | TWIST MRA | 3D GRE T1W FLASH* | 3D FS T1W VIBE* | ||||||
|---|---|---|---|---|---|---|---|---|---|---|---|---|
| 1.5-T | 3-T | 1.5-T | 3-T | 1.5-T | 3-T | 3D 1.5-T | 3D 3-T | 1.5-T | 3-T | 1.5-T | 3-T | |
| TR/TE (ms) | 4.3/2.0 | 4.74/2.37 | 6000/70¥ | 3500/50† | 512/11 | 600/11 | 2.3/09 | 2.93/1.21 | 3.32/1.21 | 2.97/1.2 | 4/2.3 | 3.3/1.17 |
| Flip angle (°) | 80 | 70 | 150 | 150 | 150 | 150 | 25 | 18 | 25 | 23 | 8 | 13 |
| Slice thcikness (mm) | 5 | 6 | 6 | 5 | 5 | 5 | 1.5 | 1 | 1.5 | 1 | 3 | 2 |
| Matrix | 220 × 256 | 205 × 256 | 230 × 512 | 210 × 320 | 358 × 448 | 384 × 384 | 246 × 352 | 384 × 512 | 230 × 384‡ 230 × 512§ |
264 × 512‡ 416 × 512§ |
144 × 256‡ 171 × 384§ |
179 × 256‡ 261 × 320§ |
| No. of slices | 30 | 30 | 20 | 30 | 20 | 30 | 112 | 130 | 64‡ 80§ |
88‡ 96§ |
44‡ 192§ |
96‡ 192§ |
| Imaging time (s) | 15 | 0.2 | 62 | 150 | 213 | 174 | 134 | 94 | 14‡ 26§ |
15‡ 31§ |
24‡ 232§ |
20‡ 204§ |
FS – fat-suppressed, MRA – MR angiography, NA – not applicable, NSA – number of signals acquired, TE – echo time, T1W – T1-weighted, TR – repetition time
Administration of gadolinium contrast agent – dose of 0.1 ml/kg of bodyweight, injection rate 4-4.5 ml/s
Postcontrast images are obtained with the same sequence;
Inversion time 150 ms;
Inversion time 220 ms ;
These data refer to breath-hold acquisitions in the abdomen;
For anatomic regions where breath-hold acquisition is not necessary we routinely increase the resolution.
Primary characteristics of individual types of vascular malformations revealed in MR imaging are presented in Table 4 [12].
Table 4.
Magnetic resonance imaging features of vascular malformation [12]
| Low-flow malformation | High-flow malformation |
|---|---|
|
Venous malformation Septated lobulated mass without mass effect Phleboliths (low SI), fluid-fluid levels, low SI on T1WI, high SI on T2WI No flow voids on SE images Infiltrates tissue planes and possible surrounding oedema No arterial or early venous enhancement Slow gradual enhancement and diffuse enhancement on delayed images with some late enhancement (≥ 5 s) Normal afferent arteries Contrast pooling in dilated stagnant venous spaces in later venous phase imaging |
Arteriovenous malformations and fistulas No well-defined mass Infiltration of tissue planes Flow voids on SE images Enlarged feeding arteries and draining veins Hypertrophied tortuous afferent arteries and efferent veins Direct arteriovenous communications via vascular nidus Early enhancement of arteriovenous lesion (≤ 5 s) Early enhancement of enlarged feeding arteries and nidus with shunting to draining veins |
|
Lymphatic Septated lobulated mass with some fluid – fluid levels Can see infiltration of tissue planes Low SI on T1WI, high SI on T2WI No flow voids on SE images Rim and septal enhancement No significant or slight diffuse enhancement | |
|
Capillary Skin-thickness lesion |
SE – spin echo, SI – signal intensity, T1WI – T1-weighted imaging, T2WI – T2-weighted imaging
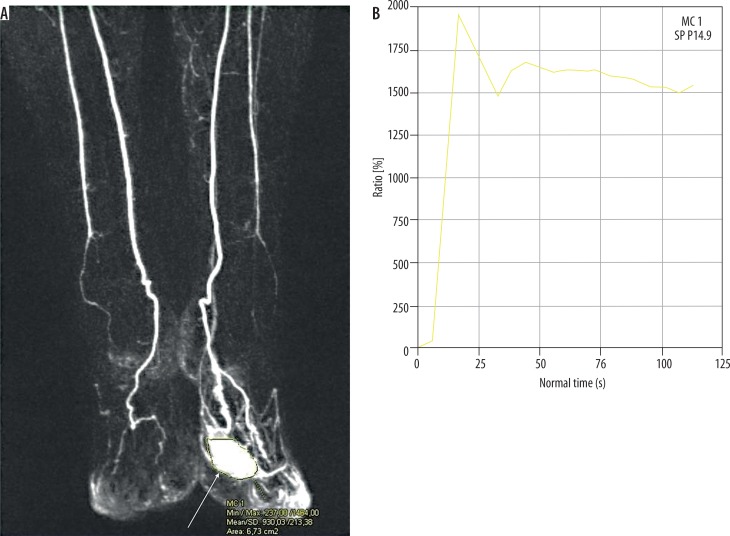
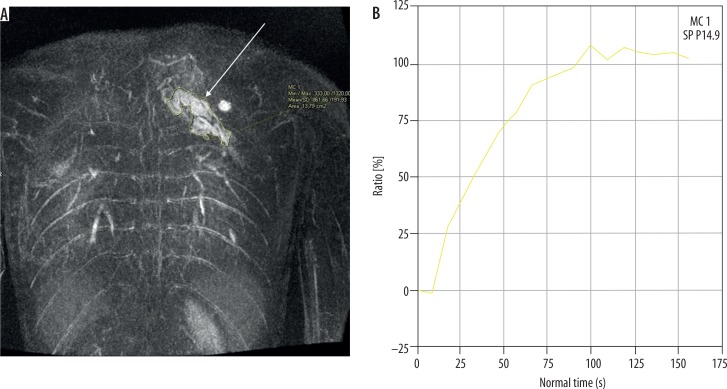
Because of a high spatial and temporal resolution of up to two seconds and the possibility of acquiring images in many phases (early arterial and arterial phase, intermediate, and venous) the TWIST sequence allows us to identify the time between the onset of arterial phase enhancement (of the artery that is not affected by the malformation) and the onset of the lesion enhancement (tonset) and the maximum enhancement time (tmax), and to determine the lesion enhancement curve. Recent research carried out on small groups of patients demonstrated that these properties permit classification of the malformation as low- or high-flow. In their research Kociemba et al. defined tonset ≤ 4.1 s and tmax ≤ 27 s as the cut-off points for high-flow malformations characterised by sensitivity and specificity reaching, respectively, approx. 100% and 57% for tonset (AUC = 0.89) and 94% and 100% for tmax (AUC = 0.99) [13]. Similar values of cut-off points for these variables were obtained by Ohgiya et al. (tonset ≤ 5 s and tmax ≤ 30 s) for which sensitivity reached 100% for both and specificity reached 60% for tonset and 100% for tmax [16]. Additionally, there is another variable proposed by Hammer et al. determined on the basis of the enhancement curve and useful in differentiating the flow type within the malformation, namely the maximum percentage increase in signal intensity from baseline within the lesion (signalmax) (Figures 3 and 4). It is calculated as follows:
Figure 3.
Coronal image of dynamic magnetic resonance angiography of high-flow malformation (arrow) of the forefoot (A). ROI was positioned for calculating enhancement curve (B). Peak of the curve appears shortly after intravenous administration of contrast agent
Figure 4.
Coronal image of dynamic magnetic resonance angiography of low-flow malformation (arrow) of the upper torso (A). ROI was positioned for calculating enhancement curve (B). After intravenous administration of contrast agent, the curve rises slowly to its maximum
The study proved the effectiveness of the variable in differentiating between sub-types of low-flow malformations either containing hypodynamic AVF or not. The calculated value of the cut-off point was ≥ 419% for VM containing hypodynamic AVF. After setting the ROC curve, AUC was 0.85 [11].
Due to the risk of potential occurrence of nephrogenic fibrosis after administration of gadolinium contrast in patients with kidney failure, currently there are attempts to develop and use angiographic sequences without intravenous contrast, such as time of flight (TOF) and phase contrast (PC). These techniques are used to evaluate peripheral blood vessels, but they have certain constraints. Slowing down the flow and saturating the signal in a plane that is not transverse may be a problem for acquisition of diagnostic images in TOF sequence. Another challenge is the selection of appropriate velocity encoding in the PC sequence. Moreover, these sequences require a long acquisition time [17].
Alternative angiographic techniques are being developed, such as electrocardiographically gated three-dimensional (3D) partial Fourier FSE, which is based on subtraction of images in systolic and diastolic phases [18]. The technique has its downsides such as artefacts (blurring) and low sensitivity as regards low-flow vessels in distal parts of the limbs.
Another alternative method is arterial spin labelling (ASL) combined with partial-Fourier FSE. This technique allows elimination of the signal from the background and better visualisation of small vessels. ASL provides data about the blood flow, whereas partial-Fourier FSE shows the lesion’s morphology [17].
Conclusions
To sum up, vascular malformations may be visualised with the use of various imaging modalities. However, MRI is the method of choice as the most effective in delivering significant data about the lesion. At the same time, MRI is quite non-invasive and the burden on the patient is small, limited to intravenous contrast administration. In particular, DCE-MRA yields essential information on the type of the malformation and allows further therapy planning and outcome monitoring.
Conflict of interest
The authors report no conflict of interest.
References
- 1.Tasnádi G. Epidemiology and etiology of congenital vascular malformations. SeminVasc Surg. 1993;6:200–203. [PubMed] [Google Scholar]
- 2.Dubois J, Soulez G, Oliva VL, et al. Soft-tissue venous malformations in adult patients: imaging and therapeutic issues. Radiographics. 2001;21:1519–1531. doi: 10.1148/radiographics.21.6.g01nv031519. [DOI] [PubMed] [Google Scholar]
- 3.Ernemann U, Kramer U, Miller S, et al. Current concepts in the classification, diagnosis and treatment of vascular anomalies. Eur J Radiol. 2010;75:2–11. doi: 10.1016/j.ejrad.2010.04.009. [DOI] [PubMed] [Google Scholar]
- 4.Mulliken JB, Glowacki J. Hemangiomas and vascular malformations in infants and children: a classification based on endothelial characteristics. Plast Reconstr Surg. 1982;69:412–422. doi: 10.1097/00006534-198203000-00002. [DOI] [PubMed] [Google Scholar]
- 5.Jackson IT, Carreńo R, Potparic Z, et al. Hemangiomas, vascular malformations, and lymphovenous malformations: classification and methods of treatment. Plast Reconstr Surg. 1993;91:1216–1230. doi: 10.1097/00006534-199306000-00006. [DOI] [PubMed] [Google Scholar]
- 6.ISSVA Classification of Vascular Anomalies International Society for the Study of Vascular Anomalies. 2014. Available at: www.issva.org/classification (Accessed: 27 March 2017)
- 7.Hyodoh H, Hori M, Akiba H, et al. Peripheral vascular malformations imaging, treatment approaches, and therapeutic issues. Radiographics. 2005;25(Suppl 1):S159–171. doi: 10.1148/rg.25si055509. [DOI] [PubMed] [Google Scholar]
- 8.Gruber H, Peer S. Ultrasound diagnosis of soft tissue vascular malformations and tumours. Curr Med Imaging Rev. 2009;5:55–61. [Google Scholar]
- 9.Lowe LH, Marchant TC, Rivard DC, et al. Vascular malformations: classification and terminology the radiologist needs to know. Semin Roentgenol. 2012;47:106–117. doi: 10.1053/j.ro.2011.11.002. [DOI] [PubMed] [Google Scholar]
- 10.Inoue Y, Ohtake T, Wakita S, et al. Flow characteristics of soft-tissue vascular anomalies evaluated by direct puncture scintigraphy. Eur J Nucl Med. 1997;24:505–510. doi: 10.1007/BF01267681. [DOI] [PubMed] [Google Scholar]
- 11.Hammer S, Uller W, Manger F, et al. Time-resolved magnetic resonance angiography (MRA) at 3.0 Tesla for evaluation of hemodynamic characteristics of vascular malformations: description of distinct subgroups. Eur Radiol. 2017;27:296–305. doi: 10.1007/s00330-016-4270-1. [DOI] [PubMed] [Google Scholar]
- 12.Flors L, Leiva-Salinas C, Maged IM, et al. MR imaging of soft-tissue vascular malformations: diagnosis, classification, and therapy follow-up. Radiographics. 2011;31:1321–1340. doi: 10.1148/rg.315105213. [DOI] [PubMed] [Google Scholar]
- 13.Kociemba A, Karmelita-Katulska K, Stajgis M, et al. Distinguishing high-flow from low-flow vascular malformations using maximum intensity projection images in dynamic magnetic resonance angiography – comparison to other MR-based techniques. Acta Radiol. 2016;57:565–571. doi: 10.1177/0284185115615005. [DOI] [PubMed] [Google Scholar]
- 14.Herborn CU, Goyen M, Lauenstein TC, et al. Comprehensive time-resolved MRI of peripheral vascular malformations. AJR Am J Roentgenol. 2003;181:729–735. doi: 10.2214/ajr.181.3.1810729. [DOI] [PubMed] [Google Scholar]
- 15.Donnelly LF, Adams DM, Bisset GS 3rd. Vascular malformations and hemangiomas: a practical approach in a multidisciplinary clinic. AJR Am J Roentgenol. 2000;174:597–608. doi: 10.2214/ajr.174.3.1740597. [DOI] [PubMed] [Google Scholar]
- 16.Ohgiya Y, Hashimoto T, Gokan T, et al. Dynamic MRI for distinguishing high-flow from low-flow peripheral vascular malformations. AJR Am J Roentgenol. 2005;185:1131–1137. doi: 10.2214/AJR.04.1508. [DOI] [PubMed] [Google Scholar]
- 17.Miyazaki M, Lee VS. Nonenhanced MR angiography. Radiology. 2008;248:20–43. doi: 10.1148/radiol.2481071497. [DOI] [PubMed] [Google Scholar]
- 18.Klasen J, Blondin D, Schmitt P, et al. Nonenhanced ECG-gated quiescent-interval single-shot MRA (QISS MRA) of the lower extremities: comparison with contrast-enhanced MRA. Clin Radiol. 2012;67:441–446. doi: 10.1016/j.crad.2011.10.014. [DOI] [PubMed] [Google Scholar]


