Abstract
MatrixDB (http://matrixdb.univ-lyon1.fr/) is an interaction database focused on biomolecular interactions established by extracellular matrix (ECM) proteins and glycosaminoglycans (GAGs). It is an active member of the International Molecular Exchange (IMEx) consortium (https://www.imexconsortium.org/). It has adopted the HUPO Proteomics Standards Initiative standards for annotating and exchanging interaction data, either at the MIMIx (The Minimum Information about a Molecular Interaction eXperiment) or IMEx level. The following items related to GAGs have been added in the updated version of MatrixDB: (i) cross-references of GAG sequences to the GlyTouCan database, (ii) representation of GAG sequences in different formats (IUPAC and GlycoCT) and as SNFG (Symbol Nomenclature For Glycans) images and (iii) the GAG Builder online tool to build 3D models of GAG sequences from GlycoCT codes. The database schema has been improved to represent n-ary experiments. Gene expression data, imported from Expression Atlas (https://www.ebi.ac.uk/gxa/home), quantitative ECM proteomic datasets (http://matrisomeproject.mit.edu/ecm-atlas), and a new visualization tool of the 3D structures of biomolecules, based on the PDB Component Library and LiteMol, have also been added. A new advanced query interface now allows users to mine MatrixDB data using combinations of criteria, in order to build specific interaction networks related to diseases, biological processes, molecular functions or publications.
INTRODUCTION
The current version of the matrisome comprises 1027 proteins (http://matrisomeproject.mit.edu/other-resources/human-matrisome/, (1,2)), and six glycosaminoglycans (GAGs) although a higher number of proteins are secreted in the extracellular milieu.
This structural scaffold contributes to the organization and mechanical properties of tissues and plays as such a key role in tissue failure (3). The ECM is a source of bioactive fragments (matricryptins), which are released by proteolysis and have biological activities of their own (4). The ECM modulates cell behavior via several receptors and this dynamic structure constantly undergoes remodeling, which leads to diseases in the absence of appropriate regulation (5,6). The structure and functions of the 3D intricate ECM network rely on numerous interactions and the identification of key interactions for ECM assembly and cell interplay is a prerequisite to determine how they are perturbed in diseases. Interactions may be identified by high-throughput assays, but many are reported in publications that focus on specific proteins. In order to investigate them at the scale of a biological process, a tissue or an organ, these interactions must be captured individually in the literature and stored in databases. We have built a database, MatrixDB (http://matrixdb.univ-lyon1.fr/), focused on biomolecular interactions established by ECM proteins, matricryptins and GAGs (7–9). MatrixDB is an active member of the International Molecular Exchange (IMEx) consortium (https://www.imexconsortium.org/) (10) and has adopted the HUPO Proteomics Standards Initiative standards for manual curation of the literature and the exchange of interaction data, either at the MIMIx (The Minimum Information about a Molecular Interaction eXperiment (11)) or IMEx level. Curation is performed via the curation interface of the IntAct database (https://www.ebi.ac.uk/intact/ (12)).
We have updated MatrixDB with a focus on GAGs by adding cross-references of GAG entries to the GlyTouCan database (13), representation of GAG sequences in different formats (IUPAC and GlycoCT (14)) and as SNFG (Symbol Nomenclature For Glycans) images (15), and GAG Builder (http://glycan-builder.cermav.cnrs.fr/gag/ (16)) to build 3D models of GAG sequences from GlycoCT codes. Gene expression data from Expression Atlas (https://www.ebi.ac.uk/gxa/home/ (17)), and quantitative ECM proteomic datasets (http://matrisomeproject.mit.edu/ecm-atlas/ (2)) have been imported into MatrixDB. A new visualization tool of the 3D structures of biomolecules, based on the PDB Component Library (http://www.ebi.ac.uk/pdbe/pdb-component-library/index.html) and LiteMol (18) has been added on the Biomolecule Report pages. The database schema has been deeply modified to speed up queries, ease data import and export and represent n-ary experiments. Last, advanced queries have been designed to create lists of biomolecules of interest based on combined criteria in order to build their interaction networks with MatrixDB iNavigator (9).
MATRIXDB CONTENT
GAGs: from sequences to 3D models
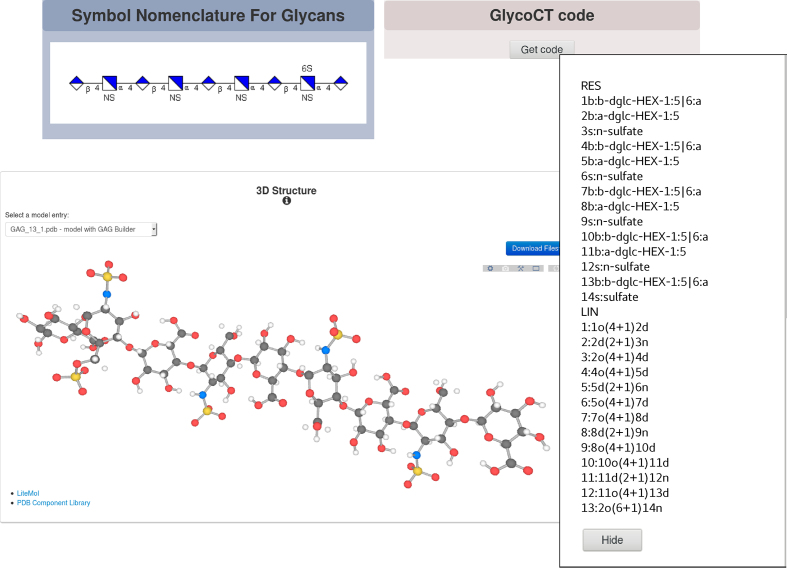
About 50 GAG sequences interacting with proteins, identified by manual curation of the literature (19), and cross-referenced with the ChEBI database (https://www.ebi.ac.uk/chebi/ (20)) in agreement with the IMEx curation rules, have been added to MatrixDB. A further cross-reference to the major glycan repository GlyTouCan (https://glytoucan.org/ (13)) has been added to all GAG entries of MatrixDB in order to increase the interoperability of MatrixDB with glycobiology databases. The machine-readable GlycoCT format, a unifying sequence format for carbohydrates (14), and the images of GAG sequences based on the SNFG (15) have been added on the Biomolecule Report pages of GAG entries (Figure 1). These formats will allow users to computationally browse protein-GAG interaction data in order to identify the chemical groups of GAGs (N-sulfate, O-sulfate, and N-acetyl groups), and/or the uronic acid (glucuronic or iduronic acid), which are involved in protein binding, and to determine if they are specific of one structural and/or functional protein family. This is very useful to describe binding features on GAGs in a standardized manner, to identify proteins sharing these features, and to decipher the glycocodes resulting from the combination of GAG chemical features.
Figure 1.
Biomolecule Report page of a glycosaminoglycan entry (GAG_13, a heparin nonasaccharide) where the sequence of the GAG is displayed as an SNFG image and GlycoCT format together with a 3D model of the GAG.
Other new features of MatrixDB include the possibility to build and display 3D models of GAG sequences, interacting or not with proteins. For this purpose, we have designed GAG Builder, a user-friendly tool based on conformational maps of GAG disaccharides (http://glycan-builder.cermav.cnrs.fr/gag/), and have added it to MatrixDB in association with the CT23D converter we have developed to convert GAG sequences in GlycoCT format to 3D models (16). The 3D models are displayed on the Biomolecule Report page of each GAG entry when no 3D experimental structures are available. Several GAG oligosaccharides used for binding assays are obtained by depolymerizing heparin/heparan sulfate with heparinase I. This generates a 4,5-unsaturated uronic acid coded in GlycoCT as HexA, which is either an iduronic acid or a glucuronic acid. However, it is mandatory to know the nature of the uronic acid to build a GAG model. It is thus not possible to build a 3D model of GAG oligosaccharides containing a 4,5-unsaturated uronic acid. Furthermore, 150 protein-GAG interactions have been added to the updated version of MatrixDB. The numbers of GAG–protein interactions and other interactions available in the current version of MatrixDB (release 3.4) are listed in Supplementary Table S1.
Integration of gene expression and quantitative proteomic data
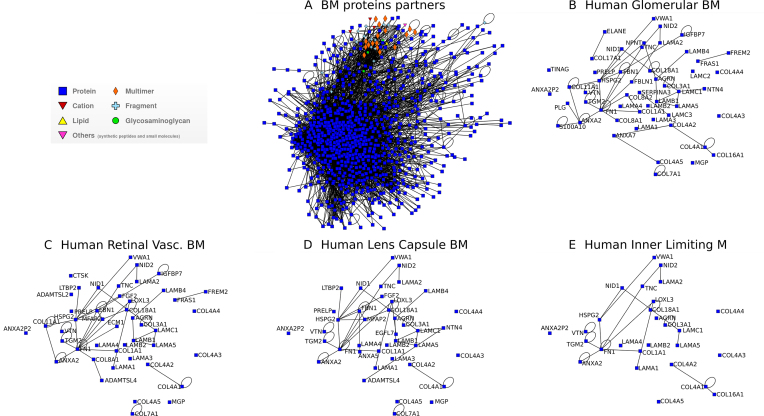
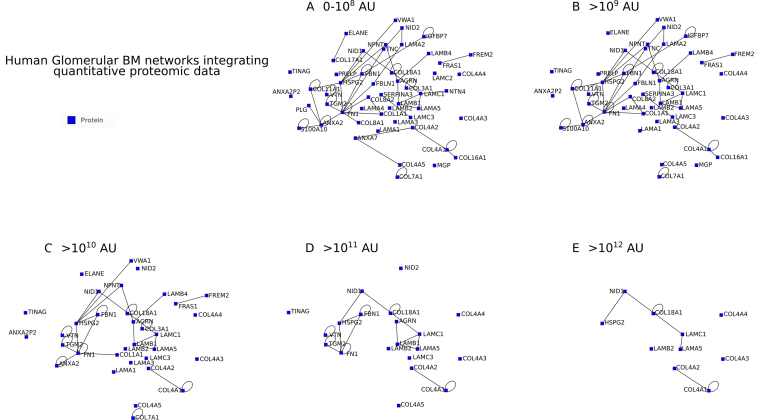
The updated version of MatrixDB contains gene expression data imported from Expression Atlas (https://www.ebi.ac.uk/gxa/home), including data from 450 human donors and over 9600 RNA-seq samples across 51 tissue sites and 2 cell lines (transformed fibroblasts and EBV-transformed lymphocytes) from the Genotype-Tissue Expression (GTEx) Project (v7 release, https://gtexportal.org/home/). They are displayed as anatomograms, heatmaps and boxplots on the Biomolecule Report page of protein entries. Quantitative proteomic datasets of 14 different tissues and tumors imported from the ECM atlas (http://matrisomeproject.mit.edu/ecm-atlas/ (2)) have been added to the Biomolecule Report pages and are displayed as histograms. This allows the integration in the interaction networks of quantitative data reflecting the abundance of proteins expressed simultaneously in the same tissue in vivo. Both gene expression and quantitative proteomic data can be used to build disease-specific or tissue-specific ECM interaction networks such as basement membrane networks (Figure 2). The largest interaction network comprises all human biomolecules retrieved by querying MatrixDB with ‘basement membrane’ in the advanced search (Figure 2A). Proteomic data have then been used to select within this network the biomolecules identified in human glomerular basement membrane (Figure 2B), human retinal vascular basement membrane (Figure 2C), human lens capsule basement membrane (Figure 2D), and human inner limiting membrane (Figure 2E). Proteomic data are thus used to determine the biomolecules and the core network common to the studied basement membranes (e.g. COL4A1, COL4A2, COL4A3, COL4A4, COL4A5, NID2) and to identify biomolecules that are found only in a particular basement membrane (e.g. ANXA7 in human glomerular basement membrane, Figure 2B, ADAMTSL2 in human retinal vascular basement membrane, Figure 2C, and EGFL7 in lens capsule basement membrane, Figure 2D). The topology of the networks A-E is identical and has been automatically determined by the iNavigator to minimize the node overlaps within the networks and limit the number of cross edges. Another example of the use of quantitative proteomic data is provided in Figure 3 showing the interaction network of human glomerular basement membrane visualized with different thresholds of peptide abundance in arbitrary units.
Figure 2.
Interaction networks integrating quantitative proteomic data built with the iNavigator of MatrixDB. An advanced search was performed with ‘Basement membrane’ (BM) query in ‘Biomolecule information’. The query was restricted to human biomolecules only and to those involved in at least one interaction. All the primary hits and the secondary hits were included in the interaction network (A). The global network was then filtered with quantitative proteomic data from human glomerular basement membrane (51 nodes, B), human retinal vascular basement membrane (45 nodes, C), human lens capsule basement membrane (40 nodes, D), and human inner limiting membrane (M) (27 nodes, E). The nodes corresponding to proteins, which were not detected in the proteomic datasets of these membranes (peptide abundance: 0) were deleted from the networks.
Figure 3.
Interaction network of the human glomerular basement membrane integrating quantitative proteomic data (i.e. different threshold values of peptide abundance). The human glomerular basement membrane network was built with different threshold values of peptide abundance in arbitrary units (AU): 0–108 (A), >109 (B), >1010 (C), >1011 (D) and >1012 (E).
A new visualization tool of the 3D structures of proteins, GAGs and interacting complexes
The 3D structures of proteins and GAGs are visualized on the Biomolecule Report pages with a new visualization tool using the PDB Component Library (http://www.ebi.ac.uk/pdbe/pdb-component-library/index.html) and LiteMol (18). In addition, protein sequences, secondary structures, topological diagrams, and domain annotations from CATH and SCOP, when available, are displayed on the Biomolecule Report pages thanks to this tool. 3D structure of complexes formed via interactions of two or more participants are displayed on the Experiment page when available in the Protein Data Bank (https://www.rcsb.org/ (21)).
Representation of n-ary interactions and homodimers
The database schema has been improved. Indeed, the core classes that stored associations and experiments have been redesigned to speed up queries, ease data import and export and represent n-ary experiments. n-ary experiments are now represented as such and Spoke-expanded into binary associations when appropriate (e.g. when an n-ary experiment comprises a single bait Spoke expansion is performed around this bait (22)). The database schema now closely matches the PSI-MI 3.0 XML specification (23), thus greatly facilitating data exchange with our partners within the IMEx consortium.
Mining MatrixDB data: advanced search
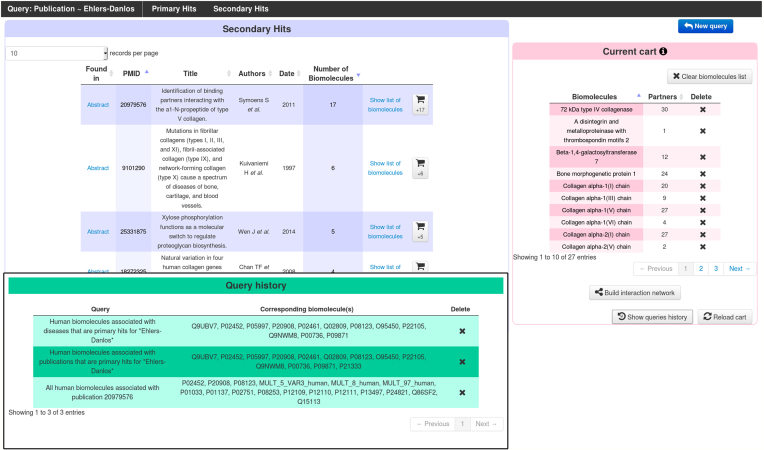
We have designed an advanced query interface to generate lists of biomolecules of interest based on single or multiple, combined, criteria and the corresponding interaction networks with the MatrixDB iNavigator or with Cytoscape (http://www.cytoscape.org/ (24)) via a SIF export. Users can query MatrixDB by entering free text to search for biomolecules based on identifiers, UniProtKB keywords (25), Gene Ontology (GO) terms (26,27), diseases, and publications. Searches can be performed with a single word or with several words. Space-separated words are considered as a single query, whereas a comma-separated list of words searches for all the words by default or for at least one of the words when using the check-box. Search results can be restricted to human biomolecules and/or to biomolecules involved in at least one interaction. Each query returns biomolecules listed as ‘Primary hits’ and ‘Secondary hits’. The direct search of biomolecules returns as primary hits biomolecules whose identifier or name matches the query, while as secondary hits are biomolecules whose one of the descriptive fields contains the query. Similarly, publications whose title matches the query are returned as primary hits, while the secondary hits are the publications with a match in their abstract. Except for the direct biomolecule search mode, all query modes function in two steps. In a first step, keywords, GO terms, publications or diseases matching the query string are returned as primary or secondary hits. In a second step, biomolecules annotated with each keyword or GO term, or associated with each publication or disease, can be added to the list of biomolecules of interest (named ‘current cart’ and displayed in pink, see Figure 4), either as a batch with a single click or one by one. The list of queries performed along with their results can be viewed in the ‘queries history’, and individual queries can be deleted without affecting other queries. Finally, biomolecules in the cart are used to build their interaction network integrating their partners. An example of advanced queries is displayed in Figure 4.
Figure 4.
Use of the new advanced queries interface to study Ehlers-Danlos syndromes. ‘Ehlers-Danlos’ was used as a search string in several subsections of the advanced queries interface, as shown in the green ‘query history’ window. All queries were restricted to human biomolecules involved in at least one interaction. The ‘diseases’ subsection yielded 13 different syndromes/subtypes, which are associated with a total of 12 proteins in MatrixDB. The ‘publications’ subsection found 61 articles whose titles contain ‘Ehlers-Danlos’ (Primary Hits), and which are associated with 13 biomolecules altogether; and also 25 additional articles as Secondary Hits shown here in blue, whose abstracts contain ‘Ehlers-Danlos’. Moving the mouse over each secondary hit pops up the abstract with the search string highlighted, allowing to easily decide whether the biomolecules associated with a publication should be added to the list of biomolecules of interest, shown in the pink ‘cart’ section. Clicking on ‘build interaction network’ in this cart section launches iNavigator to build a network comprising all selected biomolecules and their partners as a starting point. The interaction networks can then be filtered using gene expression data, proteomic data and interaction detection methods.
Conclusion
The representation of GAG sequences binding to proteins in the machine-readable GlycoCT format is useful to browse MatrixDB to determine the chemical groups and sizes of GAGs contributing to their interactions with structural and/or functional protein families, and to decipher the GAG glycocodes. The possibility to build 3D models of GAGs from sequences written in the GlycoCT format using the GAG builder tool further refines our understanding of the molecular mechanisms of GAG-protein interactions and provides new insights into the 3D structure of GAG-protein complexes. The integration of quantitative ECM proteomic datasets is another major improvement, which allows the building of tissue-specific interaction networks based on the presence of the proteins and not only on expression data, which is an asset given the weak correlation between transcriptomic and proteomic datasets. Finally, the new advanced query interface can be used to create lists of biomolecules of interest, based on individual or multiple queries (e.g. biomolecule name, biological processes, molecular functions, diseases and publications) in order to build specific interaction networks related to any of these topics.
DATA AVAILABILITY
MatrixDB interaction data are available at http://matrixdb.univ-lyon1.fr/
The ECM atlas is available at http://matrisomeproject.mit.edu/ecm-atlas/
The CT23D converter tool is an open source collaborative initiative available in the GitHub repository (https://github.com/OlivierClerc/convert-glycoct-inp).
The GAG builder tool, integrated into MatrixDB database, is also available at http://glycan-builder.cermav.cnrs.fr/gag/
Supplementary Material
ACKNOWLEDGEMENTS
We thank Dr David Sehnal (Masaryk University, Czech Republic), Mandar Deshpande (EMBL-EBI, UK) and Julien Mariethoz (University of Geneva, Switzerland) for their very valuable help and fruitful discussions.
SUPPLEMENTARY DATA
Supplementary Data are available at NAR Online.
FUNDING
Fondation pour la Recherche Médicale [DBI20141231336 to M.D., N.T.M., S.R.B.]; Institut Français de Bioinformatique [ANR-11-INBS-0013, Glycomatrix project, call 2015 to O.C., S.P., N.T.M., S.R.B.]; GDR GAG [CNRS, GDR 3739, Structure, Fonction et Régulation des Glycosaminoglycanes to S.R.B., S.P.]; Cross Disciplinary Program Glyco@Alps, within the framework ‘Investissements d’Avenir’ program [ANR-15IDEX-02 to S.P.]. Funding for open access charge: Fondation pour la Recherche Médicale [DBI20141231336].
Conflict of interest statement. None declared.
REFERENCES
- 1. Naba A., Clauser K.R., Hoersch S., Liu H., Carr S.A., Hynes R.O.. The matrisome: in silico definition and in vivo characterization by proteomics of normal and tumor extracellular matrices. Mol. Cell Proteomics. 2012; 11:doi:10.1074/mcp.M111.014647. [DOI] [PMC free article] [PubMed] [Google Scholar]
- 2. Naba A., Clauser K.R., Ding H., Whittaker C.A., Carr S.A., Hynes R.O.. The extracellular matrix: tools and insights for the ‘omics’ era. Matrix Biol. 2016; 49:10–24. [DOI] [PMC free article] [PubMed] [Google Scholar]
- 3. Karsdal M.A., Nielsen M.J., Sand J.M., Henriksen K., Genovese F., Bay-Jensen A.-C., Smith V., Adamkewicz J.I., Christiansen C., Leeming D.J.. Extracellular matrix remodeling: the common denominator in connective tissue diseases. Possibilities for evaluation and current understanding of the matrix as more than a passive architecture, but a key player in tissue failure. Assay Drug Dev. Technol. 2013; 11:70–92. [DOI] [PMC free article] [PubMed] [Google Scholar]
- 4. Ricard-Blum S., Vallet S.D.. Fragments generated upon extracellular matrix remodeling: biological regulators and potential drugs. Matrix Biol. 2017; doi:10.1016/j.matbio.2017.11.005. [DOI] [PubMed] [Google Scholar]
- 5. Hynes R.O., Naba A.. Overview of the matrisome–an inventory of extracellular matrix constituents and functions. Cold Spring Harb. Perspect. Biol. 2012; 4:a004903. [DOI] [PMC free article] [PubMed] [Google Scholar]
- 6. Karamanos N.K., Theocharis A.D., Neill T., Iozzo R.V.. Matrix modeling and remodeling: a biological interplay regulating tissue homeostasis and diseases. Matrix Biol. 2018; doi:10.1016/j.matbio.2018.08.007. [DOI] [PMC free article] [PubMed] [Google Scholar]
- 7. Chautard E., Ballut L., Thierry-Mieg N., Ricard-Blum S.. MatrixDB, a database focused on extracellular protein-protein and protein-carbohydrate interactions. Bioinformatics. 2009; 25:690–691. [DOI] [PMC free article] [PubMed] [Google Scholar]
- 8. Chautard E., Fatoux-Ardore M., Ballut L., Thierry-Mieg N., Ricard-Blum S.. MatrixDB, the extracellular matrix interaction database. Nucleic Acids Res. 2011; 39:D235–D240. [DOI] [PMC free article] [PubMed] [Google Scholar]
- 9. Launay G., Salza R., Multedo D., Thierry-Mieg N., Ricard-Blum S.. MatrixDB, the extracellular matrix interaction database: updated content, a new navigator and expanded functionalities. Nucleic Acids Res. 2015; 43:D321–D327. [DOI] [PMC free article] [PubMed] [Google Scholar]
- 10. Orchard S., Kerrien S., Abbani S., Aranda B., Bhate J., Bidwell S., Bridge A., Briganti L., Brinkman F.S.L., Brinkman F. et al. Protein interaction data curation: the International Molecular Exchange (IMEx) consortium. Nat. Methods. 2012; 9:345–350. [DOI] [PMC free article] [PubMed] [Google Scholar]
- 11. Orchard S., Salwinski L., Kerrien S., Montecchi-Palazzi L., Oesterheld M., Stümpflen V., Ceol A., Chatr-aryamontri A., Armstrong J., Woollard P. et al. The minimum information required for reporting a molecular interaction experiment (MIMIx). Nat. Biotechnol. 2007; 25:894–898. [DOI] [PubMed] [Google Scholar]
- 12. Orchard S., Ammari M., Aranda B., Breuza L., Briganti L., Broackes-Carter F., Campbell N.H., Chavali G., Chen C., del-Toro N. et al. The MIntAct project–IntAct as a common curation platform for 11 molecular interaction databases. Nucleic Acids Res. 2014; 42:D358–D363. [DOI] [PMC free article] [PubMed] [Google Scholar]
- 13. Tiemeyer M., Aoki K., Paulson J., Cummings R.D., York W.S., Karlsson N.G., Lisacek F., Packer N.H., Campbell M.P., Aoki N.P. et al. GlyTouCan: an accessible glycan structure repository. Glycobiology. 2017; 27:915–919. [DOI] [PMC free article] [PubMed] [Google Scholar]
- 14. Herget S., Ranzinger R., Maass K., Lieth C.-W.V.D.. GlycoCT-a unifying sequence format for carbohydrates. Carbohydr. Res. 2008; 343:2162–2171. [DOI] [PubMed] [Google Scholar]
- 15. Varki A., Cummings R.D., Aebi M., Packer N.H., Seeberger P.H., Esko J.D., Stanley P., Hart G., Darvill A., Kinoshita T. et al. Symbol nomenclature for graphical representations of glycans. Glycobiology. 2015; 25:1323–1324. [DOI] [PMC free article] [PubMed] [Google Scholar]
- 16. Clerc O., Mariethoz J., Rivet A., Lisacek F., Pérez S., Ricard-Blum S.. A pipeline to translate glycosaminoglycan sequences into 3D models. Application to the exploration of glycosaminoglycan conformational space. Glycobiology. 2018; doi:10.1093/glycob/cwy084. [DOI] [PubMed] [Google Scholar]
- 17. Papatheodorou I., Fonseca N.A., Keays M., Tang Y.A., Barrera E., Bazant W., Burke M., Füllgrabe A., Fuentes A.M.-P., George N. et al. Expression Atlas: gene and protein expression across multiple studies and organisms. Nucleic Acids Res. 2018; 46:D246–D251. [DOI] [PMC free article] [PubMed] [Google Scholar]
- 18. Sehnal D., Deshpande M., Vařeková R.S., Mir S., Berka K., Midlik A., Pravda L., Velankar S., Koča J.. LiteMol suite: interactive web-based visualization of large-scale macromolecular structure data. Nat. Methods. 2017; 14:1121–1122. [DOI] [PubMed] [Google Scholar]
- 19. Peysselon F., Ricard-Blum S.. Heparin-protein interactions: from affinity and kinetics to biological roles. Application to an interaction network regulating angiogenesis. Matrix Biol. 2014; 35:73–81. [DOI] [PubMed] [Google Scholar]
- 20. Hastings J., Owen G., Dekker A., Ennis M., Kale N., Muthukrishnan V., Turner S., Swainston N., Mendes P., Steinbeck C.. ChEBI in 2016: Improved services and an expanding collection of metabolites. Nucleic Acids Res. 2016; 44:D1214–D1219. [DOI] [PMC free article] [PubMed] [Google Scholar]
- 21. Rose P.W., Prlić A., Altunkaya A., Bi C., Bradley A.R., Christie C.H., Costanzo L.D., Duarte J.M., Dutta S., Feng Z. et al. The RCSB protein data bank: integrative view of protein, gene and 3D structural information. Nucleic Acids Res. 2017; 45:D271–D281. [DOI] [PMC free article] [PubMed] [Google Scholar]
- 22. Ori A., Wilkinson M.C., Fernig D.G.. A systems biology approach for the investigation of the heparin/heparan sulfate interactome. J. Biol. Chem. 2011; 286:19892–19904. [DOI] [PMC free article] [PubMed] [Google Scholar]
- 23. Sivade Dumousseau M., Alonso-López D., Ammari M., Bradley G., Campbell N.H., Ceol A., Cesareni G., Combe C., De Las Rivas J., Del-Toro N. et al. Encompassing new use cases - level 3.0 of the HUPO-PSI format for molecular interactions. BMC Bioinformatics. 2018; 19:134. [DOI] [PMC free article] [PubMed] [Google Scholar]
- 24. Shannon P., Markiel A., Ozier O., Baliga N.S., Wang J.T., Ramage D., Amin N., Schwikowski B., Ideker T.. Cytoscape: a software environment for integrated models of biomolecular interaction networks. Genome Res. 2003; 13:2498–2504. [DOI] [PMC free article] [PubMed] [Google Scholar]
- 25. UniProt Consortium T. UniProt: the universal protein knowledgebase. Nucleic Acids Res. 2018; 46:2699. [DOI] [PMC free article] [PubMed] [Google Scholar]
- 26. Ashburner M., Ball C.A., Blake J.A., Botstein D., Butler H., Cherry J.M., Davis A.P., Dolinski K., Dwight S.S., Eppig J.T. et al. Gene ontology: tool for the unification of biology. The Gene Ontology Consortium. Nat. Genet. 2000; 25:25–29. [DOI] [PMC free article] [PubMed] [Google Scholar]
- 27. The Gene Ontology Consortium Expansion of the Gene Ontology knowledgebase and resources. Nucleic Acids Res. 2017; 45:D331–D338. [DOI] [PMC free article] [PubMed] [Google Scholar]
Associated Data
This section collects any data citations, data availability statements, or supplementary materials included in this article.
Supplementary Materials
Data Availability Statement
MatrixDB interaction data are available at http://matrixdb.univ-lyon1.fr/
The ECM atlas is available at http://matrisomeproject.mit.edu/ecm-atlas/
The CT23D converter tool is an open source collaborative initiative available in the GitHub repository (https://github.com/OlivierClerc/convert-glycoct-inp).
The GAG builder tool, integrated into MatrixDB database, is also available at http://glycan-builder.cermav.cnrs.fr/gag/


