Abstract
Because an acidic cellular microenvironment is engendered by inflammation and may determine cell differentiation, we elucidated the impact of acidic conditions on induction of proopiomelanocortin (POMC) expression. Here, we demonstrate mechanisms for proton sensitivity of CRH receptor 1 (CRHR1) signaling to POMC and ACTH production. Low pH (6.8) resulted in doubling of POMC expression and ACTH production in pituitary cell line AtT-20 and in primary mouse pituitary cells. Using CRISPR knockout, we show that CRHR1 is necessary for acid-induced POMC expression, and this induction is mediated by CRHR1 histidine residues and calmodulin-dependent protein kinase II in both pituitary corticotroph cells and in nonpituitary cell lines expressing ectopic ACTH. In contrast, CRH ligand binding affinity to CRHR1 was decreased with acidic pH, implying that proton-induced POMC expression prevails in acidic conditions independently of CRH ligand binding. The results indicate that proton-induced CRHR1 signaling regulates ACTH production in response to an acidic microenvironment.
Cellular insults, including those engendered by inflammation, hypoxia, or neoplasia, may decrease microenvironmental cellular pH (1, 2). Moreover, extracellular acidic conditions also determine differentiation and proliferation mediated by proton sensors, including proton-sensing G-protein coupling receptors (3, 4). The pH value in inflammation sites ranges down to 6.8 in fresh atherosclerosis plaques (5) or in synovial fluid in patients with rheumatoid arthritis (6). In patients with asthma, the pH value in airway vapor condensate was as low as 5.23 (7).
Proopiomelanocortin (POMC) is expressed in pituitary corticotrophs, as well as in brain, skin, lymphocytes, and placenta (8). POMC-derived peptides, including ACTH, lead to dampened inflammation by inducing adrenal glucocorticoid hormone production and by inhibiting proinflammatory cytokine production (9). POMC exhibits breast cancer tumor–initiating properties (10) and is also a marker of poor prognosis in patients with non–small cell lung cancer (11). These reports imply that increased POMC in an acidic microenvironment may be important for control of cellular responses to inflammation and neoplasia. Because mechanisms underlying increased POMC abundance in acidic conditions are not understood, we sought to identify potential therapeutic targets by elucidating corticotroph cell proton-sensing pathways.
Pituitary POMC expression is regulated mainly by hypothalamic CRH binding to corticotroph CRH receptor 1 (CRHR1), which induces cAMP-ERK1/2 (12) as well as calcium influx and Ca2+/calmodulin-dependent protein kinase II (CaMKII) signaling to POMC synthesis (13). CRHR1 signaling to POMC also requires downstream transcription factors Tpit, Pitx1, and Nur77 (13, 14). Acidic pH was associated with IL-6 enhanced Pomc expression in primary rat pituitary cells (15). Although CRHR1 signaling leads to POMC synthesis, mechanisms for CRHR1 signaling to POMC in acidic conditions are not known. We hypothesized that CRHR1 is proton sensitive and that signaling to POMC is activated in acidic conditions by sensing protons via CRHR1 histidine residues. We used primary mouse pituitary cells and AtT-20 pituitary corticotroph adenoma cells, both of which possess intact CRHR1 signaling pathways and produce ACTH (16). We treated cells in acidic pH medium, then knocked out CRHR1 by CRISPR to assess Pomc gene expression. To elucidate mechanisms underlying our observations, we generated histidine residue mutants in CRHR1 and demonstrated proton sensitivity of CRHR1 to POMC. We also used human colorectal adenocarcinoma COLO320 cells to demonstrate that non–pituitary cell acid-induced POMC response is similar to that of pituitary corticotrophs. These results show proton sensitivity of POMC expression and ACTH production.
Materials and Methods
Mice
Experiments were approved by the Cedars-Sinai Institutional Animal Care and Use Committee. C57B/6J mice were purchased from the Jackson Laboratory (Bar Harbor, ME) and maintained under 12:12 hour light/dark cycles, with food and water available ad libitum. Four-week-old male mice were used for the experiments.
Cell lines
Mouse AtT-20/D16v-F2 pituitary tumor cells derived from the LAF1 strain (catalog no. ATCC CRL-1795; RRID: CVCL_4109) (17), COLO320DM human colon adenocarcinoma cells (catalog no. ATCC CCL-220; RRID: CVCL_0219) (18), DMS79 human small lung cancer cells (catalog no. ATCC CRL-2049; RRID: CVCL_1178) (19), MCF7 human breast cancer cells (catalog no. ATCC HTB-22; RRID: CVCL_0031) (20), Hela cervical adenocarcinoma cells (catalog no. ATCC CCL-2; RRID: CVCL_0030) (21), and B16-F0 mouse melanoma cells derived from the C57BL/6J strain (catalog no. ATCC CRL-6322; RRID: CVCL_0604) (22) were purchased from ATCC (Manassas, VA).
Reagents
CRH was purchased from Sigma-Aldrich (St. Louis, MO; catalog no. C3042); I125-Tyr-CRH from Perkin Elmer (Waltham, MA; catalog no. NEX217050UC), and KN-62 (catalog no. 1277) and H-89 dihydrochloride (catalog no. 2910) from Tocris Bioscience (Minneapolis, MN).
Cell culture and stable transfections
AtT-20, Hela, and B16-F0 cells were cultured in DMEM (Thermo Fisher Scientific, Waltham, MA; catalog no. 10566016) containing 10% fetal bovine serum in a 5% CO2-humidified atmosphere at 37°C. MCF7 cells were cultured in DMEM containing 10% fetal bovine serum and 0.01 mg/mL human recombinant insulin in a 5% CO2-humidified atmosphere at 37°C. COLO320 cells and DMS79 cells were cultured in Roswell Park Memorial Institute 1640 (Thermo Fisher Scientific; catalog no. 61870044) containing 10% fetal bovine serum in a 5% CO2-humidified atmosphere at 37°C. Anterior pituitary cells derived from the C57B/6J mice were processed with Neural Tissue Dissociate Kits (Miltenyi Biotec, Bergisch Gladbach, Germany; catalog no. 130-092-628) and cultured in DMEM containing 10% fetal bovine serum, penicillin, and streptomycin. For acidic pH treatments, Iscove’s Modified Dulbecco’s Medium (Thermo Fisher Scientific, catalog no. 12440053) adjusted pH with HCl was used. To generate mouse CRHR1 overexpressing AtT-20 cells, cDNA encoding each respective protein was cloned into the pMF expression vector or the 3′ region containing HA or FLAG tag in a pMF expression vector carrying the EF-1a promoter and neomycin resistance gene (23). Resulting plasmids were transfected into AtT-20 cells, and stable transfectants were selected with 100 µg/mL neomycin (Gemini Bio-Products, West Sacramento, CA; catalog no. 400-113).
AtT-20 and COLO320 cell gene knockout with CRISPR/Cas9
To generate CRHR1 knockout (KO) AtT-20 cells, two single-guide RNAs (sgRNAs) were designed with CHOPCHOPv2 (24) and cloned into pSpCas9(BB)-2A-GFP (PX458) (Addgene plasmid no. 48138) (25). One day before transfection, 5 × 10⁵ AtT-20 cells per well were plated. On the day of transfection, Opti-MEM medium was added to sterile Eppendorf tubes, followed by addition of Lipofectamine 2000 (Thermo Fisher Scientific; catalog no. 11668500). After brief mixing, 2 µg CRHR1 sgRNA-PX458 plasmid was added, and the mixture was incubated at room temperature for 5 minutes, then added to the cells. At 72 hours after transfection, KO cells were cloned by limiting dilution, followed by an expansion period (2 to 4 weeks). Targeted deletions were further verified by gene sequencing and Western blot.
CRHR1 mutated AtT-20 cells
Mouse CRHR1 cDNA was cloned into EcoRI/XhoI sites of pMF plasmid to generate pMF wild type (WT). CRHR1 mutants (H115F, H117F, H127F, H155F, H181F, and H199F) were generated by PCR-based mutagenesis and also cloned into the pMF plasmid. Targeted mutations were confirmed by sequencing. Sequences of primers used for mutagenesis were H115F, agaagagcaaagtgTTCtaccacattgccgtcat; H117F, gcaaagtgcactacTTCattgccgtcatcatcaa, H127F, tcaactacctgggcTTCtgcatctccctggtggc; H155F, tgaggaacatcatcTTCtggaacctcatctcggc; H181F, tgagccccgaggtcTTCcagagcaacgtggcctg; and H199F, cctacaactacttcTTCgtaaccaacttcttctg. Capital letters (TTC) show the point of mutation from histidine to phenylalanine.
Quantitative real-time PCR
RNA was isolated from each cell line or normal anterior pituitary cells by RNeasy mini kit (Qiagen, Hilden, Germany; catalog no. 74106), and cDNA prepared with iScript cDNA synthesis kit containing random and oligo dT primer mixture (Bio-Rad Laboratories, Hercules, CA; catalog no. 1708891). Quantitative real-time PCR was performed with SsoAdvanced SYBR Green Supermix (Bio-Rad; catalog no. 1725274). mRNA expression levels were normalized to 18S rRNA with comparative CT. Primer sequences used are shown in Table 1.
Table 1.
Primers for Real-Time PCR
| Gene Name | Gene Symbol | Forward Primer | Reverse Primer |
|---|---|---|---|
| Mouse Pomc | Pomc | TGTACCCCAACGTTGCTGAG | AGGACCTGCTCCAAGCCTAA |
| Mouse Crhr1 | Crhr1 | GGGCAGCCCGTGTGAATTAT | GAAGAGGACAAAGGCCACCA |
| Mouse T-box 19 | TBX19, Tpit | CCTTTCGCCAAGGCCTTCTT | AGTAGGTCACATGCTGGCTC |
| Mouse paired-like homeodomain transcription factor 1 | Pitx1 | GAGAACTCCGCCAGCGAATC | CTCTGGCCCCTTGGCTTC |
| Mouse neuronal differentiation 1 | Neurod1 | GGCTCCAGGGTTATGAGATCG | CGCTCTCGCTGTATGATTTGG |
| Mouse growth hormone | Gh | GCTTCTCAGAGACCATCCCG | ATCCTGCTGAGGAACTGCAC |
| Mouse prolactin | Prl | AGAGCTGTTTGACCGTGTGG | GTAGCCAGGGAAGAAGTGGG |
| Mouse thyroid-stimulating hormone β subunit | Tshβ | GAGAGTGTGCCTACTGCCTG | ACAGACATCCTGAGAGAGTGC |
| Mouse luteinizing hormone β subunit | Lhβ | TCTGCATCACCTTCACCACC | CTGAGGCACAGGAGGCAAA |
| Mouse follicle-stimulating hormone β subunit | Fshβ | ATACCACTTGGTGTGCGGG | TACTTTCTGGGTATTGGGCCG |
| Mouse 18S ribosomal RNA | 18s RNA | TGGCCAACGGTCTAGACAAC | CAGTGGTCTTGGTGTGCTGA |
| Human POMC | POMC | CAGGACCTCACCACGGAAAG | CGGGAACATGGGAGTCTCG |
| Human CRHR1 | CRHR1 | CAACTACCTGGGCCACTGTATC | CATCTGCCTGGTCACCCCAAT |
| Human 18S ribosomal RNA | 18s RNA | GTTCAGCCACCCGAGATTGA | CTGAGCCAGTCAGTGTAGCG |
Western blot
After each treatment, AtT-20 and COLO320 cells were lysed in radioimmunoprecipitation assay buffer (Sigma Aldrich; catalog no. R0278-50ML) supplemented with protease and phosphatase inhibitor cocktail (Thermo Fisher Scientific; catalog no. 78440). Aliquots of total protein were mixed with 2 × Laemmli Sample Buffer (Bio-Rad; catalog no. 1610737), separated on 10% SDS polyacrylamide gels, and electroblotted onto polyvinylidene fluoride membranes (Bio-Rad; catalog no. 1620175). Membranes were blocked in Blocking One (Nakalai USA; catalog no. 03953-95) for 30 minutes at room temperature, then incubated with respective primary antibodies overnight at 4°C [mouse anti-β-actin, Sigma-Aldrich, catalog no. A1978, RRID: AB_476692 (26); mouse anti-POMC, Abcam, Cambridge, MA, catalog no. ab20358, RRID: AB_445534 (27); goat anti-POMC, Abcam, catalog no. ab32893, RRID: AB_777375 (28); rabbit anti-CRHR1, Sigma-Aldrich, catalog no. SAB4500465, RRID: AB_10744295 (29); goat anti-CRHR1, Santa Cruz Biotechnology, Dallas, TX, catalog no. ac-1757, RRID: AB_673600 (30); rabbit anti-NUR77, Proteintech, Rosemont, IL, catalog no. 12235-1-AP, RRID: AB_10644125 (31); rabbit anti-PITX1, Proteintech, catalog no. 10873-1-AP, RRID: AB_10859664 (32); mouse anti-Neurod1, Abcam, catalog no. ab16508, RRID: AB_470254 (33); rabbit anti-ERK1/2, Cell Signaling Technology, Danvers, MA, catalog no. 9102, RRID: AB_330744 (34); rabbit anti-phospho-ERK1/2 (Thr202/Tyr204), Cell Signaling Technology, catalog no. 9101, RRID: AB_331646 (35); mouse anti-CREB, Abcam, catalog no. ab113622, RRID: AB_10858949 (36); mouse anti-phospho-CREB (Ser133), Cell Signaling Technology, catalog no. 9198, RRID: AB_2561044 (37); rabbit anti-CaMKII, Cell Signaling Technology, catalog no. 3362, RRID: AB_2067938 (38); rabbit anti-phospho-CaMKII (Thr286), Cell Signaling Technology, catalog no. 3361, RRID: AB_2275070 (39); rabbit anti-TPIT, a gift from Dr. Jacques Drouin (40)]. Horseradish peroxidase–conjugated goat anti-rabbit antibody (Cell Signaling Technology; catalog no. 7074; RRID: AB_2099233) (41), horse anti-mouse antibody (Cell Signaling Technology; catalog no. 7076; RRID: AB_330924) (42), and rabbit anti-goat antibody (Merck Millipore, Darmstadt, Germany; catalog no. AP106P; RRID: AB_92411) (43) were used as secondary antibodies. Signals were detected with the Clarity ECL Western Blotting Substrate (Bio-Rad; catalog no. 1705061) and ChemiDoc XRS+ imaging system (Bio-Rad). Band intensity was quantified with Image Laboratory version 3.0.1 (Bio-Rad) and normalized to β-actin.
ACTH and cAMP assays
Medium ACTH levels were analyzed by ELISA kit (MD Bioproducts, St. Paul, MN; catalog no. M046006). Intracellular cAMP levels were determined with LANCE cAMP Detection Kit (Perkin Elmer; catalog no. AD0262). ACTH and cAMP levels were corrected for cell viability calculated by WST-1 assay (Takara Bio USA, Mountain View, CA; catalog no. MK400).
Luciferase reporter assay
Luciferase reporter assays were performed in 8.0 × 10⁴ AtT-20 cells with 0.5 mg luciferase reporter plasmids (44, 45) and 50 ng pRL-Renilla as an internal control plasmid. Cells were transfected with lipofectamine 2000 and cultured in 0.5 mL medium in 24-well plates. Twenty-four hours after transfection, medium was changed to pH 7.4 or 6.8, cells were harvested, and luciferase activity was analyzed by Dual-Luciferase Reporter Assay System (Promega, Fitchburg, WI; catalog no. E1910) after 24 hours. Luciferase assays were repeated more than three times and activities normalized to internal Renilla activity.
Immunocytochemistry
AtT-20 cells were cultured in eight-chamber slides (Thermo Fisher Scientific; catalog no. 154534PK), fixed in PBS with 4% paraformaldehyde, and permeabilized with Tris-buffered saline containing 0.1% Triton X-100. Slides were blocked in Blocking One Histo (Nakalai USA; catalog no. 06349-64) for 1 hour at 37°C, then incubated with primary antibodies overnight at 4°C (goat anti-CRHR1; Santa Cruz Biotechnology; catalog no. sc-1757; RRID: AB_673600) (46). After washing, slides were incubated with Alexa Fluor donkey anti-goat 488 (Thermo Fisher Scientific; catalog no. A-11055; RRID: AB_2534102) (47) for 2 hours at room temperature, then mounted with ProLong Gold Antifade Mountant with 4′,6-diamidino-2-phenylindole (Thermo Fisher Scientific; catalog no. P36935). Confocal microscopy images were obtained with True Confocal Scanner (LeicaMicrosystems, Buffalo Grove, IL) in a dual-emission mode to separate autofluorescence from specific staining.
Receptor binding assay
Mouse CRHR1 protein was immunoprecipitated with Pierce Direct Magnetic IP/Co-IP Kit (Thermo Fisher Scientific; catalog no. 88828), AtT-20 cells were lysed in IP Lysis/Wash Buffer, and protein concentration was measured with DC protein assay (Bio-Rad Laboratories, catalog no. 500-0001). Anti-CRHR1 antibody (Aviva Systems Biology, San Diego, CA; catalog no. ARP63607_P050) was coupled with magnet beads. Cell lysate (2 mg/mL) was incubated with 100 μL antibody-coupled beads overnight at 4°C on a rotator. After washing, 5 μL of magnet beads coated by CRHR1 protein was incubated in pH-adjusted binding buffer (50 mM Tris-HCl, 5 mM MgCl2, 2 mM EGTA, 0.1% BSA) (48) with each concentration of I125-Tyr-CRH for 1 hour at room temperature on a rotator. After incubation, beads were washed three times with IP/lysis wash buffer, then analyzed for radioactivity in Packard Cobra II Gamma Counter (Packard BioScience Company, Arvada, CO).
Flow cytometry
After each time course of treatment with pH-adjusted medium, AtT-20 cells were collected and stained with annexin V and 7-AAD with FITC Annexin V detection kit with 7-AAD (Biolegend, San Diego, CA; catalog no. 640922) according to manufacturer instructions. Cell viability was analyzed by flow cytometry with BD LSR II Flow Cytometer (BD Biosciences, Franklin Lakes, NJ) and FACSDiva software (BD Biosciences).
Cell viability assay
Primary pituitary cells were stained with Live/Dead Reduced Biohazard Viability/Cytotoxicity Kit (Thermo Fisher Scientific; catalog no. L7013). Primary pituitary cells were cultured in eight-chamber slides, then incubated for 15 minutes at room temperature. After washing, cells were fixed with 4% glutaraldehyde. Fluorescence was visualized with a fluorescence microscope (BZ-X700; KEYENCE, Itasca, IL).
Quantification and statistical analysis
T-coffee (http://tcoffee.vital-it.ch/apps/tcoffee/do:regular) (49) was used to analyze CRHR1 alignment in different species. Protter 1.0 (http://wlab.ethz.ch/protter/) (50) was used for visualizing mouse CRHR1 on the cell membrane. TMHMM Server version 2.0 (http://www.cbs.dtu.dk/services/TMHMM/) (51) was used to predict transmembrane helices in gene-edited CRHR1 and GPR4 mutants.
Results are presented as mean ± SD. Comparisons between two groups were made by unpaired Student t test. One-way ANOVA was used to compare values between multiple groups. If the ANOVA test showed significant differences, the Tukey-Kramer post hoc test was used to compare two specific groups. Results were considered significant if the P value was <0.05. At least three independent experiments were performed in each study. Statistical analyses were performed with GraphPad Prism (GraphPad Software, La Jolla, CA).
Results
Mouse pituitary cells and AtT-20 cells exhibit proton sensitivity
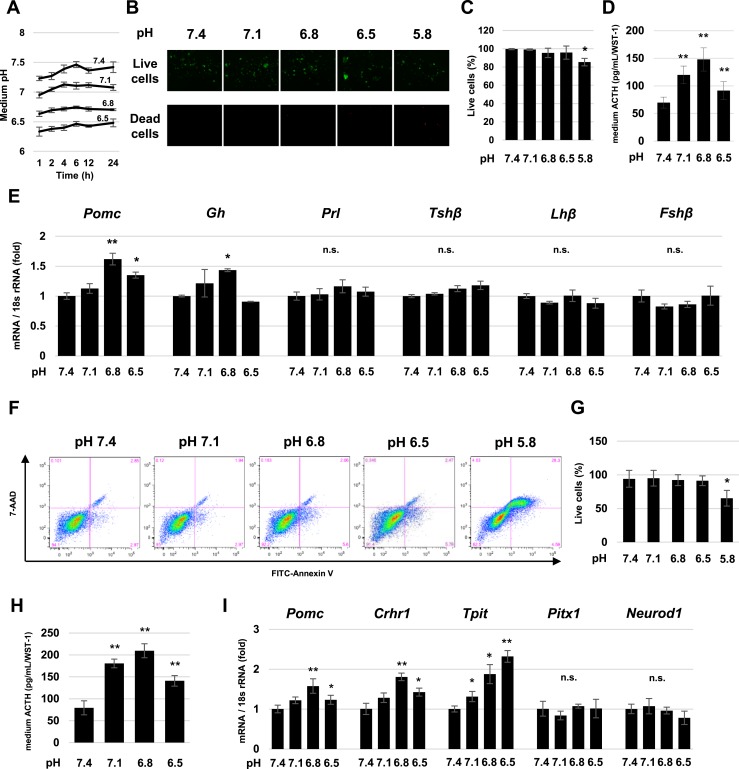
To test effects of a low-pH environment, we cultured cells with low-pH medium adjusted by HCl and analyzed differential gene expression. Primary mouse pituitary cells were grown in pH-adjusted medium ranging from 7.4 to 5.8. Medium pH was stable for 24 hours (Fig. 1A). Cell survival after 24 hours at pH 7.1, 6.8, and 6.5 was not lower than that at pH 7.4, although cell viability was significantly lower at pH 5.8 (Fig. 1B and 1C). After 2 hours, ACTH secretion into the culture medium was higher at pH 7.1, 6.8, and 6.5 compared with pH 7.4 (Fig. 1D). Pomc and Gh gene expression were significantly higher in acidic pH after 24 hours of treatment, whereas Prolactin, Tshβ, Lhβ, and Fshβ expression remained unchanged (Fig. 1E). These results suggest that expression of the ACTH precursor POMC is induced by a low-pH environment.
Figure 1.
Proton sensitivity of mouse pituitary cells and AtT-20 cells. (A) Time course of pH changes in each pH-adjusted medium. (B) Cell viability of mouse pituitary cells after 24-h culture in pH 7.4, 7.1, 6.8, 6.5, and 5.8 medium. Green, live cells (upper panels); red, dead cells (lower panels). (C) Percentage of live cells in (A). For each pH, at least three randomly selected nonoverlapping vision fields were analyzed. (D) Measurement of ACTH levels in pH-adjusted culture medium of primary pituitary cells after 2-h treatment. (E) Quantitative RT-PCR analysis of Pomc, Gh, Prolactin (Prl), Tshβ, Lhβ, and Fshβ gene expression in primary mouse pituitary cells after 24-h treatment pH 7.4, 7.1, 6.8, and 6.5 medium. (F) Representative FITC-Annexin V vs 7-AAD dot plot of AtT-20 cells cultured in pH-adjusted medium for 24 h. (G) Percentages of live cells in (E). For each pH, three independent experiments were analyzed. (H) Measurement of ACTH levels in pH-adjusted culture medium of AtT-20 cells after 2 h of treatment. (I) Quantitative RT-PCR analysis of Pomc, Crhr1, Tpit, Pitx1, Neurod1, and Gh gene expression. Results are mean ± SD. *P < 0.05 vs pH 7.4; **P < 0.01 vs pH 7.4. n.s., not significant.
We next analyzed POMC expression by AtT-20 cells in each respective pH-adjusted medium. Similar to results obtained in primary pituitary cells, survival of AtT-20 cells after 24 hours at pH 7.1, 6.8, and 6.5 was not lower than that at pH 7.4 but was lower at pH 5.8 (Fig. 1F and 1G). ACTH secretion into the culture medium was higher at pH 7.1, 6.8, and 6.5 than at pH 7.4 after 2 hours (Fig. 1H). We next analyzed expression of factors known to regulate Pomc under the low-pH environment. Pomc, Crhr1, and Tpit gene expression were all higher after 24-hour culture at pH 6.8 and 6.5 than at pH 7.4; Tpit was also higher at pH 7.1, but Pitx1 and Neurod1 gene expression were not changed in acidic pH (Fig. 1I).
These results indicate that both normal pituitary corticotrophs and corticotroph tumor cells exhibit Pomc sensitivity to acidic (proton) signaling and that Crhr1 signaling and Tpit may be involved in upregulation of Pomc gene expression.
Acidic pH activates CaMKII pathway in AtT-20 cells
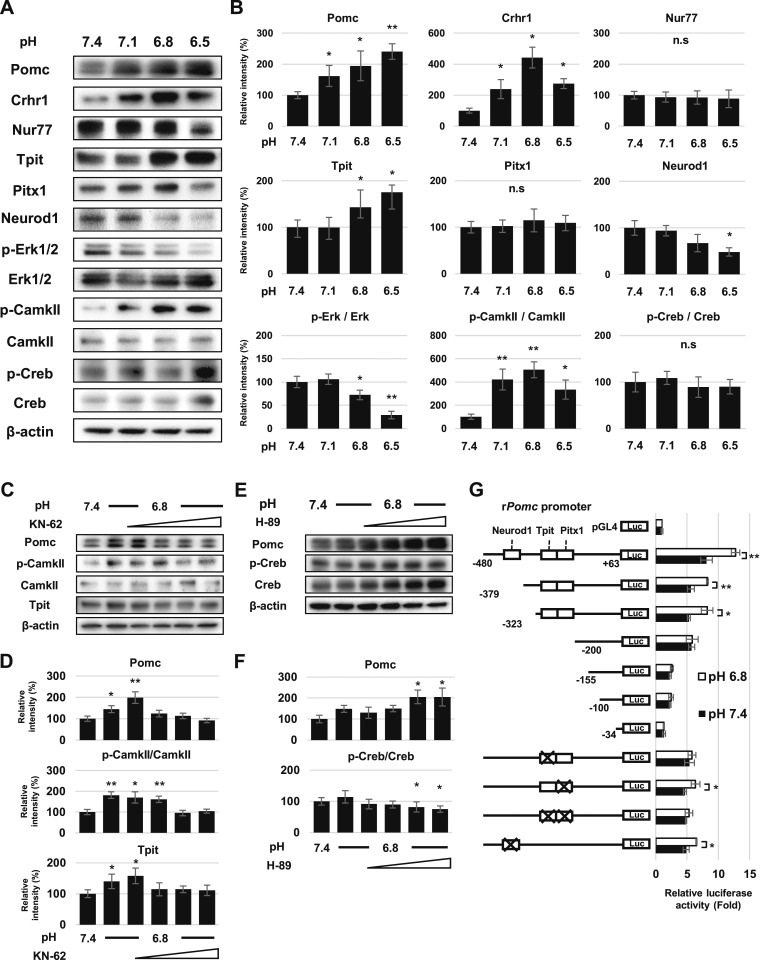
To confirm the RT-PCR findings, we analyzed protein expression by Western blotting. We observed increased Pomc, Crhr1, and Tpit protein expression at low pH, whereas Nur77, Pitx1, and Neurod1 were not increased (Fig. 2A). We next analyzed expression levels and activation of potential pathways that may be involved in proton-sensing signaling. Phosphorylated CamkII (Thr286) expression was increased in acidic pH, but phosphorylated cAMP response element binding protein (Creb; Ser133) and phosphorylated extracellular signal–regulated kinase 1/2 (Erk1/2) were not altered (Fig. 2A and 2B). Because CamkII and Tpit are downstream pathways for Crhr1 signaling (52), we cultured AtT-20 cells in acidic pH medium with CamkII inhibitor KN-62 and observed abrogated Pomc and Tpit increase in acidic pH (Fig. 2C and 2D). The CREB inhibitor H-89 did not block Pomc induction (Fig. 2E and 2F).
Figure 2.
Intracellular signaling to POMC expression in acidic pH. (A) Representative Western blots for Pomc, Crhr1, Nur77, Tpit, Pitx1, Neurod1, phospho-Erk1/2 (p-Erk1/2), Erk1/2, phospho-CamkII (p-CamkII), CamkII, phospho-Creb (p-Creb), Creb, and β-actin in AtT-20 cells after 24-h treatment in pH-adjusted medium. (B) Quantification of each protein level normalized to β-actin in (A). (C) Western blots for p-CamkII, CamkII, Tpit, Pomc, and β-actin in AtT-20 cells after 24-h treatment at pH 7.4 or pH 6.8 with CaMKII inhibitor KN-62. (D) Quantification of each protein level normalized to β-actin in (C). (E) Western blots for phospho-Creb (p-Creb), Creb, Pomc, and β-actin after 24-h treatment in pH 7.4 and pH 6.8 medium with CREB inhibitor H-89. (F) Quantification of each protein level normalized to β-actin in (E). (G) Structures of partially deleted or point mutated luciferase reporter plasmids of the rPomc promoter (–480/+63, –379/+63, –323/+63, –200/+63, –155/+63, –100/+63, –34/+63) in Tpit, Pitx1, Tpit/Pitx1, and Neurod1 (left) and relative luciferase activity normalized to values in AtT-20 cells transfected with pGL4 (right). Results are mean ± SD. *P < 0.05 vs pH 7.4; **P < 0.01 vs pH 7.4. n.s., not significant.
As shown in Fig. 1H and Fig. 2B, as Tpit expression is increased by acidic pH, we analyzed rPomc promoter activity in AtT-20 cells by luciferase reporter assays with a series of 5′-deletion rPomc promoter mutants and point mutations within Tpit, Pix1, Tpit/Pitx1, or Neurod1 response sites. Deletion or mutation of the Tpit response site prevented increased rPomc promoter activity in acidic pH (Fig. 2G).
Taken together, these results indicate that extracellular acidic pH resulted in increased Pomc gene and protein expression. Crhr1 and its downstream signals, including CamkII and Tpit, appear to be necessary for the corticotroph response to acidic pH.
Crhr1 gene KO attenuates POMC expression in acidic pH
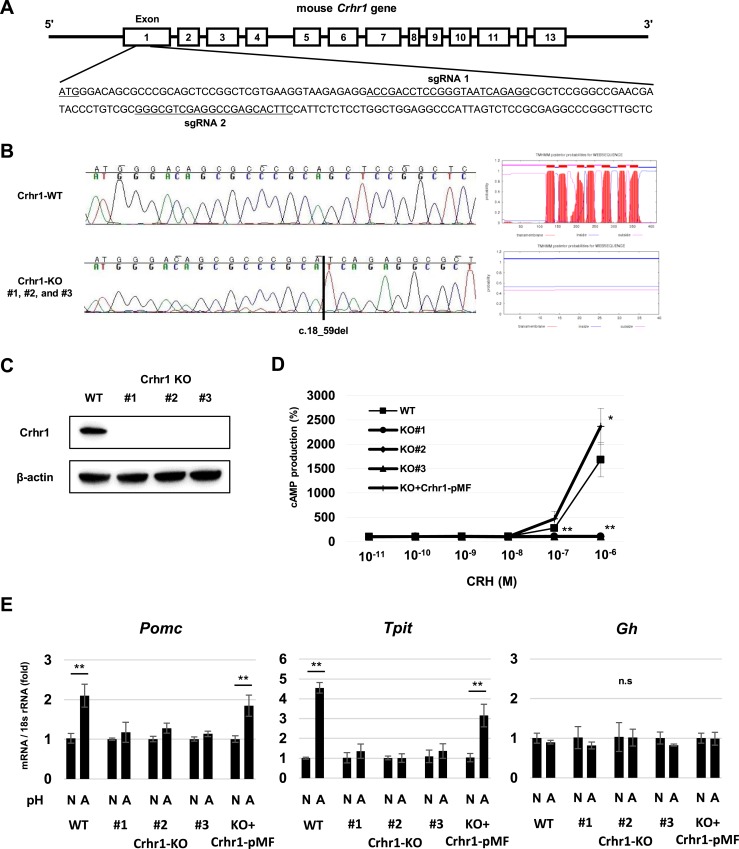
To further investigate effects of CRHR1 on POMC induction under acidic conditions, we established Crhr1-KO AtT-20 mutant cells with CRISPR/Cas9. We designed two sgRNAs targeted to the Crhr1 exon 1 (Fig. 3A) and confirmed gene KO on sequencing, showing c.18_59del in three clones (Fig. 3B). Membrane topology analysis predicted that the gene-edited Crhr1 protein was not located in the cell membrane (Fig. 3B). We also confirmed that expression of mature Crhr1 protein was not detected in all three KO cells by Western blot (Fig. 3C).
Figure 3.
Characteristics of CRHR1-KO AtT-20 cells. (A) Target sequences of sgRNAs for CRISPR/Cas9 gene KO in Crhr1 gene exon 1. (B) Nucleotide sequences of part of Crhr1 exon 1 in WT AtT-20 cells and Crhr-KO AtT-20 cells (left). Schematic membrane topology of Crhr1 protein in WT AtT-20 cells and three Crhr1-KO AtT-20 clones obtained with TMHMM Server version 2.0 (right). (C) Representative Western blots for Crhr1 and β-actin in WT AtT-20 cells and three Crhr1-KO AtT-20 clones (#1, #2, and #3). (D) cAMP levels in WT AtT-20, three Crhr1-KO AtT-20 clones (KO#1, KO#2, KO#3), and Crhr1-KO AtT-20 cells transfected with Crhr1-pMF plasmid (KO+Crhr1-pMF) treated with increasing concentrations of CRH for 30 min. Relative values were calculated separately for each group based on the value of the group treated with 0 M CRH. Results are mean ±SD. *P < 0.05 vs WT; **P < 0.01 vs WT. (E) Quantitative RT-PCR analysis of Pomc, Tpit, and Gh gene expression in WT AtT-20, three clones of Crhr1-KO AtT-20 (#1, #2, #3), and Crhr1-KO AtT-20 cells transfected with Crhr1-pMF plasmid (KO+CRHR1-pMF) after 24-h treatment at normal pH 7.4 (N) and acidic pH 6.8 (A) medium. Results are mean ± SD. *P < 0.05 vs pH 7.4; **P < 0.01 vs pH 7.4. n.s., not significant.
To test Crhr1-KO function, we treated both WT and Crhr1 KO mutants with increasing CRH concentrations and measured cAMP production. As expected, Crhr1-KO cells showed no response to CRH, and the response was rescued with Crhr1 transfection (Fig. 3D). We next cultured the Crhr1-KO mutants with either normal or acidic medium. Although Pomc and Tpit gene expression were not increased in Crhr1-KO AtT-20 cells grown in pH 6.8 after 24 hours, expression increased in both WT and Crhr1-KO cells transfected with Crhr1-pMF (Fig. 3E). Gh gene expression, used as a control, was not changed in acidic pH in either WT or Crhr1-KO clones (Fig. 3E).
These results demonstrate that CRHR1 is necessary for increased POMC abundance observed in acidic conditions.
Reduced response of CRHR1 to CRH in acidic pH
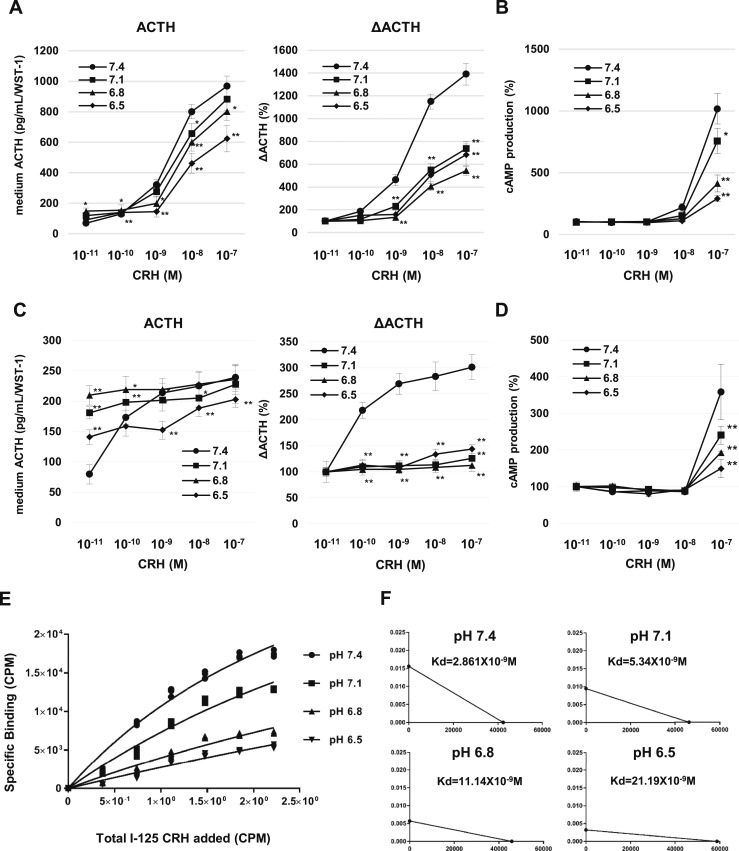
To assess CRHR1 signaling, we measured ACTH and cAMP levels in mouse pituitary cells and in AtT-20 cells treated with increasing concentrations of CRH in normal and acidic medium. After 2 hours exposure to pH 7.4 with CRH, ACTH secretion into the culture medium increased dose dependently with CRH stimulation, but ACTH secretion was not increased in more acidic media (Fig. 4A and 4C). After 30 minutes of treatment with CRH, cAMP levels at pH 7.1, 6.8, and 6.5 were significantly lower than observed at pH 7.4 with 10−7 M CRH (Fig. 4B and 4D).
Figure 4.
CRH binding to CRHR1 in acidic pH. (A) Measurement of ACTH (left) and ΔACTH (right) in the culture medium of primary pituitary cells after 2-h treatment at pH 7.4, 7.1, 6.8, and 6.5 with increasing CRH concentrations. (B) cAMP levels in primary mouse pituitary cells treated in pH-adjusted medium with each respective CRH concentration for 30 min. Relative values were calculated separately for each group based on the value of the group treated with 0 M CRH. (C) Measurement of ACTH (left) and ΔACTH (right) in pH-adjusted culture medium of AtT-20 cells after 2-h treatment with each respective CRH concentration. (D) cAMP levels in AtT-20 cells treated in pH-adjusted medium with each respective CRH concentration. (E) Specific binding of I-125 CRH to CRHR1 in pH-adjusted binding buffers. (F) Scatchard plot analysis of binding assay. Each graph depicts the analysis of the corresponding results for each pH. Kd values are shown in each graph plot area. Results are mean ± SD. *P < 0.05 vs pH 7.4; **P < 0.01 vs pH 7.4.
Using I-125 CRH, we determined CRH receptor binding in acidic pH and immunoprecipitated Crhr1 protein derived from cell lysates with specific CRHR1 antibody. We observed decreased CRH binding to Crhr1 with decreasing pH (Fig. 4E), and by Scatchard analysis, the derived Kd in acidic pH was higher than that at pH 7.4, suggesting attenuated CRH binding affinity to CRHR1 with lower pH (Fig. 4F).
Taken together, these results show that CRHR1 signaling in response to CRH is blunted in acidic pH, implying that other factors may determine induced POMC observed under acidic conditions.
Histidine residues necessary for CRHR1 responses in acidic conditions
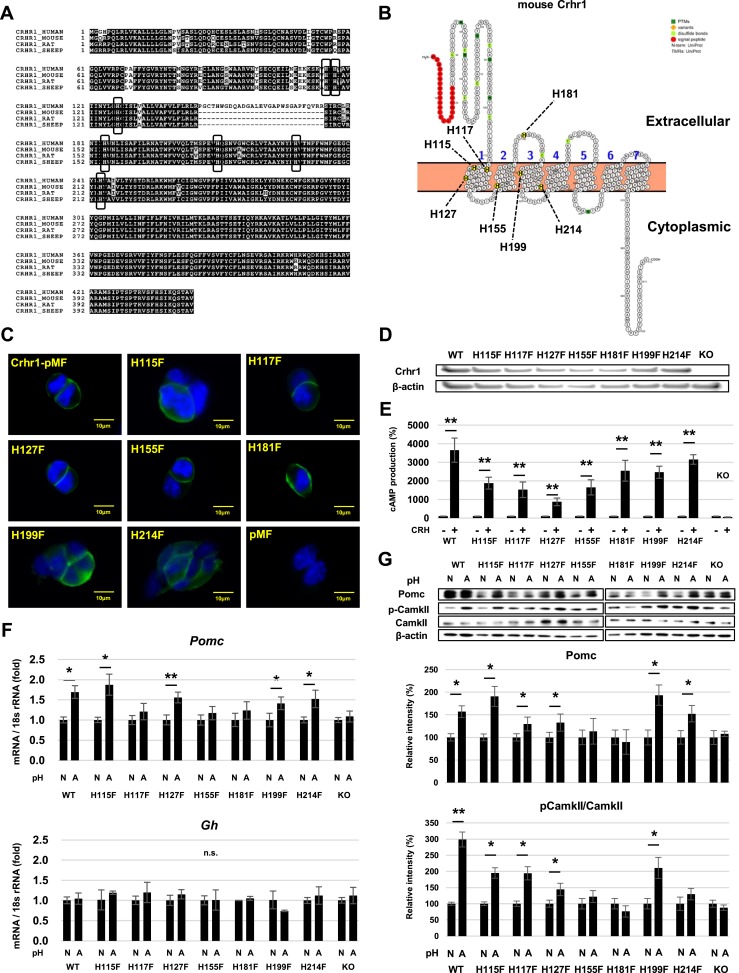
Histidine residues in four proton-sensing G protein–coupled receptors (GPCRs) (GPR4, GPR65, GPR68, and GPR132) are acidic pH sensing (15), and our results suggest that CRHR1 histidine residues may function as proton sensing. We reasoned that if functionally important histidine residues are present in CRHR1, such residues would be evolutionarily conserved. We analyzed Crhr1 homology in different species with T-coffee (49) and noted seven histidine residues conserved in human, rat, mouse, and ovine (Fig. 5A). Mouse Crhr1 membrane topology visualized by Protter (50) showed histidine residues in Crhr1 located within the transmembrane (H115, H117, H127, H155, H199, H214) and extracellular domains (H181) (Fig. 5B). We introduced mutations (His to Phe) in each of seven histidine residues within the Crhr1 gene and cloned into the expression plasmid regulated by αEF1. The resulting plasmid or WT Crhr1 expression plasmid was transfected into Crhr1-KO AtT-20 cells. Transfectants were selected with G418, and WT and mutant Crhr1 expression confirmed with anti-CRHR1 by immunostaining (Fig. 5C) and Western blot (Fig. 5D) as well as by robust cAMP response to CRH (Fig. 5E). When we cultured these transfectants with acidic pH medium, Pomc gene expression was significantly increased in WT, H115F, H127F, and H214F but not in H117F, H155F, H181F, and KO clones (Fig. 5F). Gh gene expression was not changed in pH 6.8 medium (Fig. 5F). Pomc and phospho-CamkII protein expression were increased in WT, H115F, H117F, H127F, and H199F, and Pomc was also increased in H214F, but increased expression was not detected in H155F, H181F, and KO clones (Fig. 5G).
Figure 5.
Effects of histidine residue targeted mutations in CRHR1 on the AtT-20 acid response. (A) Homology of CRHR1 in human, mouse, rat, and sheep. Boxes indicate conserved histidine residues. (B) Schematic of histidine residues in mouse Crhr1 with histidine residues highlighted. Membrane topology model of Crhr1 was generated by Protter version 1.0. (C) Immunocytochemistry of Crhr1-KO cells transfected with Crhr1-pMF, histidine residue mutated Crhr1-pMF (H115F, H117F, H127F, H155F, H181F, H199F, and H214F), or pMF (empty vector) with the antibody for CRHR1 (green, Crhr1; blue, 4′,6-diamidino-2-phenylindole). (D) Western blots for Crhr1 in Crhr1-KO cells transfected with Crhr1-pMF, histidine residue mutated Crhr1-pMF (H115F, H117F, H127F, H155F, H181F, H199F, and H214F), or pMF (empty vector). (E) cAMP levels with (+) or without (−) 10−7 M CRH in Crhr1-KO AtT-20 cells transfected with Crhr1-pMF, histidine residue mutated Crhr1-pMF, or pMF (empty vector). Results are mean ± SD. **P < 0.01 vs no CRH. (F) Quantitative RT-PCR analysis of Pomc and Gh gene expression in Crhr1-KO AtT-20 cells transfected with Crhr1-pMF (WT), histidine residue mutated Crhr1-pMF, or pMF (KO) after 24-h treatment in normal pH 7.4 (N) and acidic pH 6.8 (A) medium. (G) Western blots for Pomc, CamkII, p-CamkII, and β-actin (upper panels) and quantification of protein levels (lower panels) in Crhr1-KO AtT-20 cells transfected with Crhr1-pMF, histidine residue mutated Crhr1-pMF, or pMF after 24-h treatment in normal pH 7.4 (N) and acidic pH 6.8 (A) medium. Results are mean ± SD. *P < 0.05 vs pH 7.4; **P < 0.01 vs pH 7.4. n.s., not significant.
Because mutated CRHR1 histidine residues blunted the AtT-20 cell response to acidic conditions, CRHR1 appears to exhibit proton sensitivity via histidine residues, especially H155 and H181.
Acidic pH induces POMC in nonpituitary cells
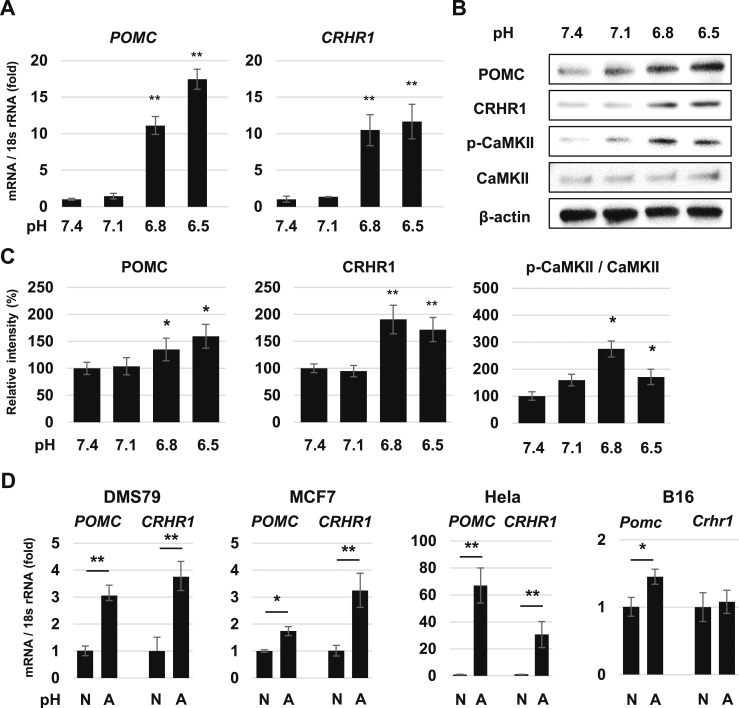
Next, we investigated whether increased POMC expression in acidic pH also occurs in nonpituitary cells. We treated human adenocarcinoma colon tumor COLO320 cells with pH 7.4 medium, and with each respective pH-adjusted acidic medium. POMC and CRHR1 gene expression were increased after 48-hour culture in pH 6.8 and 6.5 compared with levels observed at pH 7.4 (Fig. 6A). POMC, CRHR1, and phospho-CaMKII protein expression were all increased in acidic pH (Fig. 6B and 6C). POMC gene expression was increased at pH 6.8 in other nonpituitary cell lines, including DMS79, MCF7, Hela, and B16. CRHR1 gene expression was increased at pH 6.8 in DMS79, MCF7, and Hela cells but not in B16 cells (Fig. 6D).
Figure 6.
Effects of acidic pH on POMC expression in nonpituitary cell lines. (A) Quantitative RT-PCR analysis of POMC and CRHR1 gene expression in COLO320 cells after 48 h of treatment in pH-adjusted medium. (B) Representative Western blots for POMC, CRHR1, p-CaMKII, CaMKII, and β-actin in COLO320 cells after 48-h treatment in pH-adjusted medium. (C) Quantification of each protein level in (B). (D) Quantitative RT-PCR analysis of POMC and CRHR1 gene expression in DMS79, MCF7, Hela, and B16 cells. Results are mean ± SD. *P < 0.05 vs pH 7.4; **P < 0.01 vs pH 7.4.
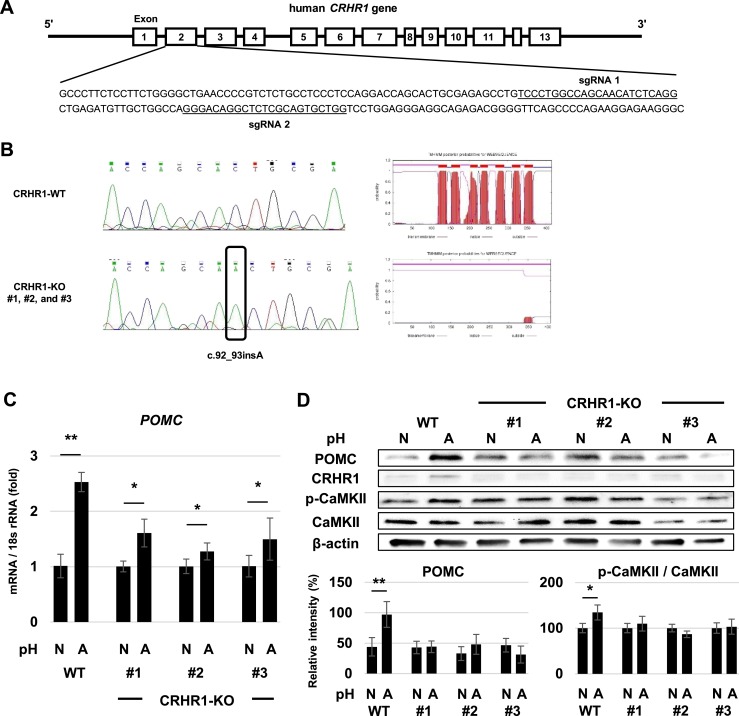
We then established CRHR1-KO COLO320 cells by using CRISPR/Cas9 and cultured them with normal and acidic medium. We designed two sgRNAs targeted to human CRHR1 exon 2 (Fig. 7A) and confirmed gene KO on sequencing, showing c.92_93insA in three clones (Fig. 7B). Membrane topology analysis predicted that the gene-edited CRHR1 protein was not located in the cell membrane (Fig. 7B). POMC gene expression was increased in WT and CRHR1-KO COLO320 cells at pH 6.8 after 48-hour culture, but the percentage increase of POMC expression in CRHR1-KO cells was lower than in WT cells (Fig. 7C). POMC and phospho-CaMKII protein expression were increased at pH 6.8 in WT but not in KO clones, and CRHR1 abundance was increased at pH 6.8 in WT COLO320 cells but not in CRHR1-KO clones (Fig. 7D). These results suggest a mechanism whereby the proton-induced POMC increase in acidic pH is mediated via CRHR1 in nonpituitary cells.
Figure 7.
Characteristics of CRHR1-KO COLO320 cells. (A) Target sequences of sgRNAs for CRISPR/Cas9 gene KO in human CRHR1 gene exon 2. (B) Nucleotide sequences of part of CRHR1 exon 2 in WT COLO320 cells and CRHR1-KO COLO320 cells (left). Schematic membrane topology of CRHR1 protein in WT COLO320 cells and three CRHR1-KO COLO320 clones (#1, #2, #3) obtained with TMHMM Server version 2.0 (right). (C) Quantitative RT-PCR analysis of POMC gene expression after 48-h treatment in normal pH 7.4 (N) and acidic pH 6.8 (A) medium in WT COLO320 cells and three CRHR1-KO COLO320 clones (#1, #2, #3). (D) Representative Western blots for POMC, CRHR1, p-CaMKII, CaMKII, and β-actin in normal pH 7.4 (N) and acidic pH 6.8 (A) medium in WT COLO320 cells and three CRHR1-KO COLO320 clones (#1, #2, #3). Results are mean ± SD. *P < 0.05 vs pH 7.4; **P < 0.01 vs pH 7.4.
Discussion
We show here that POMC expression is induced in an acidic environment. We hypothesized that CRHR1 signaling mediates acid-induced POMC increase, and our results suggest that CRHR1 may function as a proton-sensing GPCR. Furthermore, the corticotroph response to acidic conditions is abrogated in AtT-20 corticotroph cells devoid of CRHR1. We also show the role for protonated CRHR1 histidine residues in activating downstream corticotroph cell signaling, including Pomc, CamkII, and Tpit.
The results shown here are consistent with a prior report of increased Pomc expression in rat pituitary cells grown in acidic pH, probably in response to IL-6 (15). Because we observed that CRH ligand binding affinity to CRHR1 was decreased in acidic pH and that cAMP and ACTH responses to CRH were dampened in acidic pH, we reasoned that other factors may underlie CRHR1 signaling in acidic conditions. Interestingly, the β2 adrenoceptor (AR) is also acid sensitive, and [3H] dihydroalprenolol binding affinity to β2 AR was decreased in acidic pH, whereas β2 AR protonation increased basal receptor activity (53).
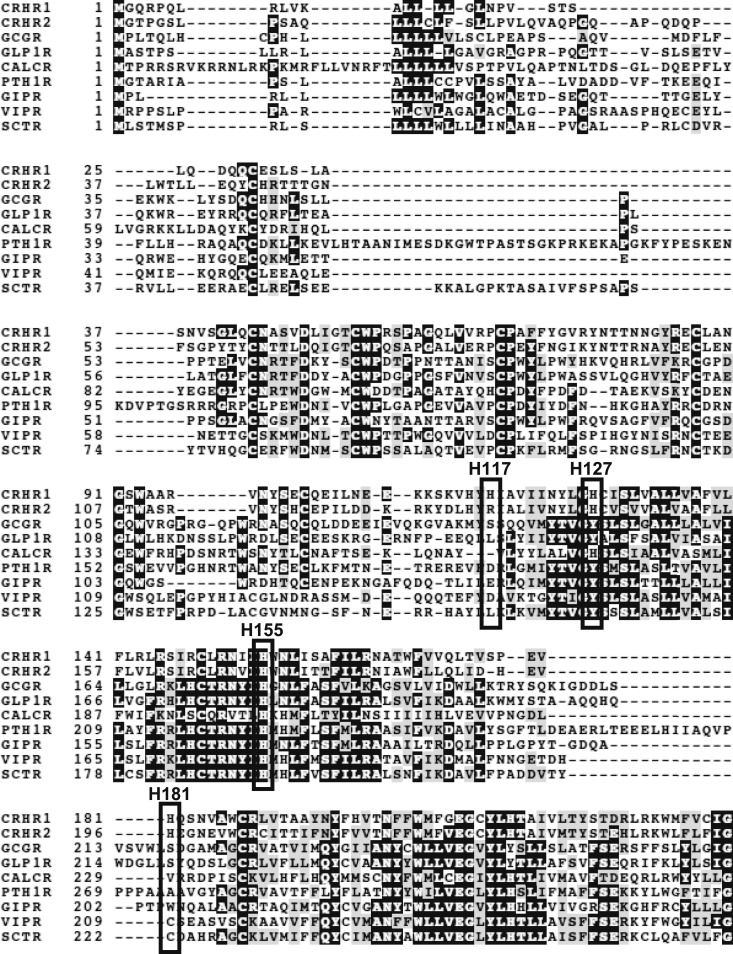
Protonation may switch GPCRs from inactive to active states (54), and proton-sensing GPCRs may be activated by protons binding histidine residues (55). When testing CRHR1 proton sensitivity, we show that H155, H181, and H117 CRHR1 mutants were not activated in acidic pH. CRHR1 histidine residue H155 located in the second transmembrane domain is well conserved in class B GPCRs (Fig. 7). This residue forms a hydrogen bond with glutamate in the third transmembrane domain, and disruption of this polar linkage is predicted to be necessary for CRHR1 activation (56, 57). Moreover, the corresponding histidine residue in glucagon-like peptide-1 receptor is critical for the ligand response (58). These reports endorse our conclusion that protonation of CRHR1 H155 leads to receptor signaling. H181 is not conserved in other class B GPCRs (Fig. 8), and its function in CRHR1 is unknown. Because H181 is located in the second extracellular domain, it could also be protonated in acidic conditions. H117 is related to binding of sauvagine, the CRHR1 antagonist (59), and may also contribute to increased POMC expression in response to acidic conditions.
Figure 8.
Sequence alignment of mouse class B GPCRs. Structure-based alignment of the sequences of mouse class B GPCRs.
CaMKII and Tpit may be downstream signals of CRHR1 in acidic conditions, because CaMKII inhibitor administration, as well as deletion or mutation in the Tpit binding site on the rPomc promoter, abrogated acid-induced POMC. By contrast, CREB was not activated, and a PKA inhibitor did not blunt the POMC increase in acidic pH. CRH signaling through CRHR1 activates cAMP-PKA to induce POMC in pituitary corticotrophs (60), but in other tissues, including uterine myometrium, CRHR1 activates Gq proteins and increases intracellular Ca2+ concentrations (61). Our results indicate that protons activate CRHR1 in the absence of endogenous CRHR1 ligands such as CRH, urocortin 1, and urocortin 2, probably via Ca2+-related pathways including CaMKII and via increased POMC expression.
Several in vivo reports relate to our findings. Metabolic acidosis caused by HCl infusion increased plasma ACTH concentration in fetal sheep (62). Increased rat corticosterone levels induced by NH4Cl infusion were abrogated in hypophysectomized rats (63), suggesting that ACTH increases in vivo with proton loading. Respiratory acidosis caused by hypercapnia also increased plasma ACTH concentration with change of blood pH from 7.5 to 7.35 in ewes (64), dogs (65), and rats (66). In patients with chronic obstructive pulmonary disease, hypoxemia also increased plasma ACTH concentration (67). These reports suggest an ACTH response to acidemia in vivo, and proton sensitivity of CRHR1 may contribute to the responses.
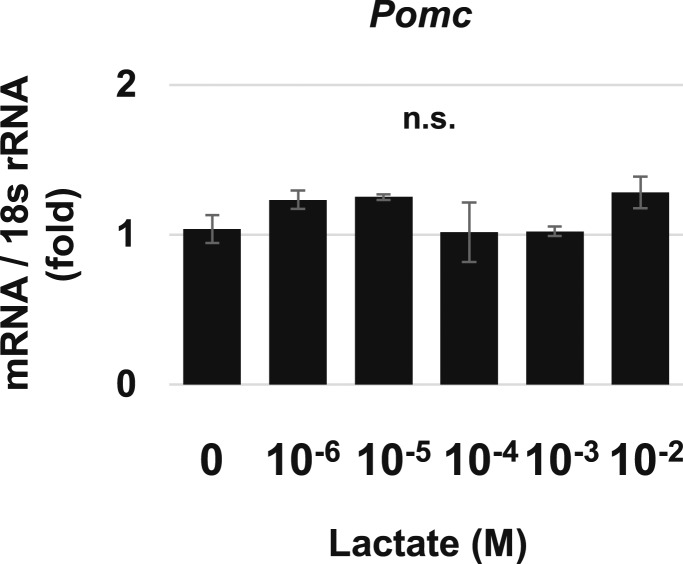
Limitations of this study include the use of HCl to generate acidic medium to evaluate isolated effects of protons on POMC production distinct from lactates and hypoxia, given that microenvironmental lactates and hypoxia are also key factors decreasing pH (2). The lactate receptor (GPR81) reduces intracellular cAMP production (68), but lactates do not activate corticotroph function (69). Both exercise-induced lactate and intravenously infused lactate increase plasma growth hormone and prolactin concentrations in healthy volunteers (70, 71). However, ACTH levels were unchanged when lactate was infused in patients with panic disorder and agoraphobia (72). When we treated AtT-20 cells with increasing lactate concentrations, Pomc gene expression was not enhanced (Fig. 9), consistent with previous reports. Hypoxia response factors, including hypoxia-inducible factor 1-α, could also increase hypothalamic Pomc promoter activity (73). Furthermore, pH sensors other than proton-sensing GPCRs, including acid-sensing ion channels and transient receptor potential vanilloid-1, may also be involved in increased POMC expression in acidic conditions (74).
Figure 9.
Effects of lactate on Pomc gene expression in AtT-20 cells. Quantitative RT-PCR analysis of Pomc gene expression after 24-h treatment with each concentration of lactate in AtT-20 cells. Results are mean ± SD. n.s., not significant.
Our results show that, in acidic pH, protons induce POMC production through histidine residues in CRHR1 and the CaMKII-Tpit pathway. Our results support the notion that microenvironmental protons increased by inflammation may induce expression of POMC and POMC-derived peptides, including ACTH, without CRH ligand stimulation, thereby regulating inflammation and proinflammatory cytokines. Our study implies a feedback loop responsive to acidic conditions engendered by inflammation that is consistent with known cytokine roles in mediating POMC regulation. Because neutralizing tumor pH has been suggested as a treatment of cancer (75) and because CaMKII inhibitors are also potential antineoplastic drugs (76), our study elucidates potential pathway targets for treating disordered ACTH production.
Acknowledgments
We thank Lihua Xia for technical assistance and Shira Berman for assistance with manuscript preparation.
Financial Support: Support provided by National Institutes of Health Grants DK113998 and T32DK007770 (to S.M.) and by the Doris Factor Molecular Endocrinology Laboratory. Funding sources had no role in study design, data collection and analysis, decision to publish, or preparation of the manuscript.
Author Contributions: H.K., M.T., and S.M. conceptualized the project. H.K., M.Y., Y.T., and M.T. performed the experiments and analyzed the data. H.K. drafted the initial manuscript, and H.K., M.T., and S.M. reviewed and edited the manuscript. All authors approved the final manuscript.
Disclosure Summary: The authors have nothing to disclose.
Glossary
Abbreviations:
- AR
adrenoceptor
- CaMKII
calmodulin-dependent protein kinase II
- CRHR1
CRH receptor 1
- GPCR
G protein–coupled receptor
- KO
knockout
- POMC
proopiomelanocortin
- sgRNA
single-guide RNA
- WT
wild type
References
- 1. Lardner A. The effects of extracellular pH on immune function. J Leukoc Biol. 2001;69(4):522–530. [PubMed] [Google Scholar]
- 2. Corbet C, Feron O. Tumour acidosis: from the passenger to the driver’s seat. Nat Rev Cancer. 2017;17(10):577–593. [DOI] [PubMed] [Google Scholar]
- 3. Okajima F. Regulation of inflammation by extracellular acidification and proton-sensing GPCRs. Cell Signal. 2013;25(11):2263–2271. [DOI] [PubMed] [Google Scholar]
- 4. Damaghi M, Wojtkowiak JW, Gillies RJ. pH sensing and regulation in cancer. Front Physiol. 2013;4:370. [DOI] [PMC free article] [PubMed] [Google Scholar]
- 5. Naghavi M, John R, Naguib S, Siadaty MS, Grasu R, Kurian KC, van Winkle WB, Soller B, Litovsky S, Madjid M, Willerson JT, Casscells W. pH Heterogeneity of human and rabbit atherosclerotic plaques; a new insight into detection of vulnerable plaque. Atherosclerosis. 2002;164(1):27–35. [DOI] [PubMed] [Google Scholar]
- 6. Treuhaft PS, McCarty DJ. Synovial fluid pH, lactate, oxygen and carbon dioxide partial pressure in various joint diseases. Arthritis Rheum. 1971;14(4):475–484. [DOI] [PubMed] [Google Scholar]
- 7. Hunt JF, Fang K, Malik R, Snyder A, Malhotra N, Platts-Mills TA, Gaston B. Endogenous airway acidification. Implications for asthma pathophysiology. Am J Respir Crit Care Med. 2000;161(3 Pt 1):694–699. [DOI] [PubMed] [Google Scholar]
- 8. Bicknell AB. The tissue-specific processing of pro-opiomelanocortin. J Neuroendocrinol. 2008;20(6):692–699. [DOI] [PubMed] [Google Scholar]
- 9. Delgado R, Carlin A, Airaghi L, Demitri MT, Meda L, Galimberti D, Baron P, Lipton JM, Catania A. Melanocortin peptides inhibit production of proinflammatory cytokines and nitric oxide by activated microglia. J Leukoc Biol. 1998;63(6):740–745. [DOI] [PubMed] [Google Scholar]
- 10. Lin X, Chen W, Wei F, Zhou BP, Hung MC, Xie X. POMC maintains tumor-initiating properties of tumor tissue-derived long-term-cultured breast cancer stem cells. Int J Cancer. 2017;140(11):2517–2525. [DOI] [PubMed] [Google Scholar]
- 11. Hao L, Zhao X, Zhang B, Li C, Wang C. Positive expression of pro-opiomelanocortin (POMC) is a novel independent poor prognostic marker in surgically resected non-small cell lung cancer. Tumour Biol. 2015;36(3):1811–1817. [DOI] [PubMed] [Google Scholar]
- 12. Chen R, Lewis KA, Perrin MH, Vale WW. Expression cloning of a human corticotropin-releasing-factor receptor. Proc Natl Acad Sci USA. 1993;90(19):8967–8971. [DOI] [PMC free article] [PubMed] [Google Scholar]
- 13. Kovalovsky D, Refojo D, Liberman AC, Hochbaum D, Pereda MP, Coso OA, Stalla GK, Holsboer F, Arzt E. Activation and induction of NUR77/NURR1 in corticotrophs by CRH/cAMP: involvement of calcium, protein kinase A, and MAPK pathways. Mol Endocrinol. 2002;16(7):1638–1651. [DOI] [PubMed] [Google Scholar]
- 14. Drouin J. 60 YEARS OF POMC: Transcriptional and epigenetic regulation of POMC gene expression. J Mol Endocrinol. 2016;56(4):T99–T112. [DOI] [PubMed] [Google Scholar]
- 15. Horiguchi K, Higuchi M, Yoshida S, Nakakura T, Tateno K, Hasegawa R, Takigami S, Ohsako S, Kato T, Kato Y. Proton receptor GPR68 expression in dendritic-cell-like S100β-positive cells of rat anterior pituitary gland: GPR68 induces interleukin-6 gene expression in extracellular acidification. Cell Tissue Res. 2014;358(2):515–525. [DOI] [PubMed] [Google Scholar]
- 16. Axelrod J, Reisine TD. Stress hormones: their interaction and regulation. Science. 1984;224(4648):452–459. [DOI] [PubMed] [Google Scholar]
- 17.RRID:CVCL_4109.
- 18.RRID:CVCL_0219.
- 19.RRID:CVCL_1178.
- 20.RRID:CVCL_0031.
- 21.RRID:CVCL_0030.
- 22.RRID:CVCL_0604.
- 23. Tone Y, Kidani Y, Ogawa C, Yamamoto K, Tsuda M, Peter C, Waldmann H, Tone M. Gene expression in the Gitr locus is regulated by NF-κB and Foxp3 through an enhancer. J Immunol. 2014;192(8):3915–3924. [DOI] [PMC free article] [PubMed] [Google Scholar]
- 24. Labun K, Montague TG, Gagnon JA, Thyme SB, Valen E. CHOPCHOP v2: a web tool for the next generation of CRISPR genome engineering. Nucleic Acids Res. 2016;44(W1):W272–W276. [DOI] [PMC free article] [PubMed] [Google Scholar]
- 25. Ran FA, Hsu PD, Wright J, Agarwala V, Scott DA, Zhang F. Genome engineering using the CRISPR-Cas9 system. Nat Protoc. 2013;8(11):2281–2308. [DOI] [PMC free article] [PubMed] [Google Scholar]
- 26.RRID:AB_476692.
- 27.RRID:AB_445534.
- 28.RRID:AB_777375.
- 29.RRID:AB_10744295.
- 30.RRID:AB_673600.
- 31.RRID:AB_10644125.
- 32.RRID:AB_10859664.
- 33.RRID:AB_470254.
- 34.RRID:AB_330744.
- 35.RRID:AB_331646.
- 36.RRID:AB_10858949.
- 37.RRID:AB_2561044.
- 38.RRID:AB_2067938.
- 39.RRID:AB_2275070.
- 40. Lamolet B, Pulichino AM, Lamonerie T, Gauthier Y, Brue T, Enjalbert A, Drouin J. A pituitary cell-restricted T box factor, Tpit, activates POMC transcription in cooperation with Pitx homeoproteins. Cell. 2001;104(6):849–859. [DOI] [PubMed] [Google Scholar]
- 41.RRID:AB_2099233.
- 42.RRID:AB_330924.
- 43.RRID:AB_92411.
- 44. Fukuoka H, Cooper O, Ben-Shlomo A, Mamelak A, Ren SG, Bruyette D, Melmed S. EGFR as a therapeutic target for human, canine, and mouse ACTH-secreting pituitary adenomas. J Clin Invest. 2011;121(12):4712–4721. [DOI] [PMC free article] [PubMed] [Google Scholar]
- 45. Araki T, Liu NA, Tone Y, Cuevas-Ramos D, Heltsley R, Tone M, Melmed S. E2F1-mediated human POMC expression in ectopic Cushing’s syndrome. Endocr Relat Cancer. 2016;23(11):857–870. [DOI] [PMC free article] [PubMed] [Google Scholar]
- 46.RRID:AB_673600.
- 47.RRID:AB_2534102.
- 48. Wynn PC, Aguilera G, Morell J, Catt KJ. Properties and regulation of high-affinity pituitary receptors for corticotropin-releasing factor. Biochem Biophys Res Commun. 1983;110(2):602–608. [DOI] [PubMed] [Google Scholar]
- 49. Notredame C, Higgins DG, Heringa J. T-Coffee: a novel method for fast and accurate multiple sequence alignment. J Mol Biol. 2000;302(1):205–217. [DOI] [PubMed] [Google Scholar]
- 50. Omasits U, Ahrens CH, Müller S, Wollscheid B. Protter: interactive protein feature visualization and integration with experimental proteomic data. Bioinformatics. 2014;30(6):884–886. [DOI] [PubMed] [Google Scholar]
- 51. Krogh A, Larsson B, von Heijne G, Sonnhammer EL. Predicting transmembrane protein topology with a hidden Markov model: application to complete genomes. J Mol Biol. 2001;305(3):567–580. [DOI] [PubMed] [Google Scholar]
- 52. Murakami I, Takeuchi S, Kudo T, Sutou S, Takahashi S. Corticotropin-releasing hormone or dexamethasone regulates rat proopiomelanocortin transcription through Tpit/Pitx-responsive element in its promoter. J Endocrinol. 2007;193(2):279–290. [DOI] [PubMed] [Google Scholar]
- 53. Ghanouni P, Schambye H, Seifert R, Lee TW, Rasmussen SG, Gether U, Kobilka BK. The effect of pH on beta(2) adrenoceptor function. Evidence for protonation-dependent activation. J Biol Chem. 2000;275(5):3121–3127. [DOI] [PubMed] [Google Scholar]
- 54. Zhang XC, Sun K, Zhang L, Li X, Cao C. GPCR activation: protonation and membrane potential. Protein Cell. 2013;4(10):747–760. [DOI] [PMC free article] [PubMed] [Google Scholar]
- 55. Ludwig MG, Vanek M, Guerini D, Gasser JA, Jones CE, Junker U, Hofstetter H, Wolf RM, Seuwen K. Proton-sensing G-protein-coupled receptors. Nature. 2003;425(6953):93–98. [DOI] [PubMed] [Google Scholar]
- 56. Wootten D, Simms J, Miller LJ, Christopoulos A, Sexton PM. Polar transmembrane interactions drive formation of ligand-specific and signal pathway-biased family B G protein-coupled receptor conformations. Proc Natl Acad Sci USA. 2013;110(13):5211–5216. [DOI] [PMC free article] [PubMed] [Google Scholar]
- 57. Singh R, Ahalawat N, Murarka RK. Activation of corticotropin-releasing factor 1 receptor: insights from molecular dynamics simulations. J Phys Chem B. 2015;119(7):2806–2817. [DOI] [PubMed] [Google Scholar]
- 58. Yin Y, de Waal PW, He Y, Zhao LH, Yang D, Cai X, Jiang Y, Melcher K, Wang MW, Xu HE. Rearrangement of a polar core provides a conserved mechanism for constitutive activation of class B G protein-coupled receptors. J Biol Chem. 2017;292(24):9865–9881. [DOI] [PMC free article] [PubMed] [Google Scholar]
- 59. Assil-Kishawi I, Samra TA, Mierke DF, Abou-Samra AB. Residue 17 of sauvagine cross-links to the first transmembrane domain of corticotropin-releasing factor receptor 1 (CRFR1). J Biol Chem. 2008;283(51):35644–35651. [DOI] [PMC free article] [PubMed] [Google Scholar]
- 60. Bonfiglio JJ, Inda C, Refojo D, Holsboer F, Arzt E, Silberstein S. The corticotropin-releasing hormone network and the hypothalamic-pituitary-adrenal axis: molecular and cellular mechanisms involved. Neuroendocrinology. 2011;94(1):12–20. [DOI] [PubMed] [Google Scholar]
- 61. You X, Gao L, Liu J, Xu C, Liu C, Li Y, Hui N, Gu H, Ni X. CRH activation of different signaling pathways results in differential calcium signaling in human pregnant myometrium before and during labor. J Clin Endocrinol Metab. 2012;97(10):E1851–E1861. [DOI] [PubMed] [Google Scholar]
- 62. Wood CE, Chen HG. Acidemia stimulates ACTH, vasopressin, and heart rate responses in fetal sheep. Am J Physiol. 1989;257(2 Pt 2):R344–R349. [DOI] [PubMed] [Google Scholar]
- 63. Welbourne TC. Acidosis activation of the pituitary-adrenal-renal glutaminase I axis. Endocrinology. 1976;99(4):1071–1079. [DOI] [PubMed] [Google Scholar]
- 64. Chen HG, Wood CE. The adrenocorticotropic hormone and arginine vasopressin responses to hypercapnia in fetal and maternal sheep. Am J Physiol. 1993;264(2 Pt 2):R324–R330. [DOI] [PubMed] [Google Scholar]
- 65. Raff H, Shinsako J, Keil LC, Dallman MF. Vasopressin, ACTH, and corticosteroids during hypercapnia and graded hypoxia in dogs. Am J Physiol. 1983;244(5):E453–E458. [DOI] [PubMed] [Google Scholar]
- 66. Raff H, Roarty TP. Renin, ACTH, and aldosterone during acute hypercapnia and hypoxia in conscious rats. Am J Physiol. 1988;254(3 Pt 2):R431–R435. [DOI] [PubMed] [Google Scholar]
- 67. Raff H, Levy SA. Renin-angiotensin II-aldosterone and ACTH-cortisol control during acute hypoxemia and exercise in patients with chronic obstructive pulmonary disease. Am Rev Respir Dis. 1986;133(3):396–399. [DOI] [PubMed] [Google Scholar]
- 68. Morland C, Lauritzen KH, Puchades M, Holm-Hansen S, Andersson K, Gjedde A, Attramadal H, Storm-Mathisen J, Bergersen LH. The lactate receptor, G-protein-coupled receptor 81/hydroxycarboxylic acid receptor 1: expression and action in brain. J Neurosci Res. 2015;93(7):1045–1055. [DOI] [PubMed] [Google Scholar]
- 69. Petrides JS, Deuster PA, Mueller GP. Lactic acid does not directly activate hypothalamic-pituitary corticotroph function. Proc Soc Exp Biol Med. 1999;220(2):100–105. [DOI] [PubMed] [Google Scholar]
- 70. Elias AN, Wilson AF, Naqvi S, Pandian MR. Effects of blood pH and blood lactate on growth hormone, prolactin, and gonadotropin release after acute exercise in male volunteers. Proc Soc Exp Biol Med. 1997;214(2):156–160. [DOI] [PubMed] [Google Scholar]
- 71. Anton L, Watschinger B, Deuster P, Svoboda T, Clodi M, Chrousos G.. Plasma growth hormone and prolactin responses to graded levels of acute exercise and to a lactate infusion. Neuroendocrinology. 1992;56(1):112–117. [DOI] [PubMed] [Google Scholar]
- 72. Levin AP, Doran AR, Liebowitz MR, Fyer AJ, Gorman JM, Klein DF, Paul SM. Pituitary adrenocortical unresponsiveness in lactate-induced panic. Psychiatry Res. 1987;21(1):23–32. [DOI] [PubMed] [Google Scholar]
- 73. Zhang H, Zhang G, Gonzalez FJ, Park SM, Cai D. Hypoxia-inducible factor directs POMC gene to mediate hypothalamic glucose sensing and energy balance regulation [published correction appears in PLoS Biol. 2016;14(3):e1002428] PLoS Biol. 2011;9(7):e1001112. [DOI] [PMC free article] [PubMed] [Google Scholar]
- 74. Holzer P. Acid-sensitive ion channels and receptors. Handb Exp Pharmacol. 2009;194:283–332. [DOI] [PMC free article] [PubMed] [Google Scholar]
- 75. Pilon-Thomas S, Kodumudi KN, El-Kenawi AE, Russell S, Weber AM, Luddy K, Damaghi M, Wojtkowiak JW, Mulé JJ, Ibrahim-Hashim A, Gillies RJ. Neutralization of tumor acidity improves antitumor responses to immunotherapy [published correction appears in Cancer Res. 2017;77(9):2552] Cancer Res. 2016;76(6):1381–1390. [DOI] [PMC free article] [PubMed] [Google Scholar]
- 76. Wang YY, Zhao R, Zhe H. The emerging role of CaMKII in cancer. Oncotarget. 2015;6(14):11725–11734. [DOI] [PMC free article] [PubMed] [Google Scholar]


