Abstract
Background
We assessed the feasibility of utilizing previously acquired computed tomography angiography (CTA) with a subsequent PET-only scan for the quantitative evaluation of 18F-NaF PET coronary uptake.
Methods & Results
Forty-five patients (age 67.1±6.9 years, 76% males) underwent CTA (CTA1) and combined 18F-NaF PET/CTA (CTA2) imaging within 14[10,21] days. We fused CTA1 from visit one with 18F-NaF PET (PET) from visit two and compared visual pattern of activity, maximal standard uptake values (SUVmax) and target to background (TBR) measurements on (PET/CTA1) fused versus hybrid (PET/CTA2).
On PET/CTA2, 226 coronary plaques were identified. Fifty-eight coronary segments from 28(62%) patients had high 18F-NaF uptake (TBR>1.25), whil 168 segments had lesions with 18F-NaF TBR ≤1.25. Uptake in all lesions was categorized identically on co-registered PET/CTA1. There was no significant difference in 18F-NaF uptake values between PET/CTA1 and PET/CTA2 (SUVmax: 1.16±0.40 vs. 1.15±0.39, p=0.53; TBR:1.10±0.45 vs. 1.09±0.46, p=0.55). The intraclass correlation coefficient for SUVmax and TBR was 0.987 (95%CI 0.983 to 0.991) and 0.986 (95%CI 0.981 to 0.992). There was no fixed or proportional bias between PET/CTA1 and PET/CTA2 for SUVmax and TBR. Cardiac motion correction of PET scans improved reproducibility with tighter 95% limits of agreement (±0.14 for SUVmax and ±0.15 for TBR vs. ±0.20 and ±0.20 on diastolic imaging;p<0.001).
Conclusions
Coronary CTA/PET protocol with CTA first followed by PET-only allows for reliable and reproducible quantification of 18F-NaF coronary uptake. This approach may facilitate selection of high-risk patients for PET-only imaging based on results from prior CTA, providing a practical workflow for clinical application.
Keywords: PET/CT, Coronary imaging, Motion correction, Coronary artery disease, 18F-NaF
Journal Subject Terms: Nuclear Cardiology and PET, Computerized Tomography, Diagnostic Testing
Introduction
Coronary computed tomography angiography (CTA) has emerged as powerful method for accurately assessing coronary artery stenosis and characterizing coronary atherosclerosis, providing a wealth of diagnostic and prognostic information. These anatomic measurements, however, do not provide insight into the activity of the disease and fail to depict the biological processes implicated in plaque rupture 1. Assessment of plaque activity may improve the patient risk prediction provided by CTA. Recently, it was shown that 18F-sodium fluoride (18F-NaF) positron emission tomography (PET) imaging, providing an assessment of developing microcalcification within coronary plaque, might provide such an assessment 2. 18F-NaF PET imaging, however, requires co-registered CTA images for precise anatomical localization of 18F-NaF within coronary plaques 2–6. Increased 18F-NaF uptake has been observed with hybrid PET/CTA to localize in regions of recent plaque rupture in patients with acute myocardial infarction as well as in coronary plaques with high-risk features on intravascular ultrasound in patients with stable coronary artery disease 3. Other PET tracers targeting different aspects of coronary plaque activity are increasingly becoming available 4.
The standard approach used to date for coronary 18F-NaF PET/CT has several limitations which hamper its practical implementation into a meaningful clinical workflow 5. Studies to date have utilized CTA acquired using hybrid PET/CTA scanner during the same imaging session 2–10. This approach, however, does not lend itself to patient selection for imaging based on prior CTA findings. If the 18F-NaF imaging becomes part of a clinical assessment strategy, it is likely that patients would be selected for 18F-NaF PET based on the findings of a CTA performed for clinical purposes 11,12. Another key limitation of the single-session hybrid PET/CTA protocol is that it may not allow for the use of optimal CT equipment for CTA which may only be available on standalone CT scanners. Finally, the use of hybrid PET/CTA requires multi-faceted staff expertise in both PET and coronary CTA during a single session. To address these limitations, we assessed the feasibility of utilizing a previously acquired CTA with a subsequent PET-only coronary scan for the evaluation of coronary 18F-NaF PET uptake.
Methods
Study population
We analyzed scans of patients with stable coronary artery disease who first underwent CTA (CTA1) followed by a hybrid 18F-NaF PET of the coronary arteries with second CTA (CTA2). We analyzed data from two cohorts of patients. Cohort 1 consisted of 20 subjects who underwent CTA 1 and hybrid PET/CTA on the same scanner within 14 days. Cohort 2 consisted of 25 patients whose initial CTA acquisition was performed on a standalone CT and had hybrid PET/CTA in a median of 17 days [14–37] after CTA 1. All subjects had angiographically proven multivessel coronary artery disease (defined as at least two major epicardial vessels with any combination of either >50% luminal stenosis, or previous revascularization (percutaneous coronary intervention or coronary artery bypass graft surgery). Exclusion criteria included an acute coronary syndrome within the previous 12 months, renal dysfunction (eGFR ≤30 mL/min/1.73 m2) and contraindication to iodinated contrast agents. The study was approved by the investigational review board, and written informed consent was obtained from all subjects. Study data can be made available to other researchers on request to the corresponding author.
Image acquisition and reconstruction
Initial Coronary CTA
Cohort 1 had the CTA1 scan performed on the 128-slice Biograph mCT scanner (Siemens Medical Systems, Erlangen, Germany) during held expiration using the following settings: 330 ms rotation time, 100 or 120kV (depending on body mass index), 160–245 mAs. Cohort 2 underwent a deep-inspiration CTA1 on a dual source CT scanner (Definition; Siemens Medical Systems, Erlangen, Germany). The scan parameters were as follows: 330 ms gantry rotation time, reference tube current of 400 mAs per rotation, and a peak tube voltage of 120 kV. Patients in both cohorts received beta blockers (orally or intravenously) to achieve a target heart rate <60beats/min and sublingual nitrates. A bolus of 60–100 mL of contrast (300–400 mgI/mL; Iomeron) was power injected intravenously at 6 mL/s, after determining the appropriate trigger delay with a test bolus of 20 mL contrast. Transverse images were reconstructed with 0.75/0.6 mm slice thickness, 0.4 mm increment and a medium-soft convolution kernel.
18F-NaF PET /CTA
Prior to the PET imaging, 250 MBq of 18F-sodium fluoride was injected intravenously and patients rested in a quiet environment for 60 minutes. Because emission scanning was followed by CTA during that hour subjects were administered with beta-blockers. Imaging was performed on 2 different PET/CTA scanners 128-slice Biograph mCT, Siemens Medical Systems (Cohort 1) and 128-slice Discovery 710 (GE Healthcare, Milwaukee, WI, USA (Cohort 2). In both cohorts low-dose CT attenuation correction (AC) scan (120 kV, 50 mAs, 3 mm slice thickness), a 30-min single bed position PET acquisition with ECG-gating in list mode was performed. Image corrections were applied for attenuation, dead time, scatter, and random coincidences. In Cohort 1 PET data were reconstructed using a Siemens implementation of iterative reconstruction algorithm (Ultra-HD; with Point Spread function correction and time of flight reconstruction, matrix 256, Gaussian filter of 5 mm and 2 iterations and 21 subsets). In Cohort 2 data were reconstructed with GE implementation of iterative reconstruction algorithm (Sharp IR with Point Spread function correction and time of flight reconstruction, matrix 256, Gaussian filter of 5 mm and 4 iterations and 24 subsets)13.
In both cohorts, a second CTA (CTA2) was obtained on the hybrid scanner with patient remaining on the table in the same position as during emission scanning. In Cohort 1 (Siemens Biograph mCT) imaging was performed on the same scanner and according to the same protocol as CTA1. In Cohort 2 (GE Discovery 710) CTA2 was acquired with rotation time 350ms, tube voltage 120 kV, tube current 150–250 mAs) and reconstructed with 0.625 mm thick slices, a 0.625 mm increment and a medium-soft convolution kernel.
Image analysis
Cardiac motion correction
In addition to assessing diastolic PET data, we also analyzed cardiac motion corrected 18F-NaF PET images. This technique compensates for coronary artery motion by aligning all cardiac gates to the reference gate (the one which is used for PET and CTA co-registration - see below). This approach was shown to reduce image noise and improve target to background ratios 14. To perform cardiac motion correction in the first step coronary artery centerlines were extracted from coronary CTA by applying a vessel tracking algorithm based on Bayesian maximal paths using dedicated software (Autoplaque version 2.0, Cedars Sinai Medical Center). Secondly, a diffeomorphic mass-preserving image registration algorithm was used to align the gates of PET data to the end-diastolic (reference) gate 14. As a result, all gates were summed back together providing a motion-free image containing counts from the entire duration of PET acquisition.
Image registration
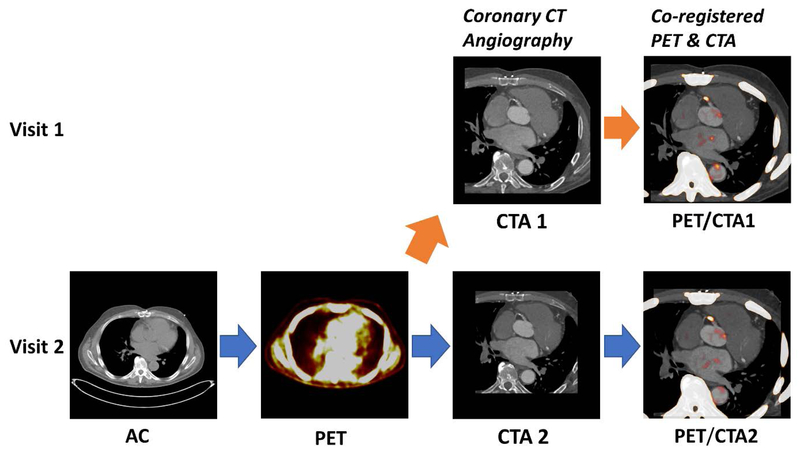
Image registration was performed using FusionQuant Software (Cedars Sinai Medical Center, Los Angeles). PET and CTA reconstructions were reoriented, fused and carefully co-registered in all 3 planes (a X-Y-Z translation was performed) as described previously 8, 9. Key points of reference were the sternum, vertebrae, blood pool in the left and right ventricle (based upon high 18F-fluoride activity in the blood pool in comparison to the surrounding myocardium) and the great vessels. We fused CTA1 from the first visit with PET and also separately fused CTA2 with PET. Although CTA2 was obtained at the same imaging session as PET on the hybrid scanner, co-registration was performed to account for any possible patient motion between PET and CTA2. Both CTA1 and CTA2 were co-registered to PET in an identical fashion (Figure 1). This way, we could compare directly a clinical protocol using a CTA scan acquired up to 4 weeks before a PET-only 18NaF scan, with a standard hybrid 18NaF-CTA protocol in individual patients. To assess interobserver reproducibility of the CTA and PET registration both datasets of cohort 1 patients were fused and reoriented by 2 experienced observers (imaging cardiologists) blinded to each other’s adjustments.
Figure 1. Utilization of prior coronary CT angiography for the assessment 18F-NaF PET coronary uptake.
We fused (orange arrow) the CTA from the first visit (CTA1) with an 18F-NaF PET from the second visit (PET). The PET/CTA imaging session comprised the acquisition of a low-dose attenuation correction scan (AC) followed by a 30min long PET registration (PET) and finally the coronary CT angiography (CTA).
18F-NaF PET quantification
After registration of CTA1 and CTA2 to the PET, plaque activity was measured by defining 3-dimensional volumes of interest (spheres with a 5mm radius) around coronary plaques on both the fused PET/CTA2 and PET/CTA1 images. The maximum standard uptake value (SUVmax) was recorded from each coronary segment that had a diameter of at least 2 mm and included coronary atheroma with a >25% stenosis on CTA and had not been stented previously. Background blood pool activity was measured by delimiting a spherical volume of interest (radius 10–15 mm depending on atrium size) in the middle of the left atrium. Target to background ratios (TBRs) were calculated by dividing SUVmax by averaged background blood pool activity. To categorize lesions according to PET tracer uptake, we utilized the previously validated methodology 2, 3. In brief, plaques were considered to have high uptake if they presented with focal tracer uptake which followed the course of the vessel over more than one slice and their TBR on diastolic imaging was >1.25. Image noise was defined as the mean standard deviation of the blood pool activity. Signal to noise ratio was defined as the plaque SUVmax divided by image noise. To assess interobserver reproducibility of the uptake measurements on the PET/CTA1 datasets coronary 18F-NaF activity of cohort 1 patients was assessed by 2 experienced observers (imaging cardiologists) blinded to each other’s delineations.
Reproducibility analysis
Image analysis of PET/CTA1 and PET/CTA2 was carried out on diastolic and motion corrected images. To limit the potential for recall bias between PET/CTA1 and PET/CTA2, PET/CTA1 was anonymized against PET/CTA2 and there was at least a three-week interval between reading PET/CTA1 and PET/CTA2 images. For each scan, PET registration and regions of interest were saved using the reference CTA and the same registration position so that the same regions of interest could be measured in the diastolic and motion corrected images. Reproducibility was defined as the difference in PET SUV or TBR measured from PET/CTA1 and PET/CTA2 datasets.
Statistical Analysis
Data was tested for normality using Shapiro Wilks test. Continuous variables were expressed as mean ±standard deviation (SD) or median [interquartile range] and compared with paired Student t or Wilcoxon signed-rank test where appropriate. We presented all categorical variables as percentages and used the chi-square test for comparison. We used Bland-Altman plots to visualize reproducibility of measurements. The 95% normal range for differences between sets of SUV and TBR measurements (the limits of agreement) were estimated by multiplying the SD of the mean difference by 1.96 15. Intra-class correlation coefficients with 95% confidence intervals (CIs) were calculated for PET/CTA1 vs. PET/CTA2 scan variation. The Pitman-Morgan test was used to compare the homogeneity of variance between uptake measurements derived from diastolic gate and motion corrected datasets. In our per lesion analysis we assumed independence of lesions within patients. A 2-sided p value <0.05 was regarded as statistically significant. Statistical analysis was performed with SPSS software (version 24, SPSS, Inc., Chicago, Illinois).
Results
A total of 45 patients (age 67.1±6.9 years, 76% males) underwent CTA1 and a subsequent PET/CT with CTA2 at a median of 14 [10,21] days. All patients had multivessel disease on CTA1 (Table 1).
Table 1.
Patients baseline clinical characteristics
| Cohort 1, n=20 | Cohort 2, n=25 | Study population, n=45 | |
|---|---|---|---|
| Demographics | |||
| Age (years) | 69.5±7.3 | 65.0±6.1 | 67.1±6.9 |
| Gender (male) | 17 (85%) | 17 (68%) | 34 (76%) |
| Height (cm) | 173.0±9.4 | 168.0±6.4 | 170.3±8.7 |
| Weight (kg) | 82.9±17.1 | 73.9±14.8 | 78.1±16.2 |
| Cardiovascular risk factors | |||
| Diabetes | 2 (10%) | 5 (20%) | 7 (16%) |
| Hyperlipidemia | 20 (100%) | 8 (32%) | 28 (62%) |
| Hypertension | 14 (70%) | 15 (60%) | 29 (64%) |
| Tobacco use | 14 (70%) | 7 (28%) | 21 (47%) |
| Family history of coronary heart disease | 12 (60%) | 4 (16%) | 16 (36%) |
| Peripheral vascular disease | 1 (5%) | 1 (4%) | 2 (4%) |
SD= standard deviation.
Image registration
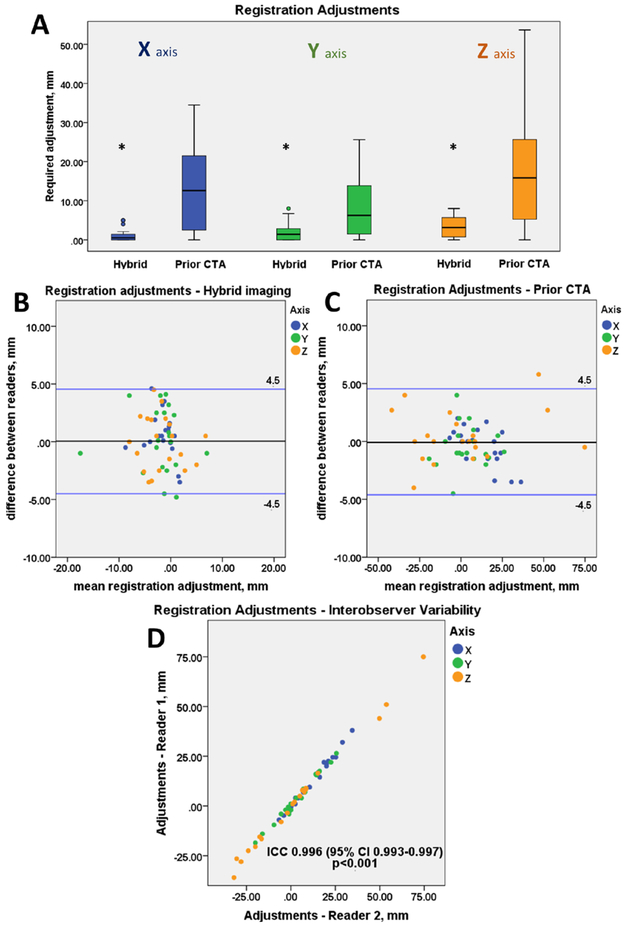
Compared to PET/CTA2 registration, PET/CTA1 registration required larger spatial adjustments in all three axes (0.5 [0.0, 1.5] vs 12.6 [2.5, 21.8] mm, p<0.001; 1.4 [0.0, 2.9] vs 6.3 [1.5, 14.1] mm, p=0.007; 3.2 [0.6, 5.9] vs 15.9 [5.1, 30.3] mm, p= 0.001; for the x, y, z axis respectively) (Figure 2A). The intraclass correlation coefficient for spatial adjustments between two observers was 0.92 (95% CI 0.87 to 0.95) for PET/CTA2 and 0.99 (95% CI 0.993 to 0.997) for PET/CTA1 (Figure 2D). There was no fixed or proportional bias between observers with limits of agreement of ±4.5mm for both the hybrid and the prior CTA dataset (Figure 2). Despite the need for larger adjustments of PET/CTA1 there was no significant difference in the reproducibility of adjustments between both datasets (p=0.76).
Figure 2. Co-registration of 18F-NaF PET and CTA data.
Boxplots presenting the translational adjustments in 3 axes (X,Y,Z) made to the PET images to align the two datasets for CTA (coronary CT angiography) acquired during hybrid PET/CTA session (Hybrid) and for prior-CTA fused with PET-only 18F-NaF scan (Prior CTA). The prior CTA (PET/CTA1) dataset required bigger adjustments than the hybrid – single imaging session (PET/CTA2) dataset (all p<0.01) (A). Bland Altman plots presenting the interobserver variability of the co-registration adjustments of the hybrid (B) and prior CTA (C) datasets. There was no significant difference in the reproducibility of adjustments for hybrid vs prior datasets (p=0.76). Scatter plot presenting the co-registration adjustments made by two independent observers of the prior CTA dataset (D).
18F-NaF PET quantification
Twenty-eight (62%) patients had high 18F-NaF coronary uptake on PET/CTA2. Fifty-eight coronary segments showed high 18F-NaF uptake (TBR>1.25). The remaining 168 segments with at least a 25% CTA stenosis, had PET TBR measurements ≤ 1.25. On PET/CTA1, all interrogated segments were classified identically as on PET/CTA2 (according to the 1.25 TBR cutoff; Figures 1, and S1).
Diastolic imaging
There was no significant difference in SUVmax measurements across all identified lesions (n=226) on PET/CTA2 compared to PET/CTA1 (1.16±0.40 vs 1.15±0.39, p=0.53). Importantly, no significant difference was found when the TBR>1.25 and TBR<1.25 lesions were compared separately (1.71±0.44 vs 1.72±0.45, p=0.47 and 1.03±0.17 vs 1.05±0.18, p=0.48). In a similar fashion, there were no significant differences in measurements of coronary TBR (1.10±0.45 vs 1.09±0.46, p=0.55) or the signal to noise ratio (25.7±12.6 vs. 25.2±11.9, p=0.49).
Motion correction
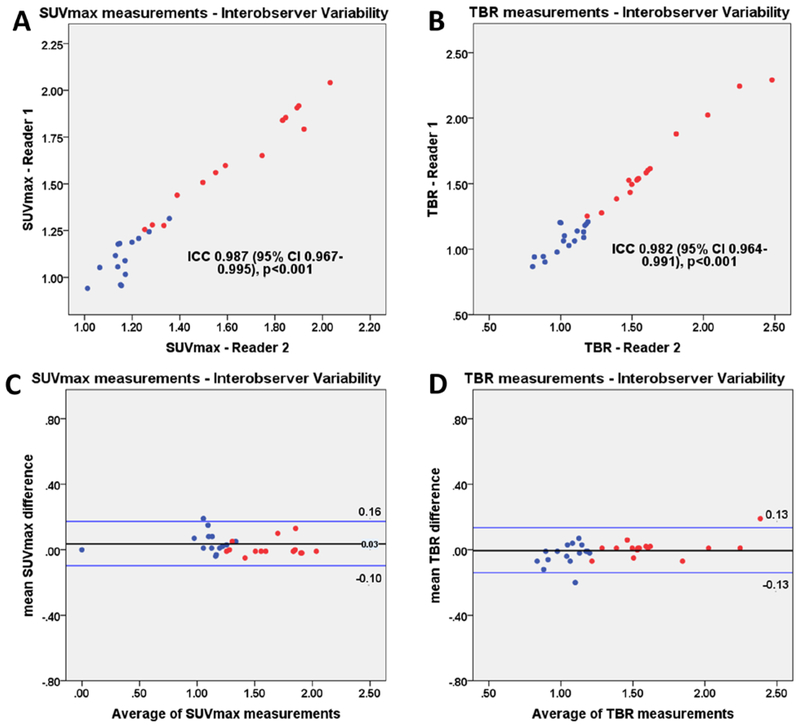
After applying motion correction, the signal to noise ratio improved when compared to diastolic imaging (25.2±11.9 vs 30.8±17.2, p=0.01). On motion corrected images, SUVmax and TBR showed no significant difference between PET/CTA1 and PET/CTA2 (all p>0.40; Tables 2 and 3). The intraclass correlation coefficient for uptake measurements in cohort 1 patients between two independent observers was 0.987 (95% CI 0.96 to 0.99) for SUVmax and 0.982 (95% CI 0.96 to 0.99) for TBR values (Figure 3).
Table 2.
Comparison of 18F-NaF diastolic gate measurements of the hybrid (single session) PET/CTA2 and prior CTA (PET/CTA1) datasets.
| Hybrid | Prior CTA | P value | |
|---|---|---|---|
| Lesion SUVmax | 1.16±0.40 | 1.15±0.39 | 0.53 |
| Lesion with tracer uptake SUVmax | 1.71±0.44 | 1.72±0.45 | 0.47 |
| Lesion w/o tracer uptake SUVmax | 1.03±0.17 | 1.05±0.18 | 0.48 |
| Left atrium (background) | 1.14±0.15 | 1.13±0.16 | 0.63 |
| Background noise | 0.09±0.04 | 0.09±0.04 | 0.71 |
| Target to background ratio for all lesions | 1.10±0.45 | 1.09±0.46 | 0.55 |
| Signal to noise ratio | 25.7±12.6 | 25.2±11.9 | 0.49 |
SUVmax= maximal standard uptake. CTA= coronary CT angiography.
Table 3.
Comparison of 18F-NaF motion corrected measurements of the hybrid (single session) PET/CTA2 and prior CTA (PET/CTA1) datasets.
| Hybrid | Prior CTA | P value | |
|---|---|---|---|
| Lesion SUVmax | 1.12±0.41 | 1.13±0.41 | 0.48 |
| Lesion with tracer uptake SUVmax | 1.61±0.44 | 1.60±0.42 | 0.61 |
| Lesion w/o tracer uptake SUVmax | 1.00±0.15 | 1.01±0.16 | 0.48 |
| Left atrium (background) | 1.13±0.21 | 1.12±0.22 | 0.94 |
| Background noise | 0.07±0.04 | 0.08±0.04 | 0.42 |
| Target to background ratio for all lesions | 1.11±0.49 | 1.10±0.50 | 0.38 |
| Signal to noise ratio | 30.6±18.1 | 30.8±17.2 | 0.85 |
SUVmax= maximal standard uptake. CTA= coronary CT angiography.
Figure 3. Interobserver variability of uptake measurements on prior CTA (PET/CTA1).
Scatter plots and Bland Altman plots of prior CTA (PET/CTA1) SUVmax (a, c) and TBR (b, d) measurements of lesion with (red) and without (blue) increased tracer uptake. SUVmax= maximal standard uptake, TBR = target to background ratio.
Reproducibility of measurements
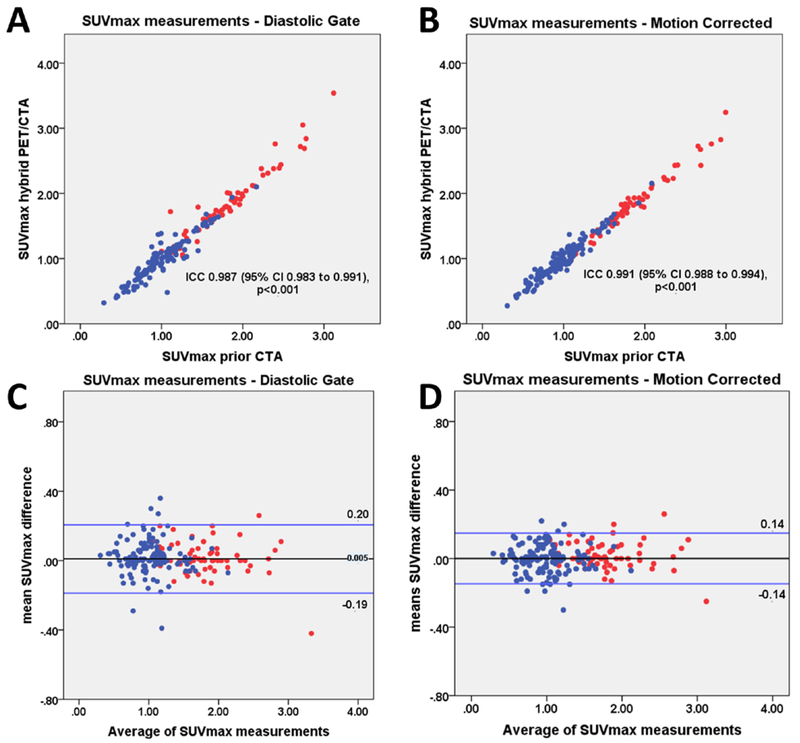
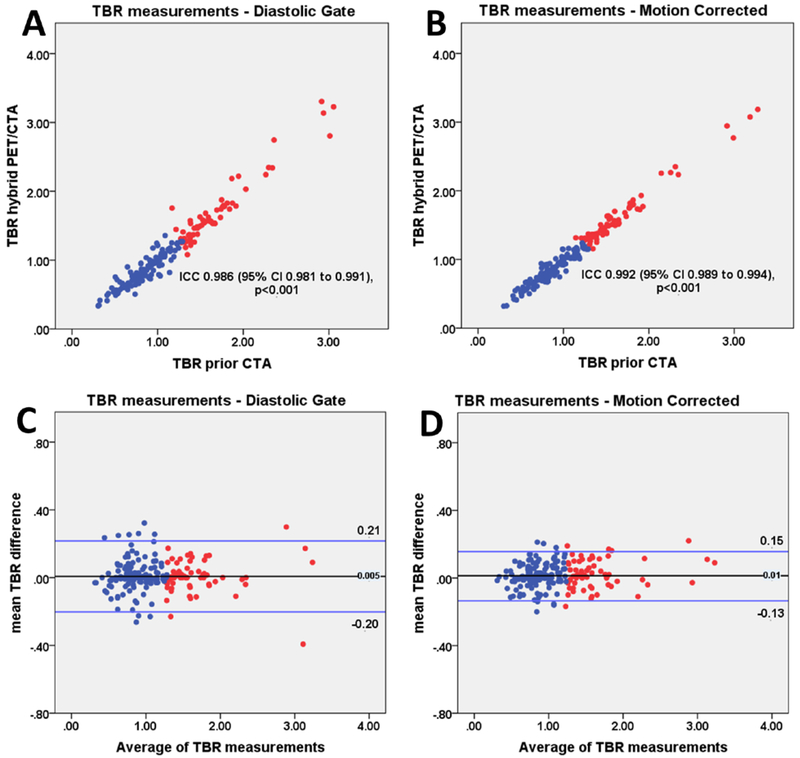
On diastolic imaging the intraclass correlation coefficient for SUVmax and TBR between PET/CTA1 and PET/CTA2 measurements was 0.987 (95% CI 0.983 to 0.991) and 0.986 (95% CI 0.981 to 0.991). There was no fixed or proportional bias between PET/CTA1 and PET/CTA2 with limits of agreement of ±0.20 for SUVmax and ±0.20 for TBR measurements. On motion corrected images the intraclass correlation coefficients for SUVmax and TBR values on PET/CTA1 and PET/CTA2 was 0.991 (95% CI 0.988 to 0.994) and 0.992 (95% CI 0.989 to 0.994). Motion correction improved the reproducibility of measurements between PET/CTA1 and PET/CTA2. Compared to diastolic imaging, the limits of agreement decreased from ±0.20 to ±0.14 for SUVmax and from ±0.20 to ±0.15 for TBR (p<0.001; Figures 4–6).
Figure 4. SUVmax measurements.
Scatter plots and Bland Altman plots of prior CTA (PET/CTA1) and hybrid (PET/CTA2) SUVmax values for diastolic gate (a, c) and motion corrected (b, d) data. SUVmax measurements of lesion with (red) and without (blue) increased tracer uptake are shown. Motion corrected analysis resulted in lower variation of the of SUVmax measurements, as compared to the diastolic gate analysis (p<0.001). SUVmax= maximal standard uptake, CTA=coronary CT angiography, ICC=intraclass correlation coefficient.
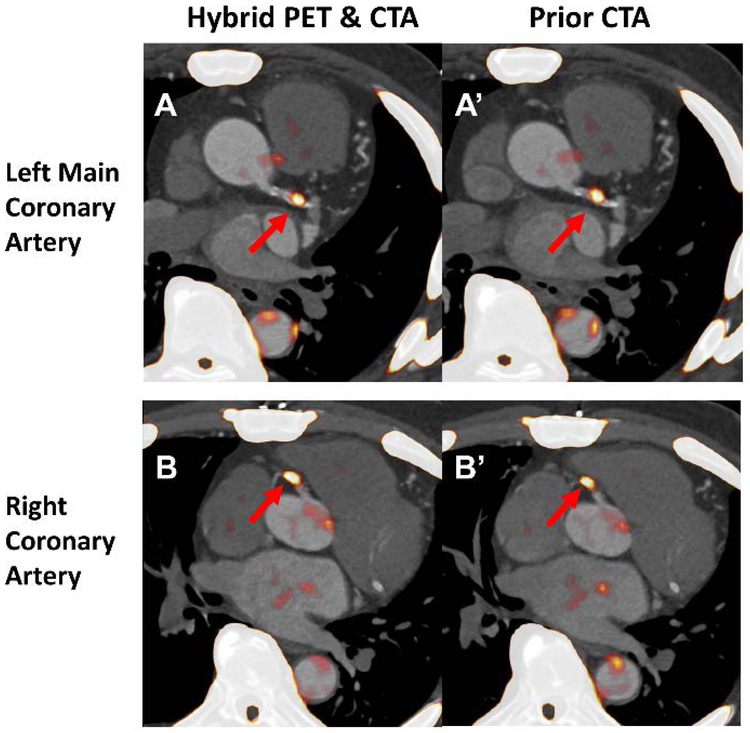
Figure 6. The assessment of coronary 18F-NaF uptake on hybrid (PET/CTA2) and prior CTA (PET/CTA1).
Both datasets were motion corrected after registration of CTA to PET. For the hybrid acquisition the required adjustments were 0.5, 2.5 and 0mm in the x,y and z axis respectively. For prior CTA dataset PET had to be moved by 2.5, 3 and 5mm in the corresponding axes. Lesions with increased tracer uptake were identified in the left main, lesion TBR 1.56 and 1.55 (A and A’) and proximal right coronary artery, lesion TBR 1.60 and 1.60 (B and B’). CTA= coronary CT angiography. TBR= target to background ratio.
Discussion
In this multivendor and multicenter study, we report how utilizing a previously acquired CTA with a subsequent standalone PET-only coronary scan can be used for the evaluation of coronary 18F-NaF PET uptake. On a population comprised of patients who underwent repeat CTA studies on the same PET/CT scanner (cohort 1) and a separate subset that had the initial CTA acquired on a solely CT machine (cohort 2) we show that a prior CTA and subsequent PET-only approach enables equivalent categorization of plaques with increased 18F-NaF activity and accurate quantification of PET uptake. We demonstrate that staged coronary PET and CTA protocols can reliably and reproducibly generate quantitative 18F-NaF PET coronary images, that are enhanced by motion correction.
These findings have important implications for future research and clinical coronary 18F-NaF imaging. The prior CTA and subsequent PET-only acquisition protocol lends itself to a practical clinical workflow, with the initial CTA providing a basis for selection of patient for the coronary PET study. CTA is growing rapidly in a wide variety of clinical settings. Therefore, CTA will likely be the most common basis for selection of patients who might benefit from assessment of disease activity with coronary PET imaging. In this scenario, the requirement for a second CTA obtained at the time of coronary PET imaging would not be practical or economically feasible, and incurs unnecessary additional radiation exposure. In carefully selected populations at exceptionally high risk of adverse events, 18F-NaF PET could provide insight into the biology of atherosclerosis and may prove to be of importance in patient management 16,17. It has been shown that the presence of vulnerable plaque features predicts acute coronary syndromes and in the absence of significant stenosis and coronary calcification, the likelihood of adverse events is very low 7, 18. Therefore, the CTA-first approach could limit unwarranted 18F-NaF PET scans in low risk populations 5 On the other hand, a follow-up standalone 18F-NaF PET scan could be warranted in individuals who present with a very high atherosclerotic plaque burden to differentiate active from burnt out stable disease, or in patients with high risk plaque features such as those with positive remodeling, low attenuation components and the napkin-ring sign on CTA 6.
Importantly, CTA scans acquired on hybrid PET/CT are often of suboptimal quality due to limited CT performance in this configuration. In many PET laboratories, either the PET scanner does not have performance characteristics required for coronary CTA, or a standalone CT scanner with better imaging characteristics for coronary CTA is available. Since coronary CTA is strongly dependent on image quality, the most advanced CT scanners should be used for this application. While the current hybrid PET/CT scanners are at best 128-slice systems, the dedicated CTA equipment can be a 320-slice or dual source (196 slices) setup which can cover the entire heart in one gantry rotation 19,. Further, the scanning protocol for hybrid PET/CTA requires technical staff with expertise in both PET and coronary CTA to be present during a single session. In many centers that offer both PET and CTA scans, the imaging team performing PET studies does not have extensive experience in CTA. Thus, separate technologists with CTA expertise might be required to perform the CTA portion of the PET/CT examination, raising the cost and complexity of the procedure. With the utilization of CTA obtained prior to the 18F-NaF PET, such inconvenience would no longer occur. A prior CTA approach to 18F-NaF PET would also shorten the duration of image acquisition substantially and overall patient radiation exposure by avoiding repetition of the CTA scan.
As expected we observed that larger registration adjustments were needed to achieve perfect alignment of CT acquired during a different imaging session from the PET compared to hybrid PET/CTA acquisition. However, with the image registration approach utilized, all images could be successfully registered and analyzed. Moreover, it is important to realize that even the hybrid PET/CTA approach requires substantial modification of image alignment for adequate co-registration (Figure 2). This is largely due to gross patient motion which occurs during the pause between PET and CTA acquisitions and differences in respiratory patterns. Indeed, no hybrid PET/CTA scan in this study was perfectly co-registered at baseline with each requiring such spatial adjustments.
In patients with multiple foci of increased 18F-NaF activity achieving perfect registration of all lesions can be challenging. In our study, in such cases we observed a maximal misalignment of 5mm (from the center of vessel on CTA to the center of the hot spot on PET. Importantly misalignment was similarly common on both single visit acquisitions and when using prior CTA data. To offset for such issues, for the SUVmax measurements we used a spherical volume of interest (radius 5 mm) which encompasses the plaque in question (as seen on the CTA) and its immediate surroundings. As a result, in our study misregistration of 2–4 mm which can easily occur (Figure 2BC) had no adverse impact on the accuracy of the uptake measurement as shown on the scatterplots with interobserver variability of SUVmax and TBR measurements (Figure 3AB).
The sensitivity of SUVmax measurements on the accuracy of the registration varies from patient to patient and depends on the anatomy. In an ideal scenario (that is when uptake is only present within coronary arteries) since the volumes of interest utilized have a radius of 5 mm misregistration of up to ~5mm will not have an enormous impact. However, in patients with multiple non-coronary uptake foci within that distance from the actual coronary lesions, such misregistration will potentially lead to false positive findings. For instance, when assessing 18F-NaF activity in the left main or mid left anterior descending artery, special care should be taken to avoid assigning uptake originating from the ascending aorta and main pulmonary artery to the coronaries. Likewise, extra-coronary foci of uptake (in patients who suffered from pericardial, aortic or mitral disease which resulted in calcification outside of coronary arteries) need to be distinguished. Without anatomical reference provided by CTA accurate quantification of uptake is impossible as increased tracer activity of non-coronary microcalcifications can be erroneously classified (Figure 7).
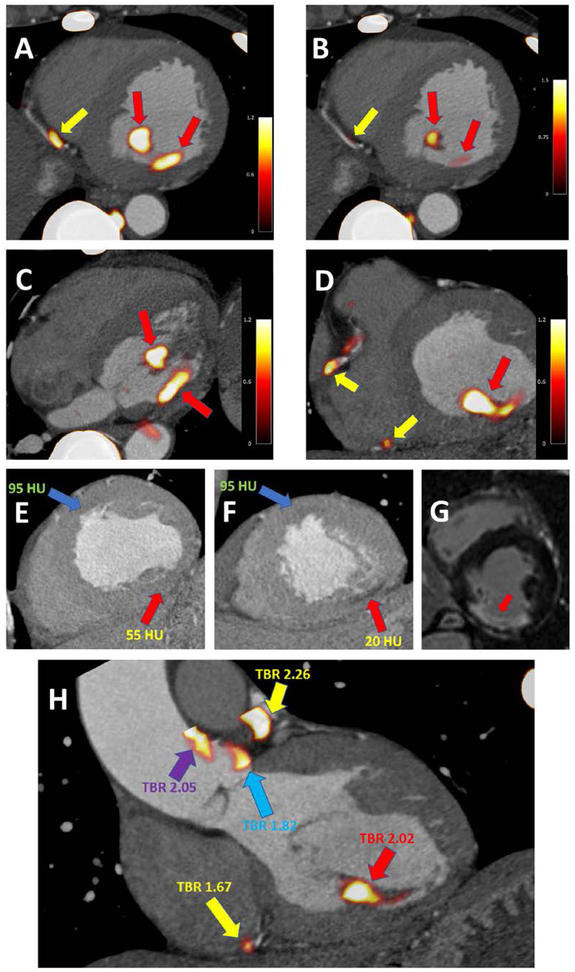
Figure 7. Case example of coronary and non-coronary 18F-NaF uptake.
A 67-year-old-male with uptake in the distal RCA (yellow arrow) and non-coronary uptake in the inferomedial papillary muscle (red arrow) (A). The uptake in the papillary muscle is more pronounced than in the coronary plaque (B). In the transverse plane the extra coronary foci of uptake can be easily seen (red arrows) (C) and have higher activity than the RCA plaques (yellow arrows) (D).
Taking advantage of the CTA, which was used for anatomical reference, careful inspection of the dataset revealed an area of low attenuation within the inferior LV wall and the postero-medial papillary muscle (red arrow) as compared to the LV anteroseptum (blue arrow) (E&F). Such low attenuation can be seen in infarcted myocardium – which might, in the process of healing, develop foci of microcalcification (which attract 18F-NaF). Without the reference of a CTA the foci of pronounced 18F-NaF uptake could potentially be erroneously attributed to plaques in the posterior descending artery (PDA) or the posterior left ventricular (PLV) artery. Due to the findings on the PET study the patient underwent cardiac magnetic resonance imaging which revealed scarring of the inferior wall and postero-medial papillary muscle (area of delayed enhancement [white] as opposed to the remote myocardium [black]) (G).
While uptake situated within the myocardium is a rare finding, the same patient showed non-coronary 18F-NaF activity in the aorta – which without anatomical reference could be easily attributed to one of the left coronary proximal plaques (H). Yellow arrows indicate coronary plaque uptake (in the distal RCA and proximal LAD). The red arrow highlights the infarcted postero-medial papillary muscle. The purple arrow indicates increased PET tracer activity in the ascending aorta and the blue arrow highlights uptake immediately adjacent to the left coronary cusp of the aortic valve.
Finally, we have demonstrated that by applying correction for coronary artery motion, the reproducibility of such PET-only measurements with prior CTA are significantly improved. In fact, our limits of agreement between PET/CTA1 and PET/CTA2 are comparable to the inter-observer repeatability for uptake measurements in the same scan as shown by Dweck et al 2. The improved PET/CTA2- PET/CTA1 reproducibility with motion correction is likely due to the higher signal to noise in the motion corrected PET images 20.
Study Limitations
There are several limitations of our work. Our motion correction method compensated only for cardiac motion; nevertheless, we have been able to demonstrate the utility of this technique in reducing the variation of 18F-NaF PET quantification with prior CTA. In this study we have not performed any quality control to identify any gross patient motion during the 30-minute-long emission scan. While the significance of such motion during acquisition has not been explored for coronary PET imaging it is likely that it has a detrimental effect on image quality and hence should be addressed in future studies. It might be speculated that gross patient motion correction would make the co-registration of PET and CTA more straightforward as borders between high and low update areas could be better defined. Currently the PET-CT co-registration was performed manually with translations made in the X, Y and Z axis and no rotations between datasets. It is likely that automatization of this process could decrease the time and expertise required for image analysis and translate into rapid dissemination of coronary 18F-NaF PET imaging beyond highly experienced academic centers. Nevertheless, in this study, despite the manual registration of CTA, we were already able to demonstrate excellent reproducibility of quantification 18F-NaF PET with separately obtained CTA.
Conclusion
Staged coronary PET and CTA protocols can reliably and reproducibly generate quantitative 18F-NaF PET coronary images. The reproducibility of such results is enhanced by cardiac motion correction of PET data. This approach may enable a practical method for the selection of high-risk patients for 18F-NaF PET scan based on results from an initial CTA scan.
Supplementary Material
Figure 5. TBR measurements.
Scatter plots and Bland Altman of prior CTA (PET/CTA1) and hybrid (PET/CTA2) TBR values for diastolic gate (a, c) and motion corrected (b, d) data. TBR measurements of lesion with (red) and without (blue) increased tracer uptake are shown. Motion corrected analysis resulted in reduced variation of TBR measurements compared to the diastolic gate imaging (p<0.001). TBR= target to background ratio, CTA= coronary CT angiography, ICC= intraclass correlation coefficient.
Clinical Perspective.
The standard approach used to date for coronary 18F-NaF PET/CT has several limitations which hamper its practical implementation into a meaningful clinical workflow. Studies to date have utilized CTA acquired using hybrid PET/CTA scanners during a single imaging session. This approach, however, does not lend itself to patient selection for imaging based on prior CTA findings, it may not allow for the use of optimal CT equipment for CTA (which may only be available on standalone CT scanners) and requires multi-faceted staff expertise in both PET and coronary CTA during a single session. In this study we show that utilization of a previously acquired CTA with a subsequent PET-only coronary 18F-NaF acquisition enables adequate categorization of plaques with respect to the presence of increased tracer activity and accurate quantification of PET uptake. This approach facilitates the selection of high-risk patients for PET-only 18F-NaF PET imaging, based on results from prior CTA scan. Given the simplicity of the prior CTA and subsequent PET-only acquisition protocol we believe that this approach can facilitate dissemination of 18F-NaF coronary uptake imaging beyond experienced academic institutions.
Acknowledgments
Sources of Funding
This research was supported in part by grant R01HL135557 from the National Heart, Lung, and Blood Institute/National Institute of Health (NHLBI/NIH). The content is solely the responsibility of the authors and does not necessarily represent the official views of the NIH.
The study was also supported by a grant (“Cardiac Imaging Research Initiative”) from the Miriam & Sheldon G. Adelson Medical Research Foundation. In addition, the study was supported by Siemens Medical Systems. The work was supported by the British Heart Foundation [CH/09/002/26360, FS/14/78/31020, RG/16/10/32375 and RE/13/3/30183], the Wellcome Trust [WT103782AIA to D.E.N.], and the Sir Jules Thorn Charitable Trust [15/JTA to M.R.D.].
Footnotes
Disclosure
None.
References:
- 1.Dweck MR, Williams MC, Moss AJ, Newby DE, Fayad ZA. Computed Tomography and Cardiac Magnetic Resonance in Ischemic Heart Disease. J Am Coll Cardiol. 2016;68:2201–2216. [DOI] [PMC free article] [PubMed] [Google Scholar]
- 2.Dweck MR, Chow MWL, Joshi NV, Williams MC, Jones C, Fletcher AM, Richardson H, White A, McKillop G, van Beek EJR, Boon NA, Rudd JHF, Newby DE. Coronary Arterial 18F-Sodium Fluoride Uptake A Novel Marker of Plaque Biology. J Am Coll Cardiol. 2012;59:1539–1548. [DOI] [PubMed] [Google Scholar]
- 3.Joshi NV, Vesey AT, Williams MC, Shah ASV, Calvert PA, Craighead FHM, Yeoh SE, Wallace W, Salter D, Fletcher AM, van Beek EJR, Flapan AD, Uren NG, Behan MWH, Cruden NLM, Mills NL, Fox KAA, Rudd JHF, Dweck MR, Newby DE. F-18-fluoride positron emission tomography for identification of ruptured and high-risk coronary atherosclerotic plaques: a prospective clinical trial. Lancet. 2014;383:705–713. [DOI] [PubMed] [Google Scholar]
- 4.Tarkin JM, Joshi FR, Evans NR, Chowdhury MM, Figg NL, Shah AV, Starks LT, Martin-Garrido A, Manavaki R, Yu E, Kuc RE, Grassi L, Kreuzhuber R, Kostadima MA, Frontini M, Kirkpatrick PJ, Coughlin PA, Gopalan D, Fryer TD, Buscombe JR, Groves AM, Ouwehand WH, Bennett MR, Warburton EA, Davenport AP, Rudd JHF. Detection of Atherosclerotic Inflammation by Ga-68-DOTATATE PET Compared to F-18 FDG PET Imaging. J Am Coll Cardiol. 2017;69:1774–1791. [DOI] [PMC free article] [PubMed] [Google Scholar]
- 5.Thomas GS, Haraszti RA. A new frontier in atherosclerotic coronary imaging. Lancet. 2014;383:674–675. [DOI] [PubMed] [Google Scholar]
- 6.Kitagawa T, Yamamoto H, Toshimitsu S, Sasaki K, Senoo A, Kubo Y, Tatsugami F, Awai K, Hirokawa Y, Kihara Y. F-18-sodium fluoride positron emission tomography for molecular imaging of coronary atherosclerosis based on computed tomography analysis. Atherosclerosis. 2017;263:385–392. [DOI] [PubMed] [Google Scholar]
- 7.de Oliveira-Santos M, Castelo-Branco M, Silva R, Gomes A, Chichorro N, Abrunhosa A, Donato P, de Lima JP, Pego M, Goncalves L, Ferreira MJ. Atherosclerotic plaque metabolism in high cardiovascular risk subjects - A subclinical atherosclerosis imaging study with F-18-NaF PET-CT. Atherosclerosis. 2017;260:41–46. [DOI] [PubMed] [Google Scholar]
- 8.Vesey AT, Jenkins WSA, Irkle A, Moss A, Sng G, Forsythe RO, Clark T, Roberts G, Fletcher A, Lucatelli C, Rudd JHF, Davenport AP, Mills NL, Salman RAS, Dennis M, Whiteley WN, van Beek EJR, Dweck MR, Newby DE. F-18-Fluoride and F-18-Fluorodeoxyglucose Positron Emission Tomography After Transient Ischemic Attack or Minor Ischemic Stroke: Case-Control Study. Circ Cardiovasc Imaging. 2017;10:e004976. [DOI] [PMC free article] [PubMed] [Google Scholar]
- 9.Pawade TA, Cartlidge TRG, Jenkins WSA, Adamson PD, Robson P, Lucatelli C, Van Beek EJR, Prendergast B, Denison AR, Forsyth L, Rudd JHF, Fayad ZA, Fletcher A, Tuck S, Newby DE, Dweck MR. Optimization and Reproducibility of Aortic Valve 18F-Fluoride Positron Emission Tomography in Patients With Aortic Stenosis. Circ Cardiovasc Imaging. 2016;9:e005131. [DOI] [PMC free article] [PubMed] [Google Scholar]
- 10.Kwiecinski J, Berman DS, Lee SE, Dey D, Cadet S, Lassen ML, Germano G, Jansen MA, Dweck MR, Newby DE, Chang HJ, Yun M, Slomka PJ. Three-hour delayed imaging improves assessment of coronary 18F-sodium fluoride PET. J Nucl Med. 2018. [Epub ahead of print] [DOI] [PMC free article] [PubMed] [Google Scholar]
- 11.Nerlekar N, Ha FJ, Cheshire C, Rashid H, Cameron JD, Wong DT, Seneviratne S, Brown AJ. Computed Tomographic Coronary Angiography-Derived Plaque Characteristics Predict Major Adverse Cardiovascular Events A Systematic Review and Meta-Analysis. Circ Cardiovasc Imaging. 2018;11. [DOI] [PubMed] [Google Scholar]
- 12.Motoyama S, Ito H, Sarai M, Kondo T, Kawai H, Nagahara Y, Harigaya H, Kan S, Anno H, Takahashi H, Naruse H, Ishii J, Hecht H, Shaw LJ, Ozaki Y, Narula J. Plaque Characterization by Coronary Computed Tomography Angiography and the Likelihood of Acute Coronary Events in Mid-Term Follow-Up. J Am Coll Cardiol. 2015;66:337–346. [DOI] [PubMed] [Google Scholar]
- 13.Doris M, Otaki Y, K. Krishnan S, Kwiecinski J, Rubeaux M, Alessio A, Pan T, Cadet S, Dey D, Dweck M, E. Newby D, Berman D, Slomka P. Optimization of reconstruction and quantification of motion-corrected coronary PET-CT; JNC 2018. [DOI] [PMC free article] [PubMed] [Google Scholar]
- 14.Rubeaux M, Joshi NV, Dweck MR, Fletcher A, Motwani M, Thomson LE, Germano G, Dey D, Li DB, Berman DS, Newby DE, Slomka PJ. Motion Correction of F-18-NaF PET for Imaging Coronary Atherosclerotic Plaques. J Nucl Med. 2016;57:54–59. [DOI] [PubMed] [Google Scholar]
- 15.Weber WA, Ziegler SI, Thodtmann R, Hanauske AR, Schwaiger M. Reproducibility of metabolic measurements in malignant tumors using FDG PET. J Nucl Med. 1999;40:1771–1777. [PubMed] [Google Scholar]
- 16.Adamson PD, Vesey AT, Joshi NV, Newby DE, Dweck MR. Salt in the wound: F-18-fluoride positron emission tomography for identification of vulnerable coronary plaques. Cardiovasc Diag and Therap. 2015;5:150–155. [DOI] [PMC free article] [PubMed] [Google Scholar]
- 17.Raggi P, Pontone G, Andreini D. Role of new imaging modalities in pursuit of the vulnerable plaque and the vulnerable patient. Inter J Card. 2018;250:278–283. [DOI] [PubMed] [Google Scholar]
- 18.Greenland P, LaBree L, Azen SP, Doherty TM, Detrano RC. Coronary artery calcium score combined with Framingham score for risk prediction in asymptomatic individuals. JAMA. 2004;291:210–215. [DOI] [PubMed] [Google Scholar]
- 19.Einstein AJ, Elliston CD, Arai AE, Chen MY, Mather R, Pearson GDN, DeLaPaz RL, Nickoloff E, Dutta A, Brenner DJ. Radiation Dose from Single-Heartbeat Coronary CT Angiography Performed with a 320-Detector Row Volume Scanner. Radiology. 2010;254:698–706. [DOI] [PMC free article] [PubMed] [Google Scholar]
- 20.Rubeaux M, Doris MK, Alessio A, Slomka PJ. Enhancing Cardiac PET by Motion Correction Techniques. Curr Cardiol Rep. 2017;19:14. [DOI] [PubMed] [Google Scholar]
Associated Data
This section collects any data citations, data availability statements, or supplementary materials included in this article.


