In Arabidopsis, the basic somatic ploidy level is highly correlated with cell size, cell division, and cell wall composition, and polyploidy has a beneficial effect on saccharification yield.
Abstract
Polyploidization has played a key role in plant breeding and crop improvement. Although its potential to increase biomass yield is well described, the effect of polyploidization on biomass composition has largely remained unexplored. Here, we generated a series of Arabidopsis (Arabidopsis thaliana) plants with different somatic ploidy levels (2n, 4n, 6n, and 8n) and performed rigorous phenotypic characterization. Kinematic analysis showed that polyploids developed slower compared to diploids; however, tetra- and hexaploids, but not octaploids, generated larger rosettes due to delayed flowering. In addition, morphometric analysis of leaves showed that polyploidy affected epidermal pavement cells, with increased cell size and reduced cell number per leaf blade with incrementing ploidy. However, the inflorescence stem dry weight was highest in tetraploids. Cell wall characterization revealed that the basic somatic ploidy level negatively correlated with lignin and cellulose content, and positively correlated with matrix polysaccharide content (i.e. hemicellulose and pectin) in the stem tissue. In addition, higher ploidy plants displayed altered sugar composition. Such effects were linked to the delayed development of polyploids. Moreover, the changes in polyploid cell wall composition promoted saccharification yield. The results of this study indicate that induction of polyploidy is a promising breeding strategy to further tailor crops for biomass production.
Polyploid plants possess three or more sets of homologous chromosomes. The increase in chromosome number in these plants is the result of a genome duplication event. Depending on the origin of the genome duplication event, there is considered to be two different polyploid types: autopolyploids, which are derived from multiplication of a diploid genome (intraspecies), and allopolyploids, which are the consequence of hybridization followed by doubling of the two haploid genomes (interspecies; Comai, 2005). Despite this difference, both types of polyploids profit from a genomic buffering effect provided by the doubling of their genetic information. Thanks to this buffering, epigenetic changes as well as gain and loss of DNA sequences have either no or less dramatic detrimental effects on the organism’s viability, whereas they provide an increase in genetic variation, thus allowing evolution of the genome (Ramsey and Schemske, 2002; Chen, 2010). In addition, the combination of different genomes in allopolyploids results in stochastic changes in genome organization and altered gene expression of parental genomes, putatively causing additive heterosis effects. Although still not fully understood, the increase in chromosome number and additional genomic interactions and genetic alterations often results in superior properties in polyploid plants compared to those in their diploid counterparts, making polyploidization a credible approach for crop improvement. For example, polyploidization has already been successfully implemented in plant breeding programs to increase overall yield and biomass of several crop species, including potato, red clover, sugar beet, watermelon, etc. (Bamakhramah et al., 1984; Cai et al., 2007; Renny-Byfield and Wendel, 2014; Sattler et al., 2016).
Besides the importance of plant biomass for feed and food production, there is increasing interest in the use of plants as a source of energy and chemical building blocks. For this purpose, not only the yield but also the biomass composition is of uttermost importance. Plant biomass is mainly composed of cell walls, which contain high amounts of polysaccharides that can be enzymatically depolymerized into fermentable monosaccharides. A significant barrier for the efficient utilization of plant biomass as a source of sugars lies in the recalcitrance of the cell wall to enzymatic digestion and processing. In particular lignin, which forms a structural matrix around the cellulose microfibrils, is seen as an important, if not the most, limiting factor in the enzymatic depolymerization of cell wall polysaccharides. Hence, altering the amount or structure of lignin affects saccharification efficiency, i.e. the enzymatic conversion of cell wall polysaccharides to fermentable sugars (Chen and Dixon, 2007). A common strategy to alter lignin is to interfere with the biosynthesis of its building blocks, namely the monolignols. Mutants defective in the monolignol biosynthesis pathway contain either less lignin or lignin with an altered composition, and therefore produce cell walls that are more easily digested resulting in higher sugar yields (Vanholme et al., 2012a; Van Acker et al., 2013). Alternatively, incorporation of novel building blocks that differ from the traditional monolignols p-coumaryl, coniferyl, and sinapyl alcohol may reduce the recalcitrance of the plant cell wall to enzymatic degradation and improve downstream processing (Vanholme et al., 2012b; Petrik et al., 2014; Wilkerson et al., 2014; Smith et al., 2015; Mottiar et al., 2016; Sibout et al., 2016).
Several studies suggest that an increased somatic ploidy level may influence biomass composition in a way that could be beneficial for the production of bioenergy and materials. For example, triploid and tetraploid willow were found to contain a reduced lignin content compared to the diploid parental lines (Serapiglia et al., 2015). In addition, Morrison (1980) showed that lignin content in temperate grasses tends to be lower in tetraploids compared to that in diploids. Besides a change in cell wall composition, polyploidy is also known to increase organ size and improve biomass production in several plant species (Tsukaya, 2008; del Pozo and Ramirez-Parra, 2015; Tavan et al., 2015; Vergara et al., 2016). The combined effect of an altered cell wall composition with an improved biomass production makes induction of polyploidy a promising tool to improve plants for the bio-based economy. However, the literature on the relationship between ploidy level and cell wall composition is scarce and fragmentary, and in some cases contradictory. Up to now, no general conclusions can be drawn regarding a possible correlation between higher ploidy levels and biomass yield and composition, necessitating further research.
Here, we focused on the model plant Arabidopsis (Arabidopsis thaliana) to investigate the effects of tetraploidy on cell wall composition, and to assess whether these findings can be extrapolated to higher ploidy levels. For this, a series of different autopolyploids was generated (i.e. tetra-, hexa-, and octaploids) and subjected to growth analyses and cell wall characterization. Our data show that polyploidy has profound effects on plant growth and cell wall composition, and that the polyploid biomass is significantly easier to saccharify as compared to that of their diploid counterparts.
RESULTS
Phenotypic Analysis of Polyploid Arabidopsis
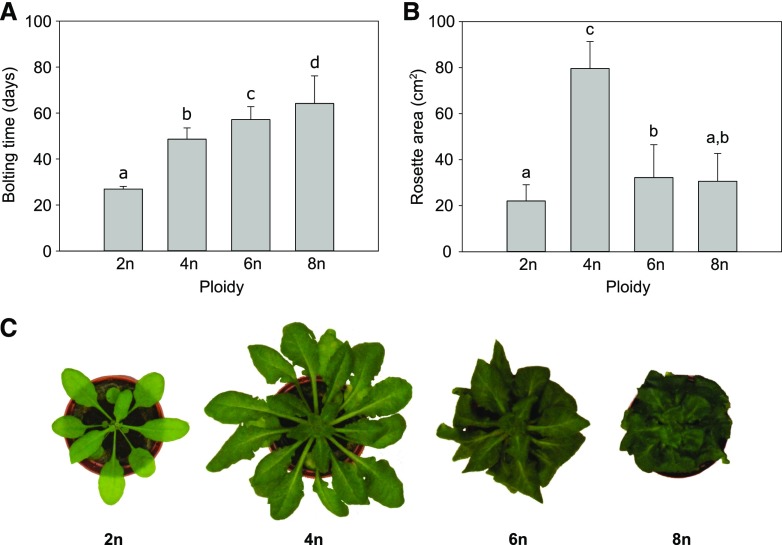
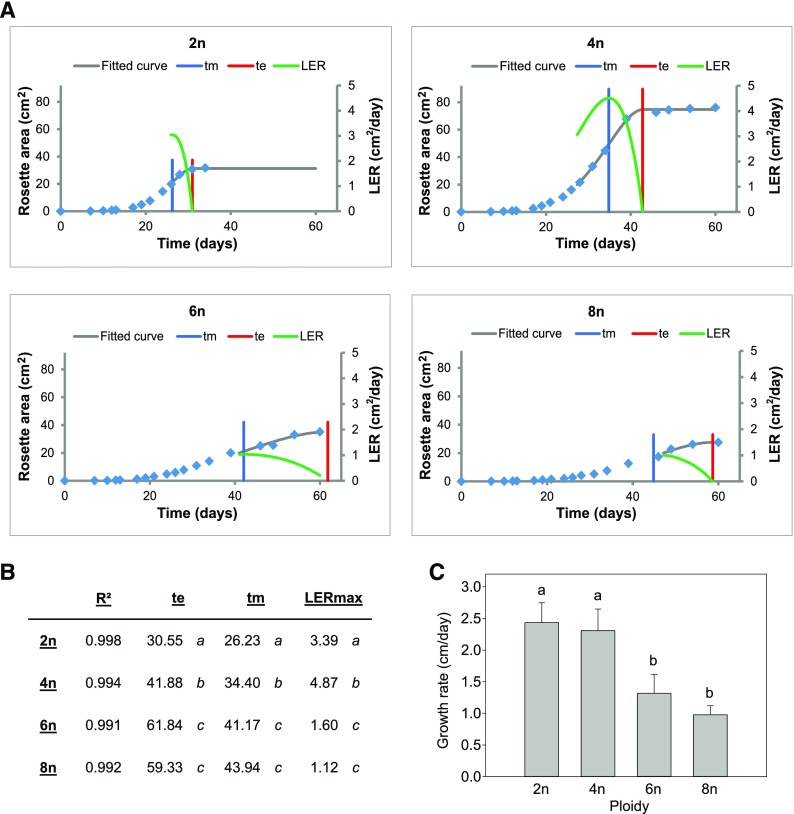
A set of Arabidopsis autopolyploids (4n, 6n, and 8n) was obtained through colchicine treatment of diploid seedlings (C0 population) and flow cytometry-based somatic ploidy analysis of their progeny obtained by self-fertilization (C1 population; Supplemental Fig. S1). The tetraploid and octaploid C1 plants were directly obtained from colchicine-treated diploids, whereas the hexaploids were obtained by crossing the resulting tetraploids with octaploids. When the set of polyploids was grown under long-day light conditions (LD; 16-h light/8-h dark), a severe delay in development was observed for the plants with higher ploidy level compared to that in diploid plants, resulting in a bolting delay of 22, 30, and 37 d for tetraploids, hexaploids, and octaploids, respectively (Fig. 1A). To quantify the plants’ growth parameters, we measured projected rosette area of individual plants throughout their development and analyzed leaf growth data using the nonlinear regression-based tool LEAF-E (Voorend et al., 2014). The rosettes of the tetraploids, compared to those of diploids, expanded over a longer period of time. The maximal Leaf Elongation Rate (LERmax) was higher and was reached at a later point in time (tm). Additionally, the end point of tetraploid rosette growth was reached significantly later as compared to that of diploids (te; Figure 2 A and B). Consequently, the rosette area of tetraploids at bolting time showed an increase of 250% compared to that of diploids (Fig. 1, B and C). Although the hexaploids and octaploids also showed a significant shift in tm to a later time point, a significant reduction in LERmax was observed compared to that in diploids (Fig. 2, A and B). In hexaploids, the extension of the growth phase compensated for the slower growth rate, resulting in a 40% increase in projected rosette area at bolting time as compared to that in diploids (Fig. 1, B and C). However, in octaploids, the extension of the growth phase did not lead to a significant difference in rosette area compared to that in diploids (Fig. 1, B and C). In line with the observed reduction in rosette growth rate in hexa- and octaploids, the stem growth rate was significantly reduced (46% and 60%, respectively) in these plants compared to that of diploids (Fig. 2C).
Figure 1.
Phenotype of polyploid Arabidopsis. A, Bolting time of polyploid Arabidopsis (2n, diploid; 4n, tetraploid; 6n, hexaploid; 8n, octaploid). B, The average projected rosette area at time of bolting. C, Rosettes of representative Arabidopsis plants at the start of bolting. Images were digitally extracted for comparison. Error bars represent SD; different lowercase letters indicate statistically significant difference; n = 3 biological replicates of 20 plants; Statistical analysis was done with univariate analysis and Scheffe post-hoc testing in SPSS; α = 0.05.
Figure 2.
Growth parameters of polyploid Arabidopsis. A, Rosette growth rate over time of polyploid Arabidopsis (2n, diploid; 4n, tetraploid; 6n, hexaploid; 8n, octaploid). Blue diamonds indicate the measured values and a curve was fitted using LEAF-E. Leaf elongation rate (LER), Maximal LER (LERmax), the time at which LER reaches a maximum (tm), the end-point of growth (te). B, The values for all parameters determined using the LEAF-E tool. C, The average growth rate of the main inflorescence stem of polyploid Arabidopsis. Error bars represent SD. Different lowercase letters indicate statistically significant difference; n = 20 plants. Statistical analysis was done with univariate analysis and Scheffe posthoc testing in SPSS; α = 0.05.
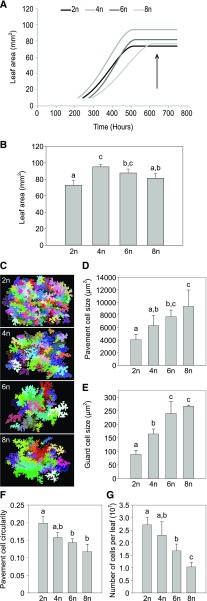
To further unravel the cellular basis of the observed morphological changes in our polyploid plants, we compared the cell size, number, and morphology of plants with different ploidy levels. Analyses were performed on abaxial cells of fully-grown leaves of the first real leaf pair (L1/2) using an automated image-analysis algorithm designed to quantify and visualize the morphological information of each individual cell (Andriankaja et al., 2012). First, the time point at which both leaves were fully expanded in the different polyploid lines was determined by following the growth of L1/2 over time and calculating the end-point of growth using LEAF-E (Fig. 3A). Here, in line with previous observations on bolting time and rosette growth, a remarkable developmental delay was observed in the plants with a higher ploidy level, and the specific time point whereupon L1/2 was fully expanded was 21, 22, 23, and 26 d after stratification (DAS) for di-, tetra-, hexa-, and octaploids, respectively. To assure full expansion of L1/2 of all examined plants, the leaves were harvested 31 DAS for subsequent experiments. At this point, the area of L1/2 was 27% larger in tetraploids and 20% larger in hexaploids compared to that in diploids, whereas there was no significant difference in L1/2 leaf area between octa- and diploids (Fig. 3B). To link the increase in leaf area to changes in cell division and/or cell expansion, fully-expanded L1/2 leaves of the different polyploid lines were used to perform cell number analysis by means of cellular drawings of the basal abaxial epidermal cells (Fig. 3C). These drawings were then submitted to the algorithm’s analysis to determine the cell area and density of pavement cells and guard cells. In addition, pavement cell shape was described using a circularity score, where a score of 1 indicates a perfect circle and a lower score is indicative of lobed cells. This analysis revealed that the basic somatic ploidy level is positively correlated with cell area of both pavement and guard cells (R2=0.9920 and 0.9632, respectively), but negatively correlated with cell circularity (R2 = 0.9599) and the number of cells per leaf (R2=0.9917; Figure 3, D to G). Taken together, these data demonstrate that the polyploid lines have a reduced cell division rate in the leaves, which seems to be compensated for by an increase in cell size.
Figure 3.
Cellular analysis of polyploid Arabidopsis. A, Leaf area of the first two leaves (L1/2) over time in polyploid Arabidopsis (2n, diploid; 4n, tetraploid; 6n, hexaploid; 8n, octaploid). The arrow indicates the time point where L1/2 were harvested for further analysis. B, Leaf area of L1/2 on day 31, which was chosen as the time point to make cellular drawings of abaxial epidermal cells. C, Representative cellular drawings of abaxial epidermal cells of polyploid plants. D, Average size of abaxial epidermis cells of L1/2 leaves of polyploid plants. E, Average size of stomatal guard cells of polyploid plants. F, Average circularity of abaxial epidermis cells of L1/2 leaves of polyloid plants. G, Average number of cells per L1/2 of polyploid plants. Error bars represent SD; Different lowercase letters indicate statistically significant difference; n = 8 plants per time point; Statistical analysis was done with univariate analysis and Scheffe posthoc testing in SPSS; α = 0.05.
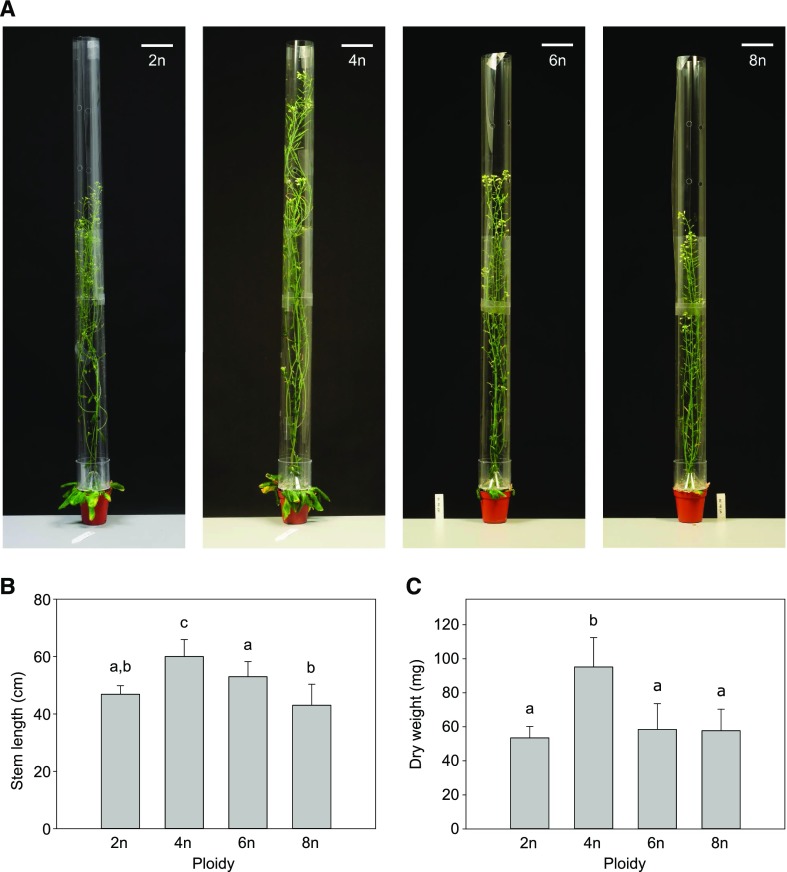
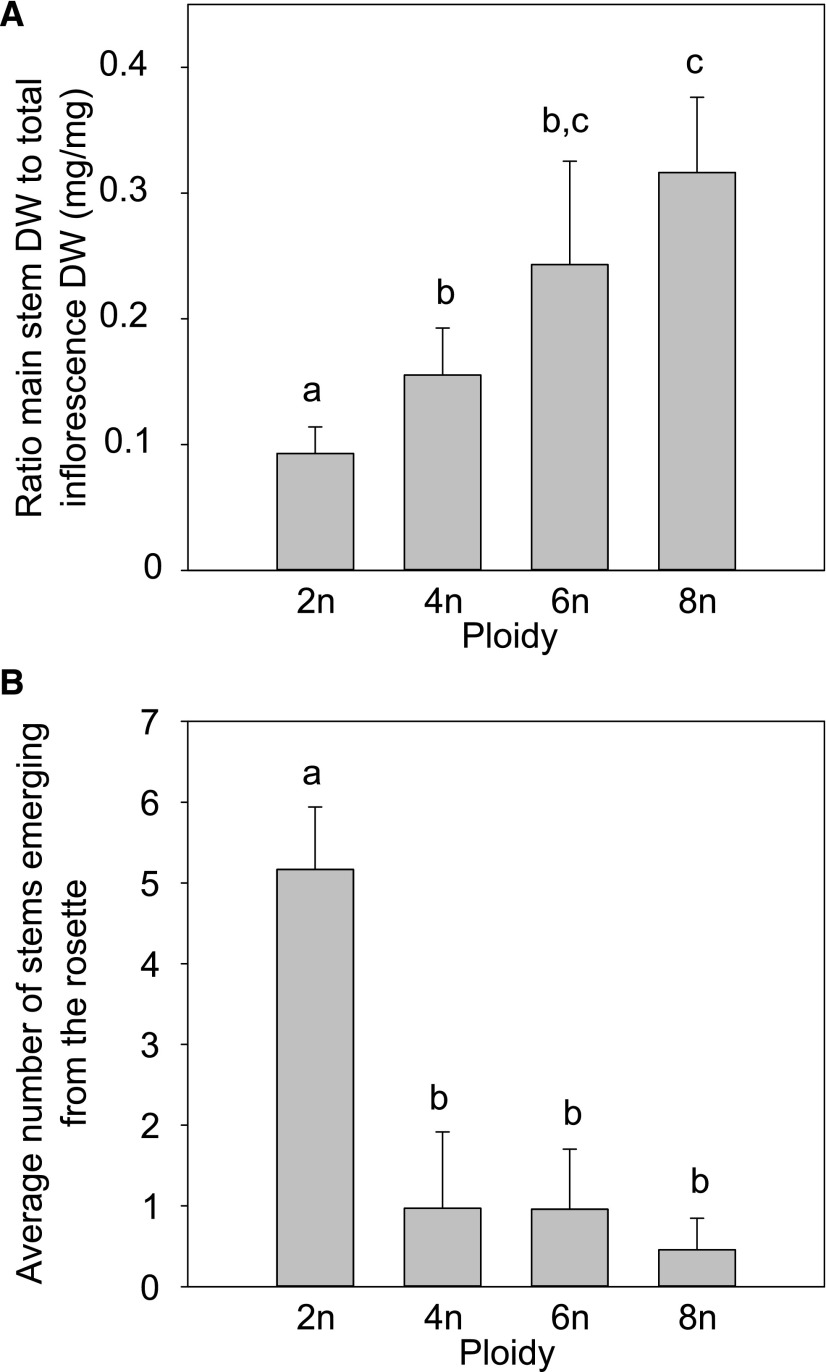
Next, we investigated the effect of somatic ploidy level on cell wall composition. For this purpose, plants were grown under conditions optimized to obtain robust inflorescence stems with thick secondary cell walls (i.e. 8 weeks short-day conditions (SD; 8-h light/16-h dark) before transfer to LD; Vanholme et al., 2014). Once the plants were fully senescent, stem material was harvested, side branches were removed, and both height and dry weight of the main inflorescence stem were determined. Compared to that in diploids, only tetraploids showed a significant increase in stem height (20%) and dry weight (82%; Fig. 4). Although these parameters were not significantly different between di-, hexa-, and octaploids, the plants with higher ploidy levels clearly differed from diploids based on other phenotypic characteristics. First, the diameter of the main stem as measured between 1 and 2 cm above the rosette was positively correlated with basic somatic ploidy level (R2 = 0.9608; Fig. 5). Second, polyploidy was accompanied by an increase in apical dominance, which was reflected in an increase in the fraction of dry weight of the main stem to the dry weight of the total inflorescence together with a reduced number of stems emerging from the rosette (Fig. 6).
Figure 4.
Polyploid Arabidopsis stem biomass. A, Fully-grown representative polyploid Arabidopsis plants (2n, diploid; 4n, tetraploid; 6n, hexaploid; 8n, octaploid). Scale bars represent 5 cm. B, The average length of the primary inflorescence stem of polyploid Arabidopsis plants. C, The average dry weight of the primary inflorescence stem of polyploid Arabidopsis plants. Error bars represent SD; Different lowercase letters indicate statistically significant differences; n = 3 biological replicates of 20 plants; Statistical analysis was done with univariate analysis and Scheffe posthoc testing in SPSS; α = 0.05.
Figure 5.
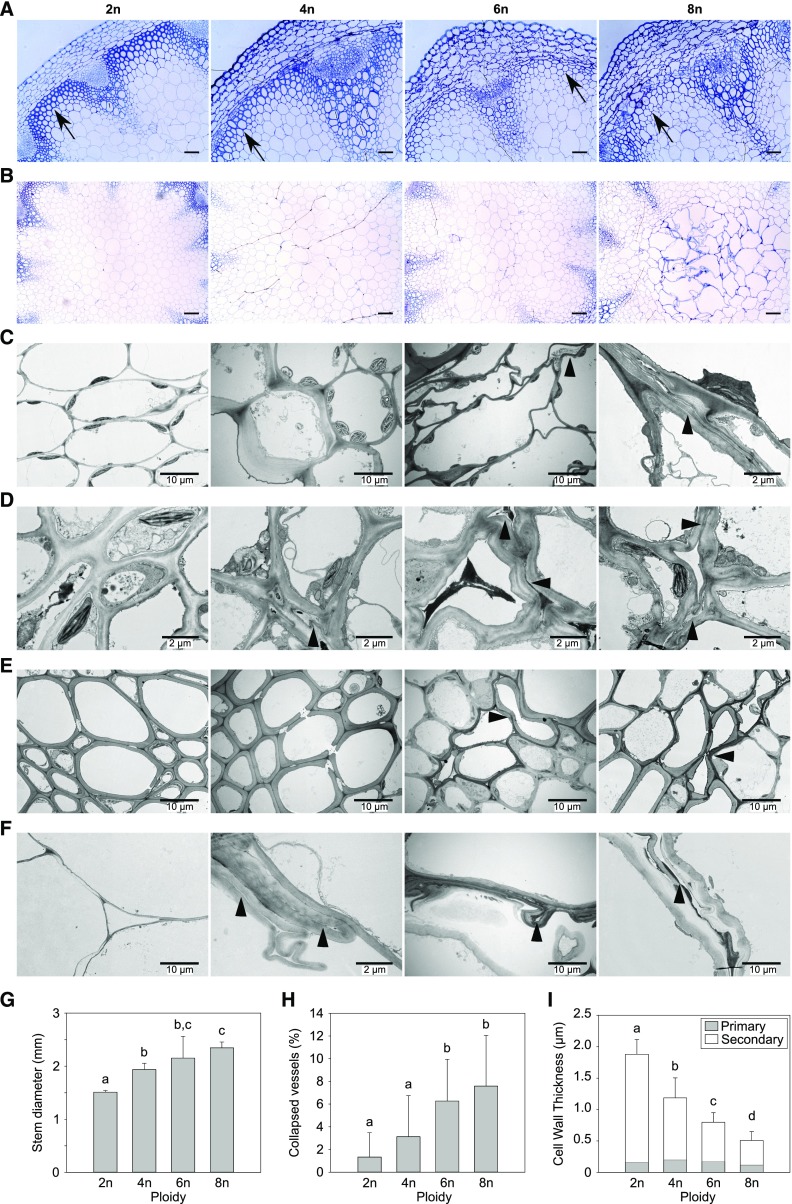
Morphological analysis of polyploid Arabidopsis stems. A and B, Transverse sections stained with toluidine blue of representative polyploid Arabidopsis stems (2n, diploid; 4n, tetraploid; 6n, hexaploid; 8n, octaploid). A, Detail of the vascular bundle. The arrow indicates the interfascicular fibers. Scale bars represent 100 µm. B, Detail of pith region. Scale bars represent 200 µm. C to F, Transmission Electron Microscopy (TEM) of different tissues including (C) cortex, (D) phloem, (E) xylem, and (F) pith. The arrowheads indicate collapsed cells or the remainder of crushed cells. Scale bars represent either 10 or 2 µm, as indicated. G, The average diameter of the primary inflorescence stem taken 1 to 2 cm above the rosette. H, The average amount of collapsed vessels per total amount of vessels. I, The average thickness of the cell wall of the interfascicular fibers. The thickness of primary cell wall is depicted in gray; the amount of secondary cell wall is shown in white. Error bars represent SD; Different lowercase letters indicate statistically significant difference; n = 4 biological replicates; statistical analysis was done with univariate analysis and Scheffe posthoc testing in SPSS; α = 0.05.
Figure 6.
Apical dominance of polyploid Arabidopsis. A, The ratio of the main inflorescence stem dry weight (without side branches and secondary inflorescences) to the total dry weight (with side branches) in polyploid Arabidopsis (2n, diploid; 4n, tetraploid; 6n, hexaploid; 8n, octaploid). B, The average number of additional stems emerging from the rosette, besides the main stem. Error bars represent SD; different lowercase letters indicate statistically significant difference; n = 3 replicates of 20 plants; statistical analysis was done with univariate analysis and Scheffe posthoc testing in SPSS; α = 0.05.
In line with the positive effects of the basic somatic ploidy level on organ size, an increase in petal and sepal size was observed in all polyploids compared to diploids. In addition, the individual seed weight appeared positively correlated with the somatic ploidy level of the donor plant (R2 = 0.9622) and was accompanied by an increase in silique width (R2 = 0.9677). Furthermore, silique length was higher in tetraploids and lower in hexa- and octaploids, whereas the number of seeds per silique was lower in hexa- and octaploids compared to that in their diploid counterparts (Supplemental Table S1).
Stem cross sections revealed that the shape of the cortex cells in the hexa- and octaploids was severely distorted (Fig. 5A). The pith cells of hexa- and octaploids also showed signs of disruption and disintegration (Fig. 5B). To analyze this in more detail, we performed transmission electron microscopy (TEM) and carefully examined the different tissues of the inflorescence stem (Fig. 5, C to F). This revealed that the cells and cell walls in the cortex, phloem, cambium, and pith were highly distorted in the polyploids. More specifically, stems of hexa- and octaploids contain cells that were completely crushed in all tissues of the stem. In tetraploids, these crushed cells were restricted to the phloem and pith. The xylem of hexa- and octaploids contained some vessels that were collapsed. When quantifying the number of collapsed vessels, we found that 6% and 7.5% of the total number of vessels were collapsed in hexaploids and octaploids, respectively (Fig. 5H). Finally, the thickness of the cell wall in the interfascicular fibers negatively correlated with ploidy level (Fig. 5I; R2 = 0.9595). This reduction in thickness is the consequence of a reduction in secondary cell wall deposition, as the thickness of the primary cell wall did not differ from diploids. Taken together, these observations indicated that the integrity of the cells and the strength of the cell wall are affected in the polyploid lines.
Cell Wall Composition of Polyploids
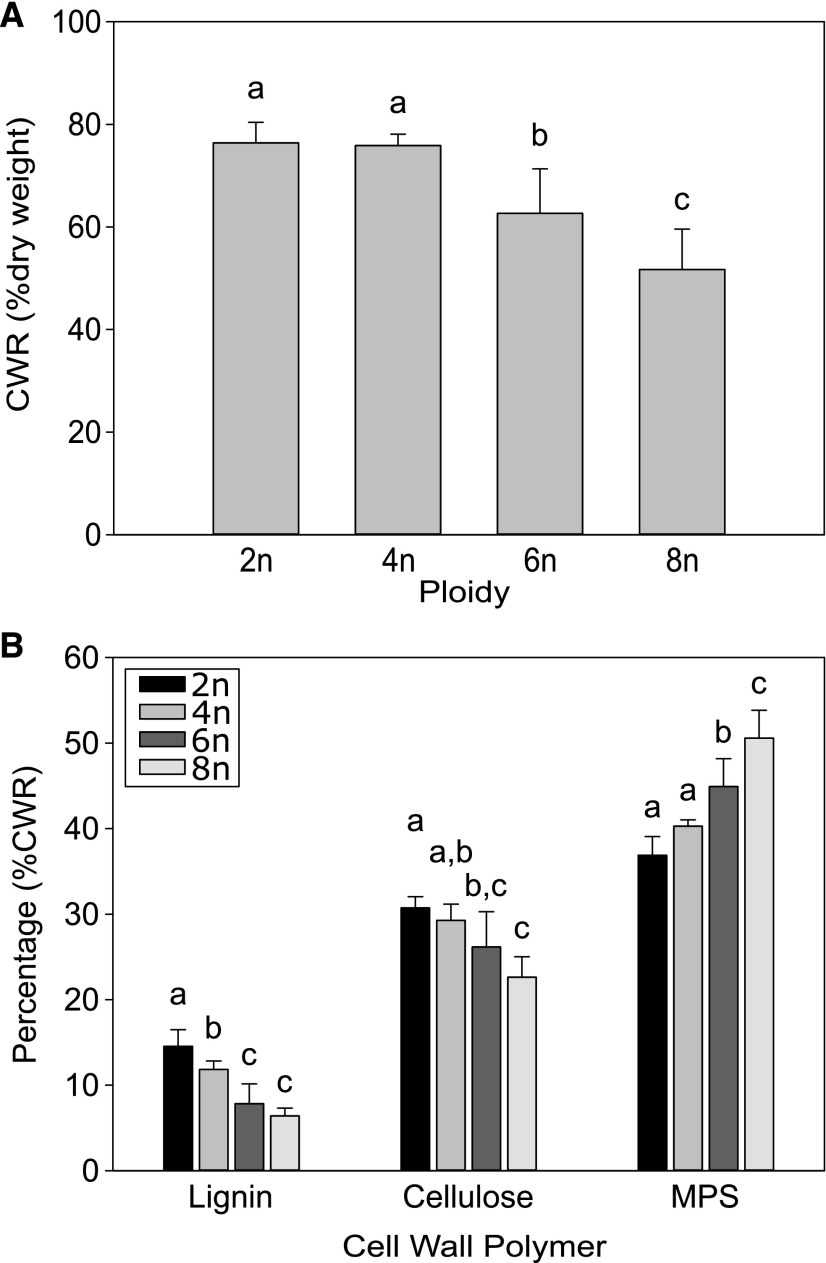
To study the effect of ploidy level on the cell wall content and its composition, fully senesced stems grown under SD/LD conditions were analyzed. The cell wall residue (CWR) was prepared using a sequential extraction method and gravimetrically determined as percentage of dry biomass (Fig. 7A). Compared to that in diploids, both the hexa- and octaploids showed a significant reduction in CWR (18% and 32%, respectively). No difference was observed between the di- and tetraploids regarding CWR. The purified CWR was subsequently used to determine the relative abundances and composition of the main cell wall polymers (i.e. lignin, cellulose, and hemicellulose; Figure 7B). To allow comprehensive quantitative comparison between samples, cell wall polymers were expressed on a CWR basis, unless noted otherwise.
Figure 7.
Cell wall composition of polyploid Arabidopsis stems. A, The cell wall residue (CWR) of Arabidopsis polyploids (2n, diploid; 4n, tetraploid; 6n, hexaploid; 8n, octaploid) is given as percentage of dry weight. B, The amount of CW polymers is given as percentage of CWR. Error bars represent SD; different lowercase letters indicate statistically significant difference; n = 8 pools of 2 or more biological replicates; statistical analysis was done with univariate analysis and Scheffe posthoc testing in SPSS; α=0.05.
Lignin content was determined using the acetyl bromide (AcBr) method. Interestingly, an increase in somatic ploidy level was correlated with a gradual decrease in AcBr-lignin content (R2 = 0.9179). Compared to that in diploids, a decrease of 20%, 50%, and 55% in AcBr-lignin was found for tetraploids, hexaploids, and octaploids, respectively (Fig. 7B). Next, thioacidolysis was used to determine the composition of the lignin polymer, more specifically the abundance of the major lignin units (i.e. the hydroxyphenyl [H], guaiacyl [G], and syringyl [S] units, that are linked via β-ether bonds; Table 1). A significant shift in lignin composition was only observed in the octaploids, for which a drop in the abundance of S units and an increase in the abundance of H units was observed. The reduced level of S units also led to a significant decrease in S/G ratio in octaploids. In addition, the overall thioacidolysis yield, which is represented as the sum of the three units and which is a measure for the degree of lignin condensation, was also significantly decreased in the octaploids. The fact that lignin of octaploids releases less S units and more H units by thioacidolysis is also indicative of a higher degree of lignin condensation in octaploids. A Mäule staining showed that there was no difference between lignification patterns in stem sections of polyploids (Supplemental Fig. S2). A reduced staining intensity was observed in hexa- and octaploids, as can be expected with the observed reduction in lignin content.
Table 1. Thioacidolysis of polyploid Arabidopsis.
All values given are in µmol per mg of AcBr-lignin. Data are means ± sd. Different lowercase letters following values indicate statistically significant difference; H, G, and S; p-hydroxyphenyl, guaiacyl, and syringyl lignin units; n = 8 pools of two or more biological replicates; statistical analysis was done with univariate analysis and Scheffe posthoc testing in SPSS; α = 0.05.
| Lignin monomeric composition | 2n | 4n | 6n | 8n |
|---|---|---|---|---|
| H+G+S | 6.40 ± 2.07 a | 8.48 ± 1.84 a | 6.32 ± 1.20 a,b | 3.74 ± 1.04 b |
| H | 0.05 ± 0.02 a | 0.11 ± 0.03 a,b | 0.18 ± 0.04 b | 0.19 ± 0.07 b |
| G | 3.50 ± 1.68 a | 4.79 ± 1.71 a | 3.53 ± 0.66 a | 2.56 ± 0.86 a |
| S | 1.97 ± 0.96 a | 2.62 ± 1.00 a | 2.61 ± 0.53 a | 0.99 ± 0.25 b |
| S/G | 0.56 ± 0.01 a | 0.55 ± 0.07 a | 0.74 ± 0.06 a | 0.40 ± 0.09 b |
The reduction in lignin content in the cell wall should be compensated for by another cell wall polymer. Cellulose amounts were measured in TFA-extracted CWR (Fig. 7B). Compared to that in diploids, a gradual reduction in cellulose content was found in the hexa- and octaploids (15% and 25%, respectively; R2 = 0.9708). These lines also contained less lignin, indicating that cellulose did not compensate for the decrease in lignin. Hence, a compensation effect was expected at the level of matrix polysaccharides (MPS; i.e. hemicellulose and pectin). The weight difference of the CWR before and after TFA extraction can be used as a measure for the amount of MPS in the cell wall. As anticipated, a positive correlation was found between the ploidy level and MPS content in the stem (R2 = 0.9879; Figure 7B). In hexa- and octaploids, the MPS fraction was 22% and 37% higher, respectively, compared to that in diploids.
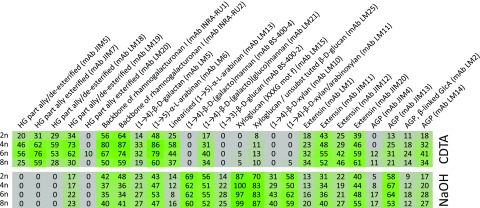
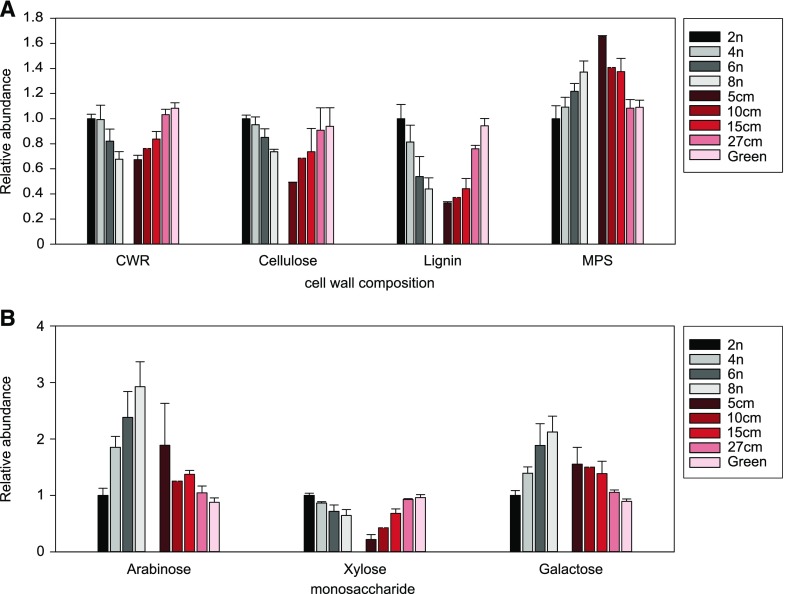
During TFA extraction, MPS are hydrolyzed into their composing monosaccharides, which can be subsequently identified and quantified using GC/MS (Table 2). This assay revealed a gradual increase in the concentration of Fuc (R2 = 0.7785), arabinose (R2 = 0.9853), and Gal (R2 = 0.9835) levels with increasing ploidy level. In contrast, Xyl levels in the stem gradually decreased with increasing ploidy levels (R2 = 0.9819). We used carbohydrate microarray analysis to further explore the effect of ploidy level on stem MPS in the polyploid lines (Moller et al., 2007). The alcohol insoluble residue was extracted using 1,2-cyclohexylenedinitrilotetraacetic acid (CDTA) followed by sodium hydroxide. The two extracts were printed separately as microarrays, which were probed with monoclonal antibodies directed against cell wall polysaccharide epitopes. This analysis provided semiquantitative information about the relative abundance of extractable cell wall polysaccharides. The data are presented as a heatmap in which mean spot signal intensities are proportional to color intensity (Fig. 8). Higher relative signals for many cell wall polysaccharide epitopes were obtained from the tetra-, hexa-, and octaploids compared to diploid plants. This effect was particularly pronounced for pectic domains including homogalacturonan (HG), arabinan, and galactan side chains and rhamnogalacturonan backbone structures (as recognized by mAbs JIM5, JIM7, LM18, LM19, LM6, LM5, and RU1 and RU2 respectively). Notable increases correlated with ploidy level were also apparent in galactoglucomannan (as recognized by mAb LM21), arabinogalactan proteins (as recognized by mAbs Jim13 and LM14), extensins (as recognized by mAbs JIM11, JIM20, and LM1), and xyloglucan (as recognized by mAb LM25). Interestingly, in some cases the increase in signal intensities compared to that in the diploid plants was greater in tetraploids and hexaploids than that in the octaploids (Fig. 8). The accumulation of xyloglucans, extensins, and arabinogalactan-proteins in the cell walls of the polyploids is reminiscent of immature secondary cell walls which are also rich in these polymers (Mohnen, 2008; Scheller and Ulvskov, 2010). In addition, the octaploids contain lower levels of S units in their lignin, which are thought to be deposited at a later stage during maturation and development (Buxton and Russell, 1988; Chen et al., 2002). Taken together, we hypothesized that the cell walls of our higher polyploids, most notably hexaploids and octaploids, are not yet fully developed when senescence initiates. To investigate this hypothesis in more detail, the cell wall composition of our polyploid plants was compared to that of diploid Arabidopsis stems harvested at different developmental stages (Fig. 9). The five developmental stages chosen were 5, 10, 15, and 27 cm of stem height and fully grown stems that were still green. The amount of CWR per dry weight increased over the different stages, which is in line with the known increase in cell wall deposition during stem growth. Together with the increase in cell wall deposition, lignin and cellulose contents increased whereas MPS content decreased. In addition, MPS in younger Arabidopsis stems had a gradual reduction in Xyl and a gradual increase in arabinose and Gal content. The resemblance between the cell wall composition of the fully senesced higher polyploids and immature stems of diploids supported the hypothesis that our polyploid Arabidopsis plants start senescence while still having immature cell walls.
Table 2. Composition of matrix polysaccharides.
All values given are in mol%. Data are means ± sd. Different lowercase letters following values indicates statistically significant difference; n = 8 pools of two or more biological replicates; statistical analysis was done with univariate analysis and Scheffe post-hoc testing in SPSS; α = 0.05.
| Monosaccharide | 2n | 4n | 6n | 8n |
|---|---|---|---|---|
| Rhamnose | 2.62 ± 0.18 a | 2.56 ± 0.19 a | 3.14 ± 0.63 a,b | 3.51 ± 0.50 b |
| Fuc | 1.17 ± 0.11 a | 1.22 ± 0.10 a | 2.40 ± 0.82 b | 2.30 ± 0.52 b |
| Arabinose | 6.96 ± 1.40 a | 12.90 ± 1.34 b | 16.58 ± 3.19 c | 20.33 ± 3.08 d |
| Xyl | 75.78 ± 3.19 a | 65.45 ± 1.80 b | 54.27 ± 8.58 c | 48.74 ± 7.97 c |
| Man | 1.69 ± 0.15 a | 1.56 ± 0.10 a | 1.64 ± 0.26 a | 1.87 ± 0.51 a |
| Glc | 0.54 ± 0.03 a | 0.82 ± 0.46 a | 0.94 ± 0.48 a | 0.95 ± 0.54 a |
| Gal | 11.16 ± 1.53 a | 15.54 ± 1.23 b | 21.04 ± 4.27 c | 23.68 ± 3.14 c |
Figure 8.
Carbohydrate microarray on different fractions of cell wall extracts. All spot intensity values are relative to the highest fluorescence value. Pectins are extracted with 1,2-cyclohexylenedinitrilotetraacetic acid (CDTA), hemicelluloses with NaOH. 2n, diploid; 4n, tetraploid; 6n, hexaploid; 8n, octaploid. HG = homogalacturonan, AGP = arabinogalactan protein; intensity of green coloration is indicative of higher values. n = 8 pools of 2 or more biological replicates.
Figure 9.
Cell wall composition of polyploid Arabidopsis compared to different developmental stages of diploid main stems. A, The amount of cell wall residue (CWR) and CW components of fully senesced polyploids (4n, tetraploid; 6n, hexaploid; 8n, octaploid) are given relative to fully senesced diploid stems (2n), a series of diploid stems at different stages of development (5 cm, 10 cm, 15 cm, 27 cm), and fully grown diploid stems that had not yet started to senesce (Green). B, The amount of monosaccharides in the MPS fraction relative to that in fully senesced diploid stems (2n). Error bars represent SD; n = 8 pools of 2 or more biological replicates.
The Effect of Ploidy Level on Saccharification Yield
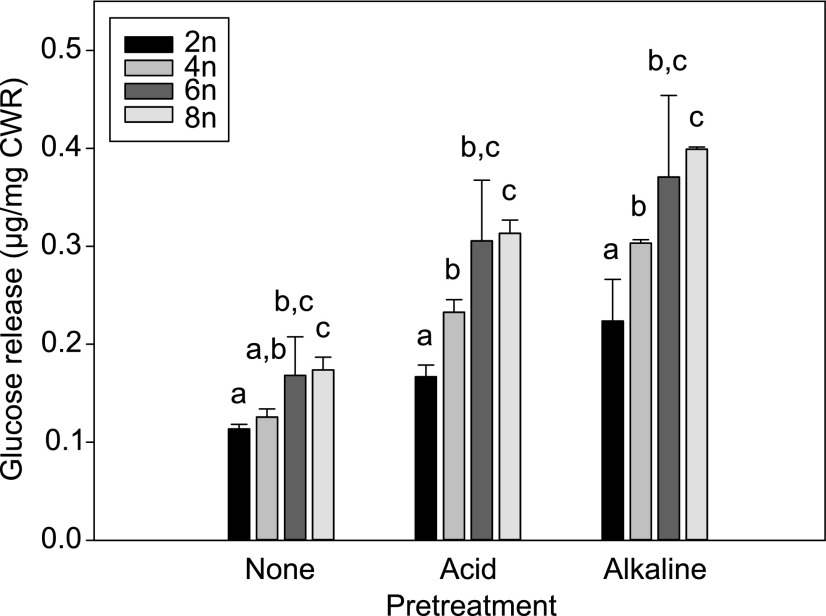
To study the potential of polyploidy as a means to improve plant biomass processing, we investigated the effect of ploidy level on saccharification, i.e. the enzymatic release of Glc from biomass. Saccharification assays were performed with or without an acid or alkaline pretreatment, after which the biomass was incubated with an enzyme mixture containing cellulase and cellobiase. The amount of Glc released over time was measured and expressed on a CWR basis. All saccharification assays were stopped after 96 h as plateau levels were reached before that time point. The amount of Glc released on a CWR basis increased with rising ploidy levels (Fig. 10). When no pretreatment was applied, a significant increase in saccharification yield was observed for the hexaploids and octaploids of 48% and 52%, respectively. In tetraploids, no significant difference was found.
Figure 10.
Saccharification yield of polyploid Arabidopsis. The amount of Glc released per Arabidopsis polyploid (2n, diploid; 4n, tetraploid; 6n, hexaploid; 8n, octaploid) cell wall residue (CWR) is given for saccharification without pretreatment (None), after acid pretreatment (Acid), and after alkaline pretreatment (Alkaline). Error bars represent SD; different lowercase letters indicate statistically significant difference; n = 8 pools of 2 or more biological replicates; statistical analysis was done with univariate analysis and Scheffe posthoc testing in SPSS; α = 0.05.
After applying either an acid or an alkaline pretreatment, all saccharification values were significantly higher compared to the respective values without pretreatment. In addition, the values for all our polyploid lines were significantly higher compared to those of diploids, with observed increases of 39% and 35% for tetraploids, 83% and 65% for hexaploids, and 87% and 78% for octaploids, after acid and alkaline pretreatment, respectively. Hence, both acid and alkaline pretreatments increased the differences in saccharification yield between the diploids and polyploids on a CWR basis.
In conclusion, our polyploid Arabidopsis lines have a gradual delay in development, which has profound effects on both biomass production, cell wall composition, and saccharification yield.
DISCUSSION
One of the first reports on polyploidization in plants describes a whole genome duplication event that restored fertility in tobacco hybrids (Clausen and Goodspeed, 1925). This study sparked general interest in the potential value of polyploids to overcome sterility in hybrids. In addition, the increased vigor of some polyploids compared to that of their diploid counterparts triggered the agricultural interest to implement polyploidization in classical breeding programs (Randolph, 1942; Mendoza and Haynes, 1974; Crow, 1994; Katepa-Mupondwa et al., 2002; Sattler et al., 2016). Over the past decades, research on polyploids has enjoyed a renaissance, mainly from an evolutionary point of view, where genome duplication is considered a playground for evolution. It is widely accepted that polyploidy provides genomic plasticity for functional divergence of duplicated genes, genome and/or chromosome restructuring, transcriptome changes, and gene dosage effects, hence contributing to evolution (Soltis and Soltis, 1999; Comai, 2005). Despite this regained focus, the question of how whole genome duplication affects plant growth and development remains unanswered. Early attempts to unravel the mechanistic connection between genotype and phenotype of polyploids focused on allopolyploids which originate from interspecific hybridization followed by genome duplication (Comai, 2005). However, these polyploids have distinct subgenomes, which may result in confounding effects due to differential contribution of the parental genomes. To avoid this drawback, interest shifted toward autopolyploids, which originate from an intraspecific hybridization or self-fertilization involving unreduced gametes. Over the years autopolyploids have been generated for numerous plant species including Arabidopsis, Malus spp., Solanum tuberosum, Salix spp., and Thymus spp. (Stupar et al., 2007; Tavan et al., 2015; Dudits et al., 2016; Ma et al., 2016; Vergara et al., 2016). Although these studies provided some interesting insight into the effect of genome duplication on plant growth, they rarely went beyond the tetraploid level, and thus missed the opportunity to study trends between ploidy level and phenotype. Hence, to gain more insight into the direct effects of increasing ploidy levels on plant growth and development, both at the organ as well as at the cellular and macromolecular level, we created a series of Arabidopsis plants with increasing ploidy level.
An increase in DNA content, as is the case in polyploids, generally leads to an increased cell and organ size (Müntzing, 1936). However, the effects on biomass as a whole are more contradictory: although increased biomass observed in autotetraploid Arabidopsis, Miscanthus spp., and Salix spp. have contributed to the general belief that polyploidy increases biomass production (Glowacka et al., 2010; Li et al., 2012; del Pozo and Ramirez-Parra, 2014; Dudits et al., 2016), it has been shown that inbred autotetraploid Triticum monococcum and autotetraploid Malus x domestica plants are smaller than their diploid counterparts (Kuspira et al., 1985; Singh, 2003; Ma et al., 2016). Our data support that polyploid Arabidopsis Col-0 plants have larger cells, seeds, and flowers as compared to that in diploids. In addition, our tetraploid and hexaploid Arabidopsis plants have significantly larger rosettes at the time of bolting, with the tetraploids also having a significant increase in stem dry weight compared to that in diploids. This trend of increased biomass production in Arabidopsis polyploids does not extend, however, to the octaploids. Due to their slower growth, the increase in cell size observed in octaploids was not reflected by an increase in rosette area and stem dry weight, most likely due to a strongly reduced cell division rate. In support of this, a negative correlation was found between the number of cells per leaf and ploidy level, hinting toward a difficulty for the polyploids to maintain the same cell number as that in diploids. This phenomenon has been postulated before as the “high-ploidy syndrome,” where higher ploidy levels exhibit enhanced cell expansion but a reduced cell division (Tsukaya, 2008). A possible explanation for this phenomenon is an increase in energy demand to support cell division in higher polyploids (Comai, 2005; Tsukaya, 2008). Duplication of the genome requires double the amount of nucleotides to replicate the genome before cell division. It is conceivable that a trade-off exists between DNA content and the number of cell divisions, as this will become more resource demanding in polyploid plants. Alternatively, the number of chromosomes in polyploid nuclei might pass a threshold for error-free segregation in mitotic cell division (Comai, 2005), hence increasing chances of aneuploidy induction that may delay overall cell proliferation. In support of this, it has been shown that autotetraploid Saccharomyces cerevisiae have a higher rate of aneuploid offspring compared to their diploid counterparts resulting from mitotic loss of chromosomes (Mayer and Aguilera, 1990). A third possible explanation for the reduction in mitotic cell division is spatial constraints. It has been hypothesized that the spatial organization of chromosomes during metaphase alignment and spindle attachment is perturbed or delayed as a consequence of the increased number of chromosomes in the polyploid nucleus (Comai, 2005). Our data on rosette size, cell number, and stem biomass support the high ploidy syndrome hypothesis. The peak in biomass production in the tetraploids is (partially) reverted in hexa- and octaploids. Taken together, our observations underline the importance of using a range of ploidy levels to study the effects of polyploidy on plant biomass production. By doing so, we were able to find both correlations (ploidy level vs. cell size and number) and thresholds (ploidy level vs. biomass yield) regarding the effects of polyploidy that would not have become evident if only tetraploids were compared to diploids.
Besides a shift in the amount of biomass produced, polyploidy can also have an impact on biomass composition. This was shown before in tetraploid willow trees, which, when compared to their diploid counterparts, were taller and contained less lignin (Serapiglia et al., 2015). Here, we studied the effects of polyploidy on cell wall composition in more detail by characterizing the cell wall in a series of Arabidopsis polyploids (2n, 4n, 6n, and 8n). Profound differences in CWR, lignin, cellulose, and MPS content were found in the polyploids compared to that in the diploid, and these differences were strongly correlated with the ploidy level, indicating a link between the basic somatic ploidy level and general biomass composition. Interestingly, the cell wall structure and composition of polyploids, most notably hexa- and octaploids, showed characteristics of immature secondary cell walls, with increased amounts of extensin, arabinogalactan proteins, and MPS, lower levels of cellulose and lignin, and a reduced thickness of the secondary cell wall. Despite the claimed correlation between ploidy level and biomass composition, we cannot exclude that the observed phenotypes are the consequence of genomic rearrangements induced by polyploidization (Liu et al., 2017). However, since the phenotype of the tetraploids corresponds to that of earlier publications, including the larger cells, flowers, seeds, and stems and a delayed bolting (Li et al., 2012; del Pozo and Ramirez-Parra, 2014; Vergara et al., 2016), it is highly unlikely that genomic changes other than whole genome duplications are at the origin of the described phenotypes.
One of the most striking shifts in the cell wall of our polyploid lines is the gradual drop in lignin content. Similar reductions in lignin amount have been observed in several of the lignin biosynthesis mutants (Jones et al., 2001; Franke et al., 2002; Hoffmann et al., 2004; Chen and Dixon, 2007). In contrast to the polyploids studied here, the lignin mutants with a lignin content below a certain threshold show a dwarfed and bushy phenotype. For example, the Arabidopsis caffeoyl shikimate esterase (cse) mutant with a 36% reduction in lignin content has a stunted phenotype, which is reflected by a 42% reduction in stem biomass (Vanholme et al., 2013). It has been proposed that this growth phenotype is a direct consequence of collapsed vessels in the stem due to a reduced cell wall strength, since restoring normal vessel cell wall composition in a tissue-specific way restores the yield penalty (Vargas et al., 2016). Although we did find a few collapsed vessels in the hexaploids and octaploids, they were by far not as numerous as in the cse mutant for example, where 45 to 60% of all vessels are collapsed (Vargas et al., 2016). This is in line with the absence of a dwarf growth phenotype in the polyploids. Apparently, the polyploids reallocate their resources toward the vessels to enhance their stability, avoid vessel collapse, and ensure erect growth.
As lignin is considered the most important factor limiting saccharification efficiency, the significant reduction in lignin content following polyploidization may have a positive effect on saccharification yield. In addition, the increase in arabinose and Gal content, and reduction in Xyl content, as exhibited by polyploids, is also thought to be linked to an improved saccharification potential (Van Acker et al., 2013). The combination of an enhanced saccharification potential together with an increase in biomass makes polyploidy a promising approach to further improve feedstock quality for the production of energy and materials. In tetraploid Arabidopsis plants, the dry weight of the stem was doubled and saccharification yield significantly increased when using an acid or alkaline pretreatment. Saccharification yield was even higher in hexa- and octaploids. However, these higher polyploids showed reduced biomass production compared to that in tetraploids. Thus, assuming that the data from Arabidopsis can be extrapolated to crops, higher level polyploids would be less interesting from an industrial perspective.
MATERIALS AND METHODS
Plant Material and Growth Conditions
All Arabidopsis (Arabidopsis thaliana) plants were of the Col-0 ecotype. Polyploids were generated using colchicine treatment as previously described (De Storme and Geelen, 2011). The somatic ploidy level of all plants included in the experiments was confirmed using DNA flow cytometry. To quantify rosette area, plants were sown on soil and stratified for 3 d at 4°C before being transferred to 21°C in long-day light conditions (LD; 16-h light/8-h dark).
To maximize the inflorescence stem biomass and cell wall formation for microscopy and cell wall characterization, plants were grown on soil at 21°C under short-day light conditions (SD; 8-h light/16-h dark) for 8 weeks before being transferred to LD (Vanholme et al., 2014). Plants for microscopy were harvested when the main inflorescence stem reached 30 cm in length. Polyploid plants for cell wall characterization were harvested when they were fully senesced and dry. The plants for the developmental series were harvested when they reached their corresponding height (i.e. 5, 10, 15, 27 cm or when stems stopped growing but were still green).
Flow Cytometry
To determine the basic somatic ploidy level, a small leaf fragment (∼ 5mm2) of each individual plant was harvested and chopped using a sharp razor blade. The nuclei were isolated by adding 200 μl of Cystain UV Precise P nuclei extraction buffer, and subsequently stained using 800 μl of Cystain UV Precise P staining buffer (Partec, http://www.partec.com) before filtering using a 30-μm mesh. Flow cytometry was performed using a Cyflow flow cytometer (Partec) and the results were analyzed using Cyflogic software v1.2.1 (http://www.cyflogic.com/).
Leaf Growth Parameters
To measure the rosette area, pictures were taken over time and the projected area was determined using ImageJ software (http://rsb.info.nih.gov/ij/). These data were then subjected to LEAF-E analysis to determine several growth parameters (Voorend et al., 2014).
To determine cell area and number, first the end-point of growth was determined for the first real leaf pair (L1/2). For this, the leaves of seven plants were harvested at several time-points and the areas were determined using ImageJ software (http://rsb.info.nih.gov/ij/). These data were then analyzed using the LEAF-E tool to determine the end-point of growth for all ploidy levels, and a safety margin of 5 d was used. The first two leaves of the rosette were harvested and put overnight in 70% (v/v) ethanol, mounted in lactic acid onto a microscopy slide and photographed. For four leaves, the epidermal cells at the basal abaxial side were drawn using a DMLB microscope (Leica) fitted with a drawing tube and differential interference contrast objective. Leaf area of the photographed leaves was determined using ImageJ software (http://rsb.info.nih.gov/ij/). The average cell area was calculated as described in Andriankaja et al. (2012). Leaf and cell areas were used to calculate cell numbers.
Stem Growth Parameters
To quantify stem growth rate, we measured the time it took between induction of bolting and the main stem to reach 30 cm. When the plants were fully senesced and dry, the seeds and cauline leaves were removed and the main inflorescence stem was harvested, measured, and weighed. The side branches of the main stem along with the other inflorescences that emerged from the rosette were harvested separately and weighed as well. The bottom 1 cm of the main stem was removed and the lowest 10 cm of the remaining stem was weighed again, and chopped into 2-mm pieces. The chopped stem pieces of two or three stems were pooled to obtain eight biological replicates. These pooled replicates were used for further cell wall analyses and saccharification assays.
Microscopy of the Stem
The primary inflorescence stem was harvested when it reached a length of 30 cm. The bottom 1 cm was removed, and the subsequent bottom 1 cm was used for making sections. The stem parts were cut into small pieces and immersed in a fixative solution of 2.5% (v/v) glutaraldehyde, 4% (w/v) formaldehyde in 0.1 m Na-cacodylate buffer, placed in a vacuum oven for 30 min and then left rotating for 3 h at room temperature. This solution was later replaced with fresh fixative and samples were left rotating overnight at 4°C. After washing, samples were postfixed in 1% (v/v) OsO4 with K3Fe(CN)6 in 0.1 m Na-cacodylate buffer, pH 7.2. Samples were dehydrated through a graded ethanol series, including a bulk staining with 2% (w/v) uranyl acetate at the 50% (v/v) ethanol step followed by embedding in Spurr’s resin. In order to have a larger overview of the phenotype, semithin sections were first cut at 0.5 µm and stained with toluidine blue. Images were acquired using a Zeiss Axioskop 2 microscope. Ultrathin sections of a gold interference color were cut using an ultra-microtome (Leica EM UC7), followed by poststaining with uranyl acetate and lead citrate in a Leica EM AC20 and collected on formvar-coated copper slot grids. They were viewed with a JEM 1400plus transmission electron microscope (JEOL, Tokyo, Japan) operating at 60 kV.
To quantify the thickness of the primary and secondary cell wall, the high-magnification TEM micrographs were used. The cell wall of ten cells from five independent plants was analyzed for each ploidy level and the thickness was calculated using ImageJ software.
For the Mäule staining, the bottom 1 cm of the stem was harvested and stored in 70% (v/v) ethanol. Sections of 100 µm were made using a vibratome (Campden Instruments, Loughborough, 785 United Kingdom). The Mäule staining was performed as described earlier (Sundin et al., 2014). Images were acquired using a Zeiss Axioskop 2 microscope.
Cell Wall Preparation
A purified cell wall extract was prepared using sequential washing steps of dry plant material, as described in Robinson and Mansfield (Robinson and Mansfield, 2009). The washing steps were done for 30 min at near boiling temperatures in water (98°C), ethanol (76°C), chloroform (59°C), and acetone (54°C). The remaining CWR was dried under vacuum and weighed.
Cell Wall Analysis
Lignin content, thioacidolysis, and MPS composition were determined as previously reported (Van Acker et al., 2013). Cellulose content was determined as reported in Sundin et al. (2014).
Carbohydrate microarrays were generated and analyzed according to Moller et al. (2007). In brief, dry stem material was frozen in liquid N2 and ground using a Retsch mill. Alcohol insoluble residue (AIR) was prepared as follows: the ground material was washed sequentially using 70% (v/v) ethanol, 1:1 methanol/chloroform, and acetone and dried under vacuum. The AIR was then subjected to sequential extraction with with 50 mm 1,2-cyclohexylenedinitrilotetraacetic acid (CDTA), pH 7.5, and 4 m NaOH with 0.1% (v/v) NaBH4 and spotted onto a nitrocellulose membrane with a pore size of 0.45 μm (Whatman, Maidstone, UK) using an Arrayjet Sprint (Arrayjey, Roslin, UK). The arrays were probed and analyzed as described earlier (Pedersen et al., 2012). Each value in the resulting heat map is the average of ten biological replicates represented by four technical replicates with four dilutions each. The highest value is indexed to 100 and a cut-off of five has been introduced.
Saccharification Assays
Saccharification was performed according to Van Acker et al. (2016). For alkaline pretreatment, 0.25% (w/v) NaOH was used. For acid pretreatment, 1 n HCl was used. The enzyme mix contained cellulase from Trichoderma reesei ATCC 26921 and cellobiase (Novozyme, Bagsvaerd, Denmark). Both enzymes were desalted over an Econo-Pac 10 DG column (Bio-Rad, Hercules, CA, USA), stacked with Bio-gel P-6 DG gel (Bio-Rad) according to the manufacturer’s guidelines. The activity of the enzyme mix was determined with a filter paper assay (Xiao et al., 2004) and an activity of 0.06 filter paper units was added to each sample.
Supplemental Data
The following supplemental materials are available.
Supplemental Figure S1.. Flow cytometric analysis of ploidy in Arabidopsis leaves.
Supplemental Figure S2.. Mäule staining of transverse stem sections of polyploid Arabidopsis.
Supplemental Table S1.. Organ size of polyploid Arabidopsis.
Acknowledgments
The authors would like to thank Andreas Pallidis, Ward Steenackers, Rik Martens, and Olivier Leroux for technical assistance, Karel Spruyt for imaging assistance, and Ilse Vercauteren and Lieven De Veylder for help during the revision process.
Footnotes
This work was supported by grants from the Multidisciplinary Research Partnership “Biotechnology for a Sustainable Economy” (01MRB510W) of Ghent University; S.C. is supported by the Research Foundation Flanders for a predoctoral fellowship (FWO; 3G032912) and the IWT-SBO project BIOLEUM (grant no. 130039); N.D.S. is supported by the Research Foundation Flanders (FWO; 1293014N); J.U.F. is supported partly by the Innovation Fund Denmark (IFD; 5112-00006B).
Articles can be viewed without a subscription.
Senior authors.
References
- Andriankaja M, Dhondt S, De Bodt S, Vanhaeren H, Coppens F, De Milde L, Mühlenbock P, Skirycz A, Gonzalez N, Beemster GT, Inzé D (2012) Exit from proliferation during leaf development in Arabidopsis thaliana: a not-so-gradual process. Dev Cell 22: 64–78 [DOI] [PubMed] [Google Scholar]
- Bamakhramah HS, Halloran GM, Wilson JH (1984) Components of Yield in Diploid, Tetraploid and Hexaploid Wheats (Triticum Spp). Ann Bot (Lond) 54: 51–60 [Google Scholar]
- Buxton DR, Russell JR (1988) Lignin Constituents and Cell-Wall Digestibility of Grass and Legume Stems. Crop Sci 28: 553–558 [Google Scholar]
- Cai D, Chen J, Chen D, Dai B, Zhang W, Song Z, Yang Z, Du C, Tang Z, He Y, Zhang D, He G, et al. (2007) The breeding of two polyploid rice lines with the characteristic of polyploid meiosis stability. Sci China C Life Sci 50: 356–366 [DOI] [PubMed] [Google Scholar]
- Chen ZJ. (2010) Molecular mechanisms of polyploidy and hybrid vigor. Trends Plant Sci 15: 57–71 [DOI] [PMC free article] [PubMed] [Google Scholar]
- Chen F, Dixon RA (2007) Lignin modification improves fermentable sugar yields for biofuel production. Nat Biotechnol 25: 759–761 [DOI] [PubMed] [Google Scholar]
- Chen L, Auh C, Chen F, Cheng X, Aljoe H, Dixon RA, Wang Z (2002) Lignin deposition and associated changes in anatomy, enzyme activity, gene expression, and ruminal degradability in stems of tall fescue at different developmental stages. J Agric Food Chem 50: 5558–5565 [DOI] [PubMed] [Google Scholar]
- Clausen RE, Goodspeed TH (1925) Interspecific hybridization in Nicotiana. II. A tetraploid Glutinosa-Tabacum hybrid, an experimental verification of Winge’s hypothesis. Genetics 10: 278–284 [DOI] [PMC free article] [PubMed] [Google Scholar]
- Comai L. (2005) The advantages and disadvantages of being polyploid. Nat Rev Genet 6: 836–846 [DOI] [PubMed] [Google Scholar]
- Crow JF. (1994) Hitoshi Kihara, Japan’s pioneer geneticist. Genetics 137: 891–894 [DOI] [PMC free article] [PubMed] [Google Scholar]
- del Pozo JC, Ramirez-Parra E (2014) Deciphering the molecular bases for drought tolerance in Arabidopsis autotetraploids. Plant Cell Environ 37: 2722–2737 [DOI] [PubMed] [Google Scholar]
- del Pozo JC, Ramirez-Parra E (2015) Whole genome duplications in plants: an overview from Arabidopsis. J Exp Bot 66: 6991–7003 [DOI] [PubMed] [Google Scholar]
- De Storme N, Geelen D (2011) The Arabidopsis mutant jason produces unreduced first division restitution male gametes through a parallel/fused spindle mechanism in meiosis II. Plant Physiol 155: 1403–1415 [DOI] [PMC free article] [PubMed] [Google Scholar]
- Dudits D, Török K, Cseri A, Paul K, Nagy AV, Nagy B, Sass L, Ferenc G, Vankova R, Dobrev P, Vass I, Ayaydin F (2016) Response of Organ Structure and Physiology to Autotetraploidization in Early Development of Energy Willow Salix viminalis. Plant Physiol 170: 1504–1523 [DOI] [PMC free article] [PubMed] [Google Scholar]
- Franke R, Hemm MR, Denault JW, Ruegger MO, Humphreys JM, Chapple C (2002) Changes in secondary metabolism and deposition of an unusual lignin in the ref8 mutant of Arabidopsis. Plant J 30: 47–59 [DOI] [PubMed] [Google Scholar]
- Glowacka K, Jezowski S, Kaczmarek Z (2010) In vitro induction of polyploidy by colchicine treatment of shoots and preliminary characterisation of induced polyploids in two Miscanthus species. Ind Crops Prod 32: 88–96 [Google Scholar]
- Hoffmann L, Besseau S, Geoffroy P, Ritzenthaler C, Meyer D, Lapierre C, Pollet B, Legrand M (2004) Silencing of hydroxycinnamoyl-coenzyme A shikimate/quinate hydroxycinnamoyltransferase affects phenylpropanoid biosynthesis. Plant Cell 16: 1446–1465 [DOI] [PMC free article] [PubMed] [Google Scholar]
- Jones L, Ennos AR, Turner SR (2001) Cloning and characterization of irregular xylem4 (irx4): a severely lignin-deficient mutant of Arabidopsis. Plant J 26: 205–216 [DOI] [PubMed] [Google Scholar]
- Katepa-Mupondwa FM, Christie BR, Michaels TE (2002) An improved breeding strategy for autotetraploid alfalfa (Medicago sativa L.). Euphytica 123: 139–146 [Google Scholar]
- Kuspira J, Bhambhani RN, Shimada T (1985) Genetic and Cytogenetic Analyses of the A Genome of Triticum monococcum. 1. Cytology, Breeding-Behavior, Fertility, and Morphology of Induced Autotetraploids. Can J Genet Cytol 27: 51–63 [Google Scholar]
- Li X, Yu E, Fan C, Zhang C, Fu T, Zhou Y (2012) Developmental, cytological and transcriptional analysis of autotetraploid Arabidopsis. Planta 236: 579–596 [DOI] [PubMed] [Google Scholar]
- Liu S, Yang Y, Wei F, Duan J, Braynen J, Tian B, Cao G, Shi G, Yuan J (2017) Autopolyploidy leads to rapid genomic changes in Arabidopsis thaliana. Theory Biosci 136: 199–206 [DOI] [PubMed] [Google Scholar]
- Ma Y, Xue H, Zhang L, Zhang F, Ou C, Wang F, Zhang Z (2016) Involvement of Auxin and Brassinosteroid in Dwarfism of Autotetraploid Apple (Malus × domestica). Sci Rep 6: 26719. [DOI] [PMC free article] [PubMed] [Google Scholar]
- Mayer VW, Aguilera A (1990) High levels of chromosome instability in polyploids of Saccharomyces cerevisiae. Mutat Res 231: 177–186 [DOI] [PubMed] [Google Scholar]
- Mendoza HA, Haynes FL (1974) Genetic basis of heterosis for yield in the autotetraploid potato. Theor Appl Genet 45: 21–25 [DOI] [PubMed] [Google Scholar]
- Mohnen D. (2008) Pectin structure and biosynthesis. Curr Opin Plant Biol 11: 266–277 [DOI] [PubMed] [Google Scholar]
- Moller I, Sørensen I, Bernal AJ, Blaukopf C, Lee K, Øbro J, Pettolino F, Roberts A, Mikkelsen JD, Knox JP, Bacic A, Willats WG (2007) High-throughput mapping of cell-wall polymers within and between plants using novel microarrays. Plant J 50: 1118–1128 [DOI] [PubMed] [Google Scholar]
- Morrison IM. (1980) Changes in the Lignin and Hemicellulose Concentrations of 10 Varieties of Temperate Grasses with Increasing Maturity. Grass Forage Sci 35: 287–293 [Google Scholar]
- Mottiar Y, Vanholme R, Boerjan W, Ralph J, Mansfield SD (2016) Designer lignins: harnessing the plasticity of lignification. Curr Opin Biotechnol 37: 190–200 [DOI] [PubMed] [Google Scholar]
- Müntzing A. (1936) The evolutionary significance of autopolyploidy. Hereditas 21: 363–378 [Google Scholar]
- Pedersen HL, Fangel JU, McCleary B, Ruzanski C, Rydahl MG, Ralet MC, Farkas V, von Schantz L, Marcus SE, Andersen MC, Field R, Ohlin M, et al. (2012) Versatile high resolution oligosaccharide microarrays for plant glycobiology and cell wall research. J Biol Chem 287: 39429–39438 [DOI] [PMC free article] [PubMed] [Google Scholar]
- Petrik DL, Karlen SD, Cass CL, Padmakshan D, Lu F, Liu S, Le Bris P, Antelme S, Santoro N, Wilkerson CG, Sibout R, Lapierre C, et al. (2014) p-Coumaroyl-CoA:monolignol transferase (PMT) acts specifically in the lignin biosynthetic pathway in Brachypodium distachyon. Plant J 77: 713–726 [DOI] [PMC free article] [PubMed] [Google Scholar]
- Ramsey J, Schemske DW (2002) Neopolyploidy in flowering plants. Annu Rev Ecol Syst 33: 589–639 [Google Scholar]
- Randolph LF. (1942) The influence of heterozygosis on fertility and vigor in autotetraploid maize. Genetics 27: 163 [Google Scholar]
- Renny-Byfield S, Wendel JF (2014) Doubling down on genomes: polyploidy and crop plants. Am J Bot 101: 1711–1725 [DOI] [PubMed] [Google Scholar]
- Robinson AR, Mansfield SD (2009) Rapid analysis of poplar lignin monomer composition by a streamlined thioacidolysis procedure and near-infrared reflectance-based prediction modeling. Plant J 58: 706–714 [DOI] [PubMed] [Google Scholar]
- Sattler MC, Carvalho CR, Clarindo WR (2016) The polyploidy and its key role in plant breeding. Planta 243: 281–296 [DOI] [PubMed] [Google Scholar]
- Scheller HV, Ulvskov P (2010) Hemicelluloses. Annu Rev Plant Biol 61: 263–289 [DOI] [PubMed] [Google Scholar]
- Serapiglia MJ, Gouker FE, Hart JF, Unda F, Mansfield SD, Stipanovic AJ, Smart LB (2015) Ploidy Level Affects Important Biomass Traits of Novel Shrub Willow (Salix) Hybrids. BioEnergy Res 8: 259–269 [Google Scholar]
- Sibout R, Le Bris P, Legée F, Cézard L, Renault H, Lapierre C (2016) Structural Redesigning Arabidopsis Lignins into Alkali-Soluble Lignins through the Expression of p-Coumaroyl-CoA:Monolignol Transferase PMT. Plant Physiol 170: 1358–1366 [DOI] [PMC free article] [PubMed] [Google Scholar]
- Singh RJ. (2003) Plant Cytogenetics, 2nd edition. CRC Press, Boca Raton London New York Washington, D.C. [Google Scholar]
- Smith RA, Gonzales-Vigil E, Karlen SD, Park JY, Lu F, Wilkerson CG, Samuels L, Ralph J, Mansfield SD (2015) Engineering Monolignol p-Coumarate Conjugates into Poplar and Arabidopsis Lignins. Plant Physiol 169: 2992–3001 [DOI] [PMC free article] [PubMed] [Google Scholar]
- Soltis DE, Soltis PS (1999) Polyploidy: recurrent formation and genome evolution. Trends Ecol Evol 14: 348–352 [DOI] [PubMed] [Google Scholar]
- Stupar RM, Bhaskar PB, Yandell BS, Rensink WA, Hart AL, Ouyang S, Veilleux RE, Busse JS, Erhardt RJ, Buell CR, Jiang J (2007) Phenotypic and transcriptomic changes associated with potato autopolyploidization. Genetics 176: 2055–2067 [DOI] [PMC free article] [PubMed] [Google Scholar]
- Sundin L, Vanholme R, Geerinck J, Goeminne G, Höfer R, Kim H, Ralph J, Boerjan W (2014) Mutation of the inducible ARABIDOPSIS THALIANA CYTOCHROME P450 REDUCTASE2 alters lignin composition and improves saccharification. Plant Physiol 166: 1956–1971 [DOI] [PMC free article] [PubMed] [Google Scholar]
- Tavan M, Mirjalili MH, Karimzadeh G (2015) In vitro polyploidy induction: changes in morphological, anatomical and phytochemical characteristics of Thymus persicus (Lamiaceae). Plant Cell Tissue Organ Cult 122: 573–583 [Google Scholar]
- Tsukaya H. (2008) Controlling size in multicellular organs: focus on the leaf. PLoS Biol 6: e174. [DOI] [PMC free article] [PubMed] [Google Scholar]
- Van Acker R, Vanholme R, Storme V, Mortimer JC, Dupree P, Boerjan W (2013) Lignin biosynthesis perturbations affect secondary cell wall composition and saccharification yield in Arabidopsis thaliana. Biotechnol Biofuels 6: 46. [DOI] [PMC free article] [PubMed] [Google Scholar]
- Van Acker R, Vanholme R, Piens K, Boerjan W (2016) Saccharification protocol for small-scale lignocellulosic biomass samples to test processing of cellulose into glucose. Bio Protoc 6: 9 [Google Scholar]
- Vanholme B, Vanholme R, Turumtay H, Goeminne G, Cesarino I, Goubet F, Morreel K, Rencoret J, Bulone V, Hooijmaijers C, De Rycke R, Gheysen G, et al. (2014) Accumulation of N-acetylglucosamine oligomers in the plant cell wall affects plant architecture in a dose-dependent and conditional manner. Plant Physiol 165: 290–308 [DOI] [PMC free article] [PubMed] [Google Scholar]
- Vanholme R, Morreel K, Darrah C, Oyarce P, Grabber JH, Ralph J, Boerjan W (2012a) Metabolic engineering of novel lignin in biomass crops. New Phytol 196: 978–1000 [DOI] [PubMed] [Google Scholar]
- Vanholme R, Storme V, Vanholme B, Sundin L, Christensen JH, Goeminne G, Halpin C, Rohde A, Morreel K, Boerjan W (2012b) A systems biology view of responses to lignin biosynthesis perturbations in Arabidopsis. Plant Cell 24: 3506–3529 [DOI] [PMC free article] [PubMed] [Google Scholar]
- Vanholme R, Cesarino I, Rataj K, Xiao Y, Sundin L, Goeminne G, Kim H, Cross J, Morreel K, Araujo P, Welsh L, Haustraete J, et al. (2013) Caffeoyl shikimate esterase (CSE) is an enzyme in the lignin biosynthetic pathway in Arabidopsis. Science 341: 1103–1106 [DOI] [PubMed] [Google Scholar]
- Vargas L, Cesarino I, Vanholme R, Voorend W, de Lyra Soriano Saleme M, Morreel K, Boerjan W (2016) Improving total saccharification yield of Arabidopsis plants by vessel-specific complementation of caffeoyl shikimate esterase (cse) mutants. Biotechnol Biofuels 9: 139. [DOI] [PMC free article] [PubMed] [Google Scholar]
- Vergara F, Kikuchi J, Breuer C (2016) Artificial Autopolyploidization Modifies the Tricarboxylic Acid Cycle and GABA Shunt in Arabidopsis thaliana Col-0. Sci Rep 6: 26515. [DOI] [PMC free article] [PubMed] [Google Scholar]
- Voorend W, Lootens P, Nelissen H, Roldán-Ruiz I, Inzé D, Muylle H (2014) LEAF-E: a tool to analyze grass leaf growth using function fitting. Plant Methods 10: 37. [DOI] [PMC free article] [PubMed] [Google Scholar]
- Wilkerson CG, Mansfield SD, Lu F, Withers S, Park JY, Karlen SD, Gonzales-Vigil E, Padmakshan D, Unda F, Rencoret J, Ralph J (2014) Monolignol ferulate transferase introduces chemically labile linkages into the lignin backbone. Science 344: 90–93 [DOI] [PubMed] [Google Scholar]
- Xiao Z, Storms R, Tsang A (2004) Microplate-based filter paper assay to measure total cellulase activity. Biotechnol Bioeng 88: 832–837 [DOI] [PubMed] [Google Scholar]


