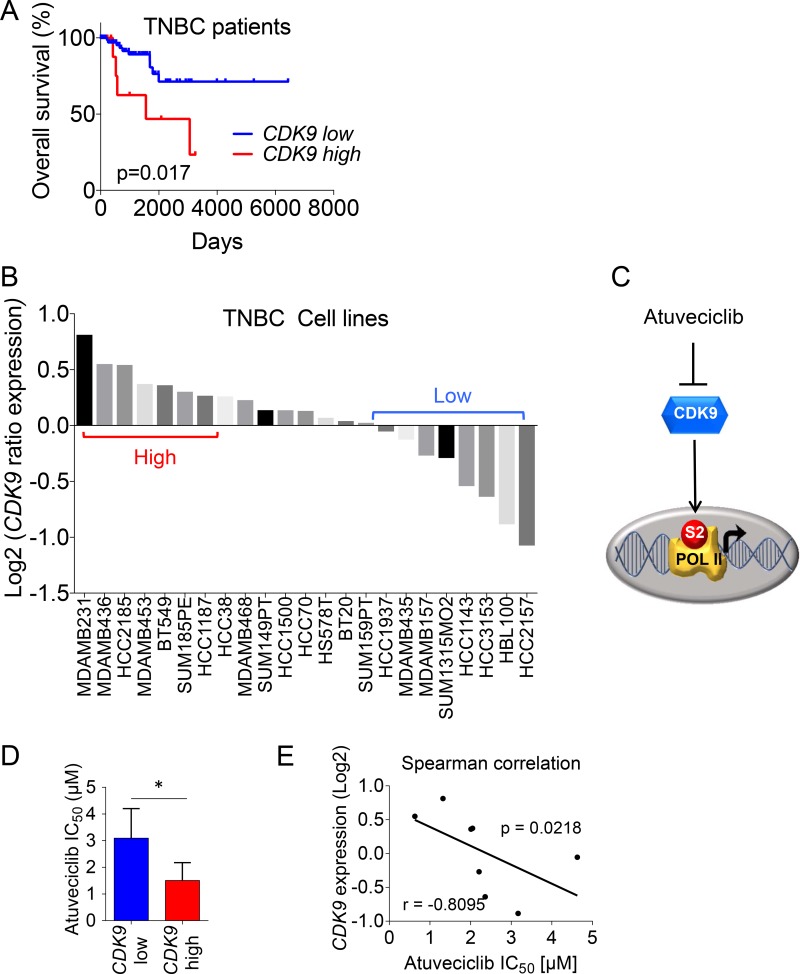
Figure 1. CDK9 expression in TNBC patients and cell lines.
(A) Kaplan-Meier analysis for overall survival rate based on CDK9 mRNA expression, RNA-seq data from a TCGA-cohort of 89 TNBC patients is shown. Log-rank (Mantel-Cox), p = 0.017. A list of sample IDs is provided in the supplement. (B) TNBC cell lines (n = 23) from the Neve_2006 dataset were analyzed for CDK9 expression. Gene expression data from Xena Browser (https://xenabrowser.net/) were ranked using GraphPad Prism. (C) Schematic representation of atuveciclib mode of action. (D) Comparison of atuveciclib IC50 values (see Supplementary Figure 2) between CDK9-high (n = 4) and – low (n = 4) TNBC cell lines. t-test was performed. *P < 0.05. (E) Log relative CDK9 expression of TNBC cell lines (n = 8), as determined in (B) versus atuveciclib IC50 from Supplementary Figure 2. Correlation was assessed using Spearman test (r = –0.8095, P = 0.0218).

