Abstract
The metabolism of the chemoprevention agent licochalcone A, which is a chemopreventive chalcone found in abundance in the licorice species Glycyrrhiza inflata, was investigated using human liver microsomes and human hepatocytes combined with analysis using high performance liquid chromatography-mass spectrometry (LC-MS). Five oxygenated phase I metabolites of licochalcone A were formed by human liver microsomes, including a catechol on the A-ring, two intramolecular cyclization products following epoxidation of the exocyclic alkene at position 5 of the B-ring, and two dioxygenated products. Nine phase II monoglucuronides of licochalcone A and its oxygenated phase I metabolites were formed during incubation with human hepatocytes. These included (E)-licochalcone A-4-glucuronide, (E)-licochalcone A-4’-glucuronide, (Z)-licochalcone A-4-glucuronide, glucuronic acid conjugates of all of the monooxygenated phase I metabolites, and glucuronides of the licochalcone catechol after methylation by catechol-O-methyl transferase. In addition, human hepatocytes formed one sulfate conjugate and one glutathione conjugate of licochalcone A. The structures of all major metabolites were determined using a combination of accurate mass measurement, LC-tandem mass spectrometry, LC-UV, nuclear magnetic resonance, and comparison with standards. The cytochrome P450 enzymes and UDP-glucuronosyltransferases responsible for the formation of the major metabolites were identified. Based on in vitro hepatic clearance calculations, licochalcone A is predicted to be metabolized primarily by phase II conjugation reactions.
Keywords: licorice, licochalcone A, mass spectrometry, cytochrome P450, UDP-glucuronosyltransferase
Graphical Abstract

Phase I and II metabolism of licochalcone A from the licorice species Glycyrrhiza inflata by human liver microsomes and hepatocytes determined using LC-MS/MS, LC-UV and NMR
Introduction
Ensuring the safety of botanical dietary supplements is a high priority for a market that continues to grow worldwide [1,2]. As in drug development, studies of the absorption, distribution, metabolism, excretion, and toxicity of active compounds from botanical dietary supplements can provide essential data for understanding the effects of these products. This information may then be used to design appropriate dosages and dosage forms for clinical trials of safety and efficacy [3]. Too often, clinical trials or animal studies of botanical dietary supplements and active compounds from these products result in negative outcomes due to lack of appropriate preclinical studies or the understanding of the bioavailabilities of the active constituents [4].
Among the oldest and most popular herbal medicines in the world [5], licorice (“Gan-Cao” in Chinese) is recorded in the pharmacopoeias of many Asian and Western countries [6,7]. The roots of three licorice species are commonly used in botanical dietary supplements and as medicinal plants, namely Glycyrrhiza glabra L, Glycyrrhiza uralensis Fisch., and Glycyrrhiza inflata Bat [8,9]. Licochalcone A ((E)-3-(4-hydroxy-2-methoxy-5-(2-methylbut-3-en-2-yl)phenyl)-1-(4-hydroxyphenyl)prop-2-en-1-one, Figure 1), is a Michael acceptor occurring in Glycyrrhiza inflata [10] root extracts at levels of approximately 8% (w/w) [11].
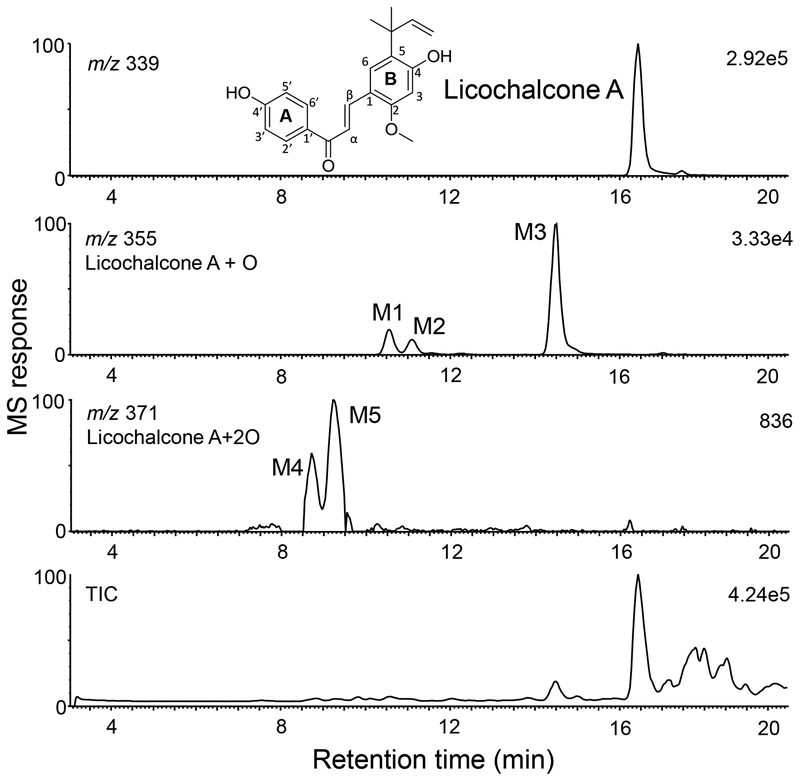
Figure 1.
Positive ion electrospray high resolution LC-MS total ion chromatogram (TIC) and computer-reconstructed mass chromatograms showing licochalcone A and its phase I metabolites (M1 – M5) following incubation with human liver microsomes and NADPH. Based on MS response (33,000 units for M1 – M3 compared with only 836 units for M4 and M5), M1 – M3 are considered major phase I metabolites.
As a chemoprevention agent, licochalcone A has been reported to inhibit the formation of genotoxic estrogen catechols [12] and to induce detoxification enzymes regulated by the antioxidant response element such as NAD(P)H:quinone oxidoreductase 1 via the Keap1/Nrf2 pathway [13]. In addition, licochalcone A has antimalarial [14], anticancer [15], antibacterial [16], and antiviral [17] properties. Although a promising chemoprevention agent, there has been no comprehensive evaluation of the phase I and phase II metabolism of licochalcone A.
Like pharmaceutical agents, natural products can be substrates for phase I and II metabolic enzymes, which include the phase I cytochromes P450 (CYP) and the phase II 5’-diphosphoglucuronyl transferases (UGTs) and sulfotransferases. Phase I metabolism might form products with new pharmacological activities or enhanced toxicity, while phase II conjugation reactions are more likely to form metabolites which are less active and become excreted more rapidly into urine or bile [18]. Phase I and phase II studies of licochalcone A metabolism were carried out using human liver microsomes, recombinant human metabolic enzymes and human hepatocytes. Metabolic stability assays were also carried out as a means of estimating intrinsic clearance of licochalcone A. Finally, the enzymes responsible for metabolic biotransformation of licochalcone A were identified using combinations of high performance liquid chromatography-mass spectrometry (LC-MS), LC-tandem mass spectrometry (MS/MS), LC-UV, nuclear magnetic resonance, and comparison with standards. Together, these data may be used to facilitate the design of animal studies and clinical trials of licochalcone A and licorice dietary supplements containing licochalcone A.
Materials and Methods
Materials
Licochalcone A (E-97%, Z-3% by NMR, Electronic Supplemental Material S1) and β-nicotinamide adenine dinucleotide phosphate, reduced sodium salt (NADPH), uridine 5’-diphosphoglucuronic acid triammonium salt (UDPGA), sulfatase, β-glucuronidase, sulfur trioxide-pyridine complex, and glutathione (GSH) were purchased from Sigma-Aldrich (St. Louis, MO). Pooled human liver microsomes (20 mg/mL, 150 men and women donors), cDNA-expressed human cytochrome P450 1A2, CYP2A6, CYP2B6, CYP2C8, CYP2C9, CYP2C18, CYP2C19, CYP2D6, CYP2E1, and CYP3A4 (0.5 nmol of P450 in 0.5 mL) and cDNA-expressed recombinant human UGTs including UGT1A1, UGT1A3, UGT1A4, UGT1A6, UGT1A7, UGT1A8, UGT1A9, UGT1A10, UGT2B4, UGT2B7, UGT2B15, and UGT2B17 (5 mg protein/mL), were purchased from Corning Life Sciences (Tewksbury, MA). HPLC-grade solvents were purchased from Thermo Fisher (Pittsburgh, PA). Cryopreserved human hepatocytes (50 donors pooled) and manufacturer-specified cell culture media were purchased from Thermo Fisher (Waltham, MA).
Microsomal incubations
Incubations of human liver microsomes consisted of 0.5 mg/mL of microsomal protein and either 20 μM licochalcone A and 100 mM phosphate buffer (pH 7.4) in a total volume of 0.3 mL for phase I studies, or 10 μM licochalcone A, 5 mM saccharic acid, 8 mM MgCl2, 25 μg/mL alamethicin, 100 mM phosphate buffer (pH 7.4) in a total volume of 0.4 mL for phase II studies. The phase I reactions were initiated by adding NADPH (1 mM) after a 5 min pre-incubation at 37 °C, and the phase II glucuronidation reactions were initiated by adding UDPGA (2 mM). After 60 min, each phase I incubation was terminated by adding 1 mL of ice-cold acetonitrile and chilling the resulting mixture on ice. Each phase II incubation was terminated in the same manner after 30 min. After centrifugation to remove precipitated proteins, the supernatants were removed and evaporated to dryness under a stream of dry nitrogen. Each residue was reconstituted in 200 μL of acetonitrile/water (30:70, v/v) immediately before analysis using high resolution LC-MS, LC-MS/MS or LC-UV.
Identification of cytochrome P450 enzymes
The cytochrome P450 enzymes involved in the formation of the most abundant mono-oxygenated licochalcone A metabolites (M1, M2 and M3, Figure 1) were determined using cDNA-expressed human recombinant cytochrome P450 enzymes. Licochalcone A (5 μM) in 0.2 mL of phosphate buffer (pH 7.4) was incubated with 5 pmol of each cytochrome P450 enzyme and 1 mM NADPH for 30 min at 37 °C. Each incubation was terminated by the addition of 0.8 mL ice-cold acetonitrile to precipitate proteins. After centrifugation for 15 min at 13000 ×g, the supernatants were analyzed directly using LC-MS/MS. Control experiments were carried out in parallel that were identical except for the omission of enzymes. All incubations were carried out at least three times, and the mean values of the metabolites were compared using one-way ANOVA with Tukey’s test, p < 0.01.
Hepatocyte incubations
Cryopreserved human hepatocytes were thawed according to the supplier’s instructions, and approximately 1 × 10⁶ cells in a 1-mL suspension were incubated with licochalcone A (10 μM) per well of a 6-well plate. Control experiments were identical except for the use of heat-inactivated hepatocytes. The plate was placed in an incubator at 37 °C with 5% CO2 and 90% relative humidity and gently shaken at 120 rpm for 4 h. Incubations were terminated by addition of 3 mL of ice-cold acetonitrile. The cell suspensions were centrifuged, and the supernatants were removed and evaporated to dryness under a stream of dry nitrogen. After reconstitution in 400 μL of water/acetonitrile (70:30, v/v), each residue was analyzed using LC-MS.
Deconjugation by β-glucuronidase and sulfatase
A 200 μL aliquot of each sample containing phase II conjugates was evaporated to dryness and reconstituted in 200 μL ammonium acetate buffer (10 mM, pH 5.0) containing a combination of β-glucuronidase (400 units) and sulfatase (40 units). The deconjugation reactions were carried out at 37 °C for 4 h and terminated by the addition of 600 μL ice-cold acetonitrile. After centrifugation, supernatants of each sample were analyzed using LC-MS/MS. Aliquots of samples not treated with hydrolytic enzymes were used as controls.
Synthesis of licochalcone A monosulfates and GSH conjugate
To determine the sites of conjugation of licochalcone A with sulfate, both monosulfate isomers were synthesized as previously described with some modifications [19,20]. Briefly, licochalcone A (1.7 mg, 5 μmol) was mixed with sulfur trioxide-pyridine complex (8 mg, 50 μmol; molar ratio, 1:10) in 0.5 mL dry pyridine and reacted at 60 °C for 3 h. The reaction was terminated by adding 0.5 mL 100 mM NaHCO3, and the reaction products were partially purified using reversed phase solid phase extraction. After reconstitution in 20% aqueous acetonitrile, each synthetic licochalcone A sulfate sample was analyzed using LC-MS/MS and LC-UV.
To prepare a GSH conjugate for comparison with licochalcone A metabolites, 10 μM licochalcone A was incubated for 1 h with 1 mg/mL human liver microsomes, 2 mM NADPH, and 5 mM GSH in 100 mM phosphate buffer (pH 7.4) with a total volume of 0.5 mL. After purification using C18 solid phase extraction, a single licocochalcone A GSH conjugate was identified using LC-MS/MS as described previously [21].
Identification of UGTs
cDNA-expressed human UGT1A1, UGT1A3, UGT1A4, UGT1A6, UGT1A7, UGT1A8, UGT1A9, UGT1A10, UGT2B4, UGT2B7, UGT2B15, or UGT2B17 was incubated with 10 μM licochalcone A. Briefly, each incubation also contained 0.25 mg UGT protein/mL, 5 mM saccharic acid, 8 mM MgCl2, 25 μg/mL alamethicin, and 100 mM phosphate buffer (pH 7.4) in a total volume of 0.4 mL at 37 °C. After 3 min pre-incubation, enzymatic reactions were initiated by adding UDPGA (2 mM final concentration). Incubations were terminated after 20 min and prepared for LC-MS/MS as described above for the microsomal incubations. All incubations were carried out at least three times, and the mean values of licochalcone A monoglucuronides were compared using one-way ANOVA with Tukey’s test, p < 0.01.
Metabolic stability
Licochalcone A (2 μM) was pre-incubated for 5 min at 37 °C with human liver microsomes (1 mg/mL) in phosphate buffer (pH 7.4, 100 mM) in a final volume of 500 μL. Phase I or phase II reactions were initiated by adding NADPH (1 mM) or UDPGA (2 mM), respectively. Aliquots (50 μL each) were removed at 0, 5, 10, 20, 30, 40, 50 and 60 min, and mixed with 300 μL ice-cold acetonitrile (containing 250 μM naringenin as internal standard). After centrifugation at 13,000 × g for 15 min, the supernatants were analyzed immediately using LC-MS/MS. Negative control incubations containing no microsomes were carried out in parallel under the same conditions.
Estimates of intrinsic clearance of licochalcone A were based on substrate disappearance during 60 min incubations with human liver microsomes after addition of NADPH or UDPGA. The slope of the linear regression curve (-k) from log percentage remaining of licochalcone A vs. incubation time was used to compute half-life using the following equation: t1/2= 0.693/ke. Hepatic intrinsic clearance (CLint, mL/min/kg) was calculated by using the following equation [22]:
SF, scaling factor (mL/kg); Gmicrsomes, the average quantity of microsomal protein in the liver (mg), Wt liver, liver weight (g); Wtbody, body weight (kg); and Cprotein, protein concentration in the reaction mixture (mg/mL). Gmicrosomes/Wt liver was approximately to be 45 mg/g, while Wt liver/Wt body was approximated to be 20 g/kg in humans [23]. The Cprotein was 1 mg/mL. Substituting these values into the equation above gave the following result:
LC-UV, LC-MS/MS and UHPLC-MS/MS
Licochalcone A metabolites were characterized using high resolution accurate mass measurement LC-MS and LC-MS/MS on a Waters (Milford, MA) hybrid QqTOF Synapt G1 mass spectrometer equipped with a Waters Xterra MS C18 column (2.1 × 100 mm, 3.5 μm). The mobile phase consisted of 0.1 % formic acid in water and acetonitrile with either a 20-min or a 30-min gradient from 15 to 95 % acetonitrile. The flow rate was 0.2 mL/min, the column temperature was 30 °C, and the injection volume was 5 μL. Leucine enkephalin was added post-column as a lock mass for accurate mass measurement. Mass spectra were acquired from m/z 50 – 800 using positive ion electrospray. Product ion tandem mass spectra were obtained using collision-induced dissociation (CID) with argon collision gas at a collision energy of 18 – 22 eV. Data collection and processing were carried out using Waters MassLynx 4.1 software. For HPLC-UV analysis of licochalcone A glucuronides and sulfate isomers, UV spectra from 210 – 400 nm were acquired using a Shimadzu photodiode array detector.
For quantitative analyses, UHPLC-MS/MS with CID and selected reaction monitoring were used on a Shimadzu (Kyoto, Japan) LCMS-8050 or LCMS-8060 triple quadrupole mass spectrometer equipped with a Shimadzu Nexera UHPLC system and Waters Acquity UPLC BEH Shield C18 column (2.1 × 50 mm, 1.7 μm). The UHPLC mobile phase A was water containing 0.1% formic acid, and mobile phase B was acetonitrile containing 0.1% formic acid. The flow rate was 0.6 mL/min, and the gradient was as follows: 0−1 min, hold at 20% B; 1−3.5 min, 20% to 45% B; 3.5–4.5 min, 45% to 95% B; hold at 95% B for 1.5 min, and then re-equilibrate at 20% B for 2 min. The column temperature was 40 °C, and the injection volume was 2 μL. During UHPLC-MS/MS, electrospray was used with polarity switching (5 μsec) and a nebulizing gas flow of 2.5 L/min, heating gas flow of 10 L/min, an interface temperature of 300 °C, desolvation line temperature of 250 °C, heating block temperature of 400 °C, and a drying gas flow rate of 10 L/min.
The selected reaction monitoring transitions (quantifier and qualifier) were m/z 339 to 121 and m/z 339 to 297 for licochalcone A, and m/z 273 to 153 and m/z 273 to 147 for the internal standard naringenin. Based on data-dependent UHPLC-MS/MS analyses in scan mode (data not shown), the positive ion electrospray SRM transitions for each metabolite were established and included m/z 515 to 339 for licochalcone A monoglucuronides, m/z 646 to 339 for the glutathione conjugate of licochalcone A, m/z 419 to 339 for licochalcone A sulfate, m/z 531 to 355 for monooxygenated licochalcone A glucuronides, and m/z 545 to 369 for catechol-O-methylated licochalcone A glucuronides. The SRM dwell time was 15 msec per transition.
Results
Phase I metabolism of licochalcone A
After incubation of licochalcone A with human liver microsomes and NADPH, three major (M1, M2 and M3) and two minor (M4 and M5) phase I metabolites were detected using high resolution LC-MS (Figure 1). When microsomes or NADPH were omitted from the incubation, no metabolites were detected (data not shown). Eluting at 10.6, 11.2 and 14.5 min, respectively, M1, M2 and M3 were determined to be mono-oxygenated metabolites of licochalcone A, based on accurate mass measurement of their protonated molecules of m/z 355.1558 (M1), m/z 355.1562 (M2) and m/z 355.1555 (M3) which corresponded to an elemental composition of C21H22O5 (ΔM 3.66 ppm, M1; ΔM 4.79 ppm, M2; and ΔM 2.82 ppm, M3).
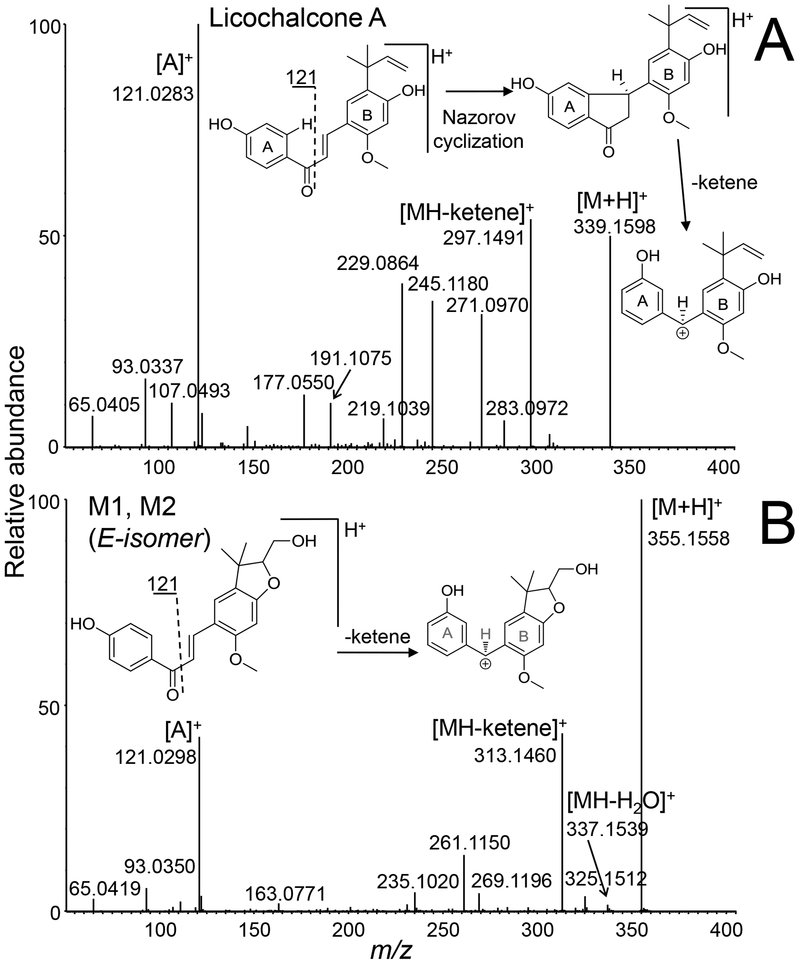
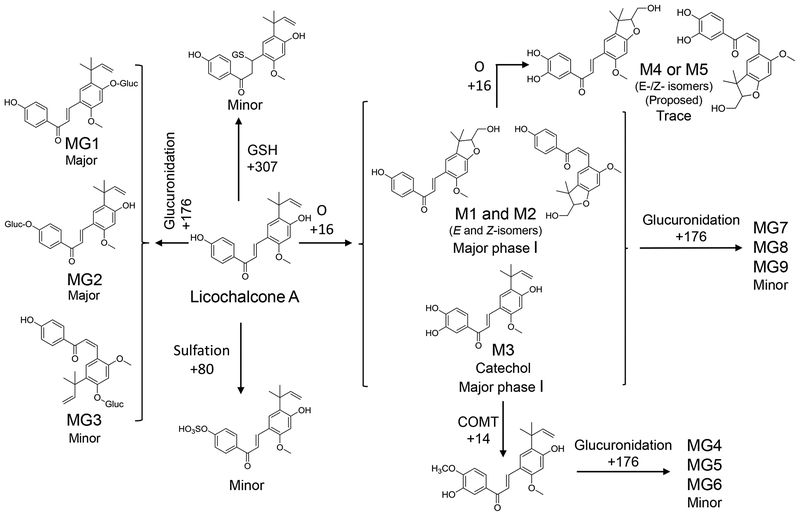
The high resolution tandem mass spectra of protonated M1 and M2 were identical (Figure 2), and like licochalcone A, showed an abundant fragment ion of m/z 121 corresponding to p-hydroxybenzoyl ion originating from an unchanged A-ring. During product ion MS/MS with CID, chalcones like licochalcone A have been reported [24] to undergo Nazarov cyclization with loss of a ketene (C2H2O, 42 units) (Figure 2). The requirements for Nazarov cyclization and ketene loss include an ortho substituent on the B-ring, an α,β-unsaturated ketone and a free hydrogen at the ortho position (no substituent) of the A-ring. In the tandem mass spectra of M1 and M2, the unchanged A-ring acylium ion at m/z 121 and the loss of ketene fragment observed at m/z 313 (Figure 2) localize the addition of oxygen to or near the B-ring. Based on this information and co-elution with standards during UHPLC-MS/MS (Figure S2), identical elemental compositions and identical product ion tandem mass spectra, M1 and M2 were identified as E- and Z-isomers of 3-(2-(hydroxymethyl)-6-methoxy-3,3-dimethyl-2,3-dihydrobenzofuran-5-yl)-1-(4-hydroxyphenyl)prop-2-en-1-one (Figure 3). These licochalcone A hydroxy-benzofuran derivatives were recently identified as secondary metabolites of G. inflata [25] (Figure S2). Phase I metabolites M1 and M2 were formed through epoxidation of the prenyl group followed by intramolecular attack by the neighboring hydroxyl group to form a five-member ring as has been reported for the hop prenylated phenols 8-prenylnaringenin [26], xanthohumol and isoxanthohumol [27].
Figure 2.
Positive ion electrospray product tandem mass spectra of A) licochalcone A; and B) mono-oxygenated licochalcone phase I metabolites M1 and M2 formed using human liver microsomes. Note that M1 and M2 produced identical tandem mass spectra.
Figure 3.
Phase I and phase II metabolism of licochalcone A.
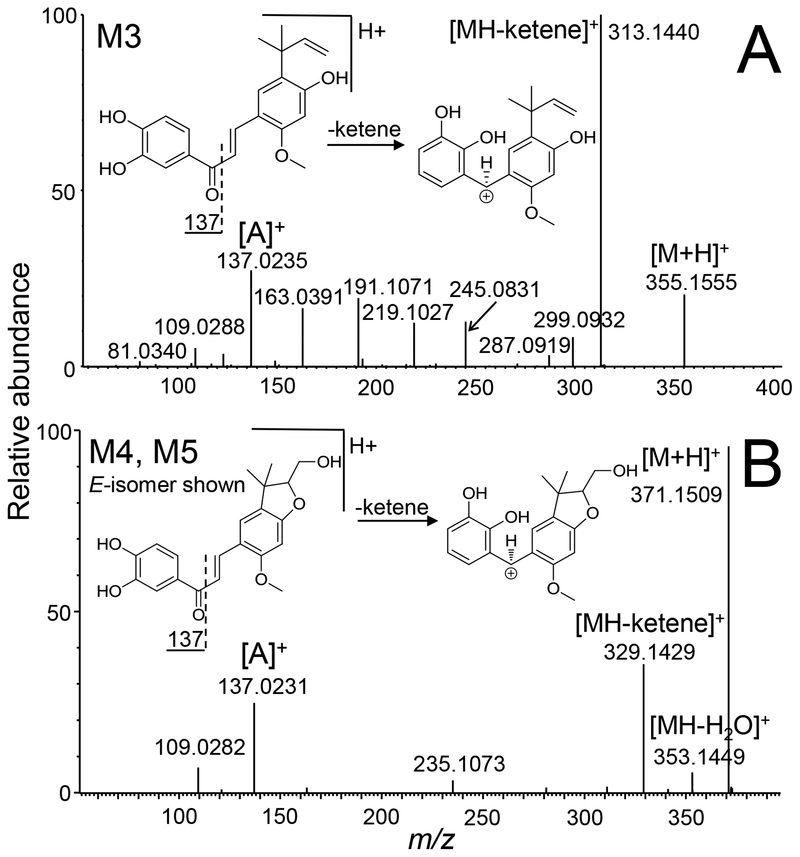
The high-resolution product ion tandem mass spectrum of protonated M3 (Figure 4) showed an abundant fragment ion of m/z 137.0235 corresponding to an elemental composition of C7H5O3 (ΔM −2.19 ppm) and indicating hydroxylation on the ortho or meta position of the A-ring. Because the base peak of m/z 313.1440 (C19H21O4, ΔM < 0.001 ppm) corresponded to loss of a ketene via the Nazarov cyclization, there could be no substituent at the meta position of the A-ring [24]. Therefore, phase I metabolite M3 was formed by hydroxylation of licochalcone A at the ortho position (relative to the original hydroxyl group of the A-ring) to form a catechol (Figure 3).
Figure 4.
Positive ion electrospray product tandem mass spectrum of mono-oxygenated licochalcone A phase I metabolites, A) M3; and B) M4 and M5. Note that M4 and M5 produced identical tandem mass spectra.
Minor metabolites M4 and M5 (retention times 8.7 and 9.3 min, respectively, Figure 1) were determined to be di-oxygenated licochalcone metabolites with an elemental composition of C21H22O6 (measured M4 m/z 371.1474, ΔM −5.39 ppm; and M5 m/z 371.1509, ΔM 4.04 ppm). M4 and M5 produced identical product ion tandem mass spectra (Figure 4) showing loss of a ketene (m/z 329, plus 2 oxygen atoms) and an A-ring ion of m/z 137 (plus 1 oxygen atom). Because these product ions indicated mono-hydroxylation at the ortho position of the A-ring plus mono-hydroxylation on the B-ring, M4 and M5 were probably formed through additional oxygenation of M1, M2, and/or M3 (Figure 3).
To identify the human cytochrome P450 enzymes involved in the metabolism of licochalcone A, incubations were carried out using cDNA-expressed recombinant enzymes. Metabolite formation was determined using UHPLC-MS/MS and then multiplied by the mean specific content of the corresponding P450 enzymes in human liver microsomes to normalize the contribution (Figure S3) [28]. After normalization, CYP1A2, CYP2C8, CYP2C9, and CYP3A4 showed the most actively (>50% contribution) for the formation M1 and M2. The aromatic hydroxylated metabolite, M3, was formed primarily by CYP1A2 and CYP3A4, followed by CYP2E1 and the 2C family of enzymes (Figure S3). Instead of specific cytochrome P450 enzymes, all the enzymes tested contributed slightly to the formation of M4 and M5 (data not shown).
Phase II metabolism of licochalcone A
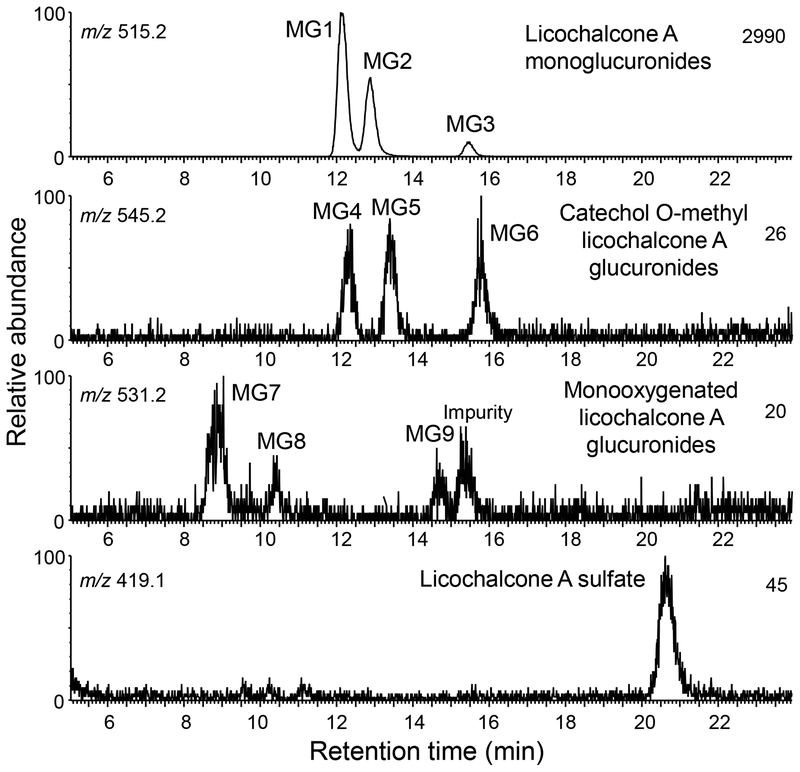
HPLC-MS accurate mass measurement analysis of the human hepatocyte metabolites of licochalcone A indicated 3 abundant glucuronides, MG1, MG2, and MG3 (retention times 12.3, 12.9 and 15.4 min, respectively) and 6 minor monoxygenated licochalcone A glucuronides (MG4-MG9) (Figure 5). In addition, one monosulfate metabolite of licochalcone A was detected at a retention time of 20.7 min. None of these metabolites were detected in control incubations using heat-inactivated hepatocytes. After treatment with β-glucuronidase and sulfatase, all the conjugates disappeared confirming that they were glucuronides and sulfates, respectively (data not shown).
Figure 5.
Positive ion electrospray LC-MS high resolution mass chromatograms of human hepatocyte metabolites of licochalcone A. Phase II conjugates of licochalcone A and its major phase I metabolites were detected.
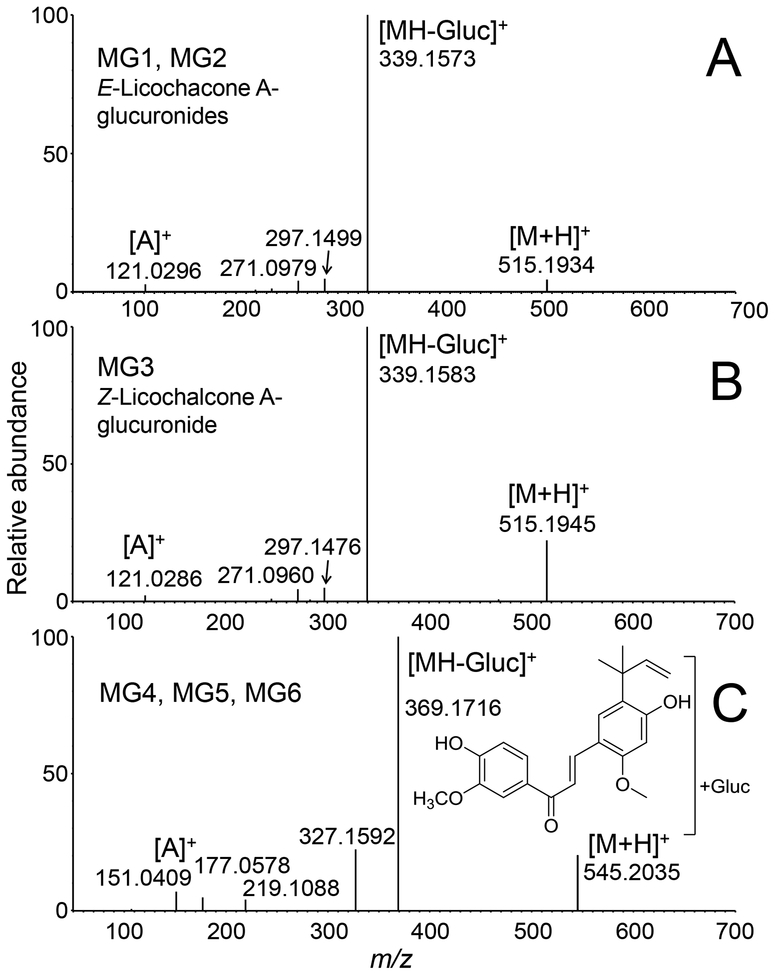
Accurate mass measurements of protonated MG1, MG2 and MG3 (m/z of 515.1934 MG1, m/z 515.1915 MG2 and m/z 515.1945 MG3) were within 6.2 ppm of the formula of C27H30O10 corresponding to licochalcone A monoglucuronides. The product ion tandem mass spectra of MG1 and MG2 were identical, and although the tandem mass spectrum of the less abundant MG3 was slightly different, all showed loss of dehydrated glucuronic acid at m/z 339 from the protonated molecules, further confirming that these metabolites were glucuronides (Figure 6). Characteristic licochalcone A fragment ions were also observed for MG1, MG2 and MG3 including the A-ring fragment ion of m/z 121 and loss of ketene at m/z 297 (Figure 6).
Figure 6.
Positive ion electrospray product ion tandem mass spectra of licochalcone A glucuronides MG1-MG6 formed during incubation with human hepatocytes. A) MG1 and MG2; B) MG3; and C) MG4, MG5 and MG6. Note that the product ion tandem mass spectra of MG1 and MG2 were identical as were those of MG4, MG5 and MG6.
Glucuronidation at either one of the phenolic oxygens of licochalcone A should have formed only two monoglucuronides (MG1 and MG2). Therefore, the third less abundant glucuronide M3 probably corresponded to the Z-isomer of licochalcone A, which might have formed from the E-isomer by photoisomerization in solution [29]. NMR analysis of the licochalcone A used in the incubation indicated that it was 97% (E)-licochalcone A (w/w) and 3% (Z)-licochalcone A (w/w) (Figure S1).
UV spectroscopy has been used to determine sites of substitution on flavonoids and chalcones [30–32]. In particular, the UV spectra of chalcones exhibit two major absorption peaks in the region from 200 nm to 400 nm. Band I (Ia, 340–380 nm; Ib, 300–330 nm) is associated with the B-ring, and Band II (240–280 nm) corresponds to the A-ring [33]. The conjugated system of the B-ring is stabilized by delocalization of unpaired electrons from the 4-OH oxygen into the aromatic ring. Glucuronidation at the 4-OH position would interrupt this stability, resulting in a hypsochromic shift of Band I and reduced intensity compared with unconjugated licochalcone A. In contrast, glucuronidation at the 4’-OH position of the A-ring would have little effect on UV absorption wavelength or intensity.
The UV spectrum of licochalcone A (Figure S4A) showed an intense Band Ia (374 nm), a less intense Band Ib (312 nm) and a Band II (260 nm). In the UV spectrum of MG1 (Figure S4B), Band Ia (358 nm) was less intense and showed a large hypsochromic shift (16 nm) compared with that of licochalcone A, which is consistent with glucuronidation at the 4-OH position. In contrast, the UV spectrum of MG2 (Figure S4C) was almost identical to that of licochalcone A, which indicated conjugation at the 4’-OH position. The less abundant glucuronide, MG3, which probably corresponds to the Z-isomer, showed a shift of Band Ia (362 nm) with lower intensity, which is consistent with glucuronidation on the 4-OH position of the B-ring (Figure S4D). Therefore, the three most abundant monoglucuronides were identified as (E)-licochalcone A-4-glucuronide (MG1), (E)-licochalcone A-4’-glucuronide (MG2), and (Z)-licochalcone A-4-glucuronide (MG3). These structures have been reported previously by Nadelmann, et al. [34], who identified monoglucuronides of E and Z-licochalcone A formed by rabbit and pig liver microsomes.
Based on accurate mass measurements, tandem mass spectrometry and deconjugation by β-glucuronidase, minor metabolites MG4, MG5 and MG6 (retention times 12.3, 13.5 and 15.9 min, respectively; Figure 5) were determined to be glucuronides of the catechol-O-methyl metabolite of licochalcone A (Figure 3). Accurate mass measurements of MG4 (m/z 545.2027), MG5 (m/z 545.2037) and MG6 (m/z 545.2035), were within 2.6 ppm of the elemental composition C28H32O11 (licochalcone A catechol+CH2+glucuronic acid). After treatment with β-glucuronidase, the LC-MS/MS peaks corresponding to MG4, MG5 and MG6 were eliminated. Product ion tandem mass spectra of all three metabolites were similar (Figure 6C) and showed a base peak of m/z 369, corresponding the loss of glucuronic acid, [MH-176]+, and fragment ions of m/z 327 (loss of ketene) and m/z 151 (A-ring plus OCH2), indicating an O-methyl catechol metabolite of licochalcone A.
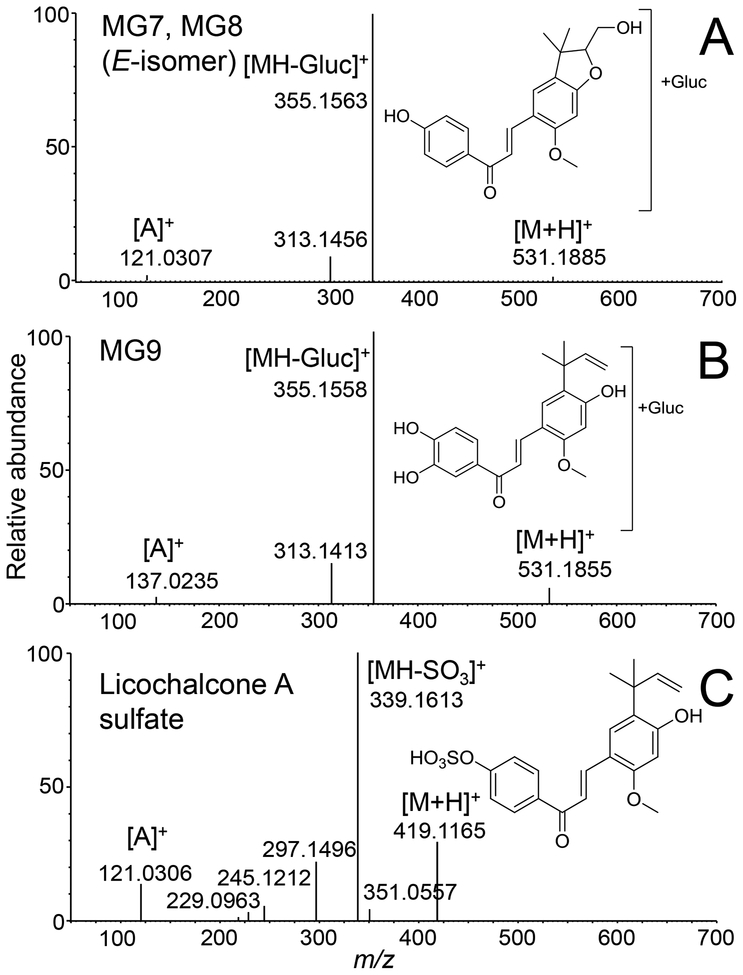
MG7, MG8, and MG9 (retention times 8.9, 10.4, and 14.7 min, respectively; Figure 5) were determined to be glucuronides of the monooxygenated licochalcone A metabolites, based on their accurate mass measurements, susceptibility to hydrolysis by β-glucuronidase and tandem mass spectra. Accurate mass measurements of all three metabolites were within 3.58 ppm of the elemental composition C27H30O11 (m/z 531.1885, m/z 531.1878 and m/z 531.1855 for MG7, MG8 and MG9, respectively). Furthermore, all three compounds could be hydrolyzed by β-glucuronidase, which confirmed that they were β-D-glucuronides. The product ion tandem mass spectra of MG7 and MG8 were identical (Figure 7A) and consisted of a base peak of m/z 355 (corresponding to the loss of a glucuronic acid moiety, [MH-176]+, from mono-oxygenated licochalcone A), and ions of m/z 313 (formed by loss of ketene after loss of glucuronic acid) and m/z 121 (corresponding to an unchanged A-ring of licochalcone A). The ion of m/z 121 indicated that MG7 and MG8 were probably formed by glucuronidation of M1 and M2, which had been oxygenated on the B-ring of licochalcone A. The tandem spectrum of MG 9 (Figure 7B) is consistent with glucuronidation of the licochalcone A chalcone based on the ion of m/z 355 (formed by loss of dehydroglucuronic acid from the protonated molecule) followed by subsequent loss of ketene (m/z 313), and the fragment ion of m/z 137 (corresponding to the mono-oxygenated A-ring of M3). Note that the peak eluting at 15.4 min in Figure 5 was an impurity from the cell culture medium that appeared also in the negative control and had an exact mass inconsistent with C27H30O11 (data not shown).
Figure 7.
Positive ion electrospray product tandem mass spectra of protonated licochalcone A phase II metabolites (A) MG7 and MG8; (B) MG9; and (C) licochalcone A-sulfate. Note that MG7 and MG8 produced identical tandem mass spectra.
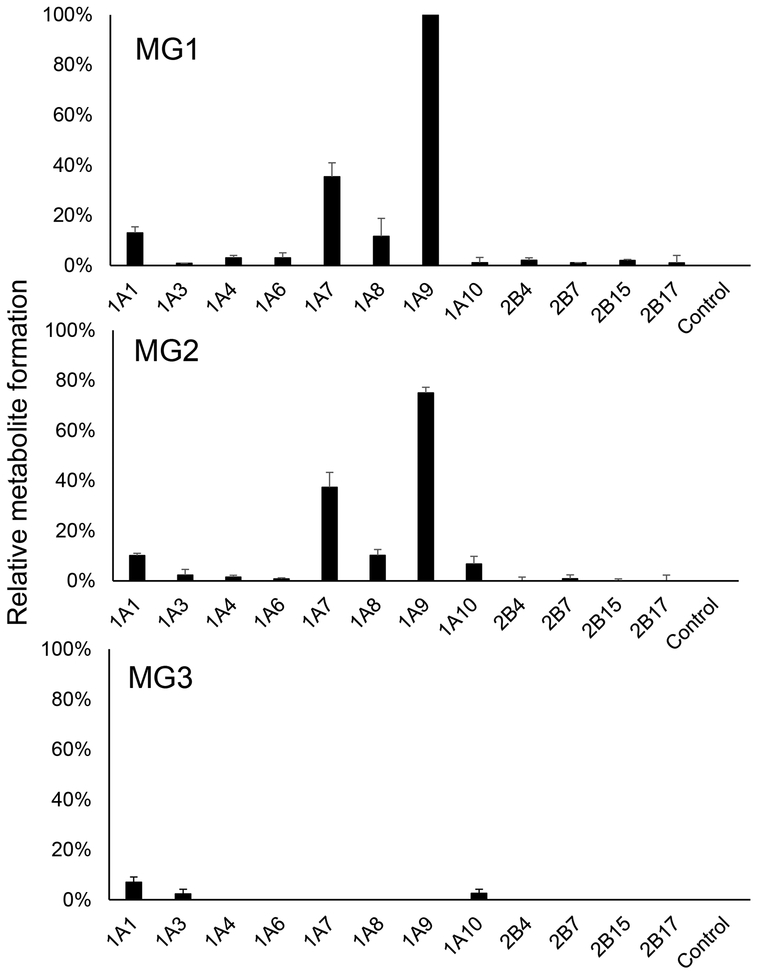
To identify the UGT enzymes responsible for the formation of the three abundant monoglucuronides of licochalcone A (MG1, MG2, and MG3), licochalcone A was incubated with the cofactor UDPGA and recombinant human UGT enzymes representing the most abundant hepatic isoforms [35]. UGT1A9 showed the greatest catalytic activity in the formation of MG1 ((E)-licochalcone A-4-glucuronide)), followed by UGT1A7, UGT1A1 and UGT1A8 (Figure 8). In the formation of MG2 ((E)-licochalcone A-4’-glucuronide), UGT1A9 was again the most active enzyme followed by UGT1A7, UGT1A1 and UGT1A8. UGT1A1, UGT1A3, and UGT1A10 were the most important enzymes for the formation of the minor metabolite MG3 ((Z)-licochalcone A-4-glucuronide). Note that the relative amount of MG3 was only ~7% that of MG1 and ~9.3% that of MG2.
Figure 8.
Relative formation of licochalcone A glucuronides by recombinant UGT enzymes (0.5 mg of protein/mL). Each recombinant UGT was incubated with licochalcone A and UDPGA, and formation of licochalcone A metabolites MG1, MG2 and MG3 were compared using UHPLC-MS/MS. The control incubations contained no enzyme. Data were normalized to the yield of MG1 (100%) catalyzed by UGT1A9. (mean±S.E.; n=3).
One licochalcone A sulfate conjugate was observed at a retention time of 20.8 min during the analysis of the human hepatocyte metabolites (Figure 5). Accurate mass measurement of the protonated molecule of m/z 419.1165 indicated a formula of C21H22O7S (ΔM 0.24 ppm). The base peak of the product ion tandem mass spectrum (Figure 7C) was observed at m/z 339 and corresponded to loss of SO3, [MH-80]+, from the protonated molecule. Treatment with sulfatase resulted in the hydrolysis of this metabolite and the formation of licochalcone A, which confirmed its identification as a sulfate conjugate. To determine the site of attachment of sulfate, both licochalcone A monosulfate isomers were synthesized and analyzed using LC-UV/MS (Figure S5). Analogous to the analysis of licochalcone A glucuronides using UV, the earlier eluting licochalcone A sulfate (retention time 15.4 min) corresponded to sulfation at the 4-OH position based on a UV Band Ia shift at 361 nm with lower intensity. The later eluting peak (retention time 19.6 min) corresponded to licochalcone A-4’-O-sulfate, since its UV spectrum was almost identical to that of licochalcone A (Figure S5 and Figure S4). Finally, the sulfate conjugate of licochalcone A formed by human hepatocytes was identified as licochalcone A-4’-O-sulfate based on co-elution with the synthetic standard during LC-MS/MS (data not shown).
A glutathione conjugate of licochalcone A ([M+H]+, m/z 646) was observed eluting at 8.9 min during the UHPLC-MS/MS analysis of the hepatocyte incubation with licochalcone A (Figure S6). The formation of this licochalcone A glutathione conjugate was confirmed by comparing its retention time and product ion tandem mass spectrum with those of the product resulting from incubation of licochalcone A with glutathione. All phase I and II metabolites of licochalcone A formed by human liver microsomes and hepatocytes are summarized in Figure 3 and Table 1.
Table 1.
Licochalcone A metabolites observed following incubations with human liver microsomes and human hepatocytes.
| M1, M2 | M3 | M4, M5 | MG1 | MG2 | MG3 | MG4 | MG5 | MG6 | MG7 | MG8 | MG9 | Sulfate | GSH | |
|---|---|---|---|---|---|---|---|---|---|---|---|---|---|---|
| Human metabolism model | LicA + O | LicA + O | LicA + 2O | Licochalcone A + gluc acid | Licochalcone A + OCH2 + gluc acid | Licochalcone A + O + gluc acid | LicA +SO3 | LicA + GSH | ||||||
| Human liver microsomes + NADPH | √√ | √√ | √ | ND | ND | ND | ND | ND | ND | ND | ND | ND | ND | ND |
| Human liver microsomes + UDPGA | ND | ND | ND | √√ | √√ | √ | ND | ND | ND | ND | ND | ND | ND | ND |
| Human hepatocytes | ND | ND | ND | √√ | √√ | √ | √√ | √√ | √√ | √ | √ | √ | √√ | √ |
√√ = major metabolites; √ = minor metabolites; N.D. = not detected
The metabolic stability of licochalcone A toward phase I metabolism was evaluated by incubating licochalcone A with human liver microsomes and the cofactor NADPH. The phase II metabolic stability of licochalcone A was estimated by incubating it with human liver microsomes and UDPGA. Licochalcone A was slowly metabolized by phase I enzymes, decreasing only 15.8% in 60 min but was metabolized much more rapidly by phase II glucuronidation, decreasing 76.1% in 60 min (Figure S7). For phase I metabolism of licochalcone A, the elimination rate constant (k) was 0.0028, the half-life (t1/2) was 247 min, and the intrinsic clearance CLint was 2.52 mL/min/kg. In contrast, phase II glucuronidation of licochalcone A by human liver microsomes was much faster with a rate constant (k) of 0.0227, a half-life (t1/2) of 30.5 min, and an intrinsic clearance CLint of 20.43 mL/min/kg. These data indicate that the contribution of phase I metabolism to the elimination of licochalcone A will be much lower than phase II conjugation.
Discussion
The hepatic metabolism of licochalcone A was investigated using models of phase I or phase II metabolism (liver microsomes) as well as simultaneous phase I and II metabolism (hepatocytes). Incubation of licochalcone A with human liver microsomes was particularly useful in determining the relative contributions of cytochrome P450 enzymes toward phase I metabolism. Among the 5 phase I metabolites observed in vitro, mono-oxygenated M1 and M2 were also identified as plant secondary metabolites of G. inflata. Isomeric M1 and M2 were formed by CYP1A2, CYP2C8, CYP2C9, and CYP3A4 probably through a shared metabolic epoxidation pathway followed by non-enzymatic ring closure. A similar cytochrome P450 catalyzed epoxidation reaction of a prenyl group followed by an intramolecular ring closure has been reported for in vitro metabolism of 8-prenylnaringenin, a potent phytoestrogen from hops [26]. The E/Z isomerization differentiating M1 and M2 probably resulted from photoisomerization in solution either before or after epoxidation.
The most abundant phase I metabolite, M3 was determined to be a catechol based on high resolution tandem mass spectrometry that showed not only oxygenation of the A-ring but also Nazarov cyclization and fragmentation indicating hydroxylation at the meta position of the A-ring. Additional evidence supporting the catechol structure of M3 was methylation by COMT in human hepatocytes and in rats. The enzymes CYP1A2 and CYP3A4 contributed the most to M3 formation. In the literature, CYP1A2 has also been reported to catalyze the formation of the catechol metabolite piceatannol from trans-resveratrol [36]. CYP1A2 and CYP3A4 are also involved in the formation of the estradiol catechol metabolite, 2-hydroxyestradiol [37].
Among the 3 monoglucuronides of licochalcone A (MG1, MG2, and MG3), only MG3 was in the Z-configuration. Given that chalcones like licochalcone A can undergo E to Z transformation in solution when exposed to light [29], it is understandable that the E/Z isomer pair MG1 and MG3 was observed. However, it is less clear why only the E isomer MG2 was observed without its corresponding Z-isomer. It has been reported that the absence of a free hydroxyl group at the 4-position of chalcones inhibits photoisomerization between the E and Z-isomers [38]. Therefore, (E)-licochalcone A and (E)-licochalcone A-4’-glucuronide (MG2) can undergo photoisomerization to their Z-isomers and back again to the E-isomers. However, once (Z)-licochalcone A becomes conjugated to form (Z)-licochalcone A-4-glucuronide, it cannot readily convert back to the more stable E-isomer. Hence, (Z)-licochalcone A-4-glucuronide (MG3) could accumulate as (Z)-licochalcone A became conjugated and was the only (Z)-licochalcone A-glucuronide detected. Another possibility might be that the E/Z-isomerization was catalyzed by cytochromes P450, which has been reported to occur during the biotransformation of tamoxifen [39,40]. This enzymatic isomerization might explain the formation of not only MG3 but also the E/Z-isomerization of phase I metabolites M1 and M2.
The experiments with cDNA-expressed UGTs showed that the mono-glucuronidation of licochalcone A was catalyzed primarily by UGT1A1, UGT1A7, UGT1A8, UGT1A9, and UGT1A10. Most UGTs are expressed primarily in the liver, but some isoforms, such as UGT1A7, UGT1A8, and UGT1A10, are expressed predominantly in the gastrointestinal tract [41]. For the formation of licochalcone A glucuronides MG1 and MG2, UGT1A9 showed the highest activity, which is highly expressed not only in the liver but also in the colon and kidney [42]. Considering the extrahepatic expression of UGT1A9, UGT1A7, UGT1A8, and UGT1A10, these enzymes should contribute significantly to the extrahepatic clearance of licochalcone A. Based on estimated in vitro hepatic clearance alone, phase II glucuronidation was almost 10-fold faster than phase I clearance. Combining hepatic and extrahepatic metabolism, glucuronidation is expected to be the most important metabolic clearance pathway for licochalcone A.
One GSH conjugate of licochalcone A (Figure 3) was observed in vitro and in vivo, which was formed enzymatically and/or non-enzymatically via a Michael addition reaction. Besides showing identical retention times and tandem mass spectra with a synthetic licochalcone A glutathione conjugate, its identity as a GSH conjugate was confirmed using a UHPLC-MS/MS GSH adduct screening method [21]. In addition, one sulfate conjugate (Fig. 3) was observed. Based on the relative abundances of the sulfate and GSH conjugates, their contributions to licochalcone A metabolism were minor compared with glucuronidation (Table 1). In conclusion, the hepatic metabolism of licochalcone A involves both phase I oxygenation and phase II conjugation; however, phase II glucuronidation is expected to predominate in humans as predicted by these preclinical models.
Supplementary Material
Acknowledgements
The authors thank Dr. Charlotte Simmler, Dr. David C. Lankin and Dr. Guido F. Pauli for NMR structure elucidation and Shimadzu Scientific Instruments for providing the mass spectrometers used in this investigation. This work was supported by NIH grants P50 AT000155 and R01 AT007659 from the Office of Dietary Supplements and the National Center for Complementary and Integrative Health of the United States National Institutes of Health.
Footnotes
Compliance with Ethical Standards
The authors declare no conflicts of interest.
References
- [1].Smith T, Lynch ME, Johnson J, Kawa K, Bauman H, Blumenthal M. Herbal dietary supplement sales in US rise 6.8% in 2014. Herbal Gram. 2015;107:52–9. [Google Scholar]
- [2].van Breemen RB. Development of safe and effective botanical dietary supplements. J Med Chem. 2015;58:8360–8372. [DOI] [PMC free article] [PubMed] [Google Scholar]
- [3].Caldwell J, Gardner I, Swales N. An introduction to drug disposition: the basic principles of absorption, distribution, metabolism, and excretion. Toxicol Pathol. 1995;23:102–14. [DOI] [PubMed] [Google Scholar]
- [4].Fried MW, Navarro VJ, Afdhal N, Belle SH, Wahed AS, Hawke RL, Doo E, Meyers CM, Reddy KR, Silymarin in NASH and C Hepatitis (SyNCH) Study Group. Effect of silymarin (milk thistle) on liver disease in patients with chronic hepatitis C unsuccessfully treated with interferon therapy: a randomized controlled trial. JAMA. 2012;308:274–82. [DOI] [PMC free article] [PubMed] [Google Scholar]
- [5].Fiore C, Eisenhut M, Ragazzi E, Zanchin G, Armanini DA. History of the therapeutic use of liquorice in Europe. J Ethnopharmacol. 2005;99:317–24. [DOI] [PMC free article] [PubMed] [Google Scholar]
- [6].The Society of Japanese Pharmacopeia. Japanese Pharmacopeia, JP VIII, 13th edition, Japan: 1996. [Google Scholar]
- [7].British Pharmacopeia Commission. The British Pharmacopeia, London: 1998. [Google Scholar]
- [8].Zhang Q, Ye M. Chemical analysis of the Chinese herbal medicine Gan-Cao (licorice). J Chromatogr A. 2009;1216:1954–69. [DOI] [PubMed] [Google Scholar]
- [9].Chinese Pharmacopeia Commission. Pharmacopeia of People’s Republic of China, vol. 1, Chemical Industry Press, Beijing: 2005. [Google Scholar]
- [10].Kondo K, Shiba M, Nakamura R, Morota T, Shoyama Y. Constituent properties of licorices derived from Glycyrrhiza uralensis, G. glabra, or G. inflata identified by genetic information. Biol Pharm Bull. 2007;30:1271–7. [DOI] [PubMed] [Google Scholar]
- [11].Li G, Nikolic D, van Breemen RB. Identification and chemical standardization of licorice raw materials and dietary supplements using UHPLC-MS/MS. J Agric Food Chem. 2016;64:8062–70. [DOI] [PMC free article] [PubMed] [Google Scholar]
- [12].Dunlap TL, Wang S, Simmler C, Chen SN, Pauli GF, Dietz BM, Bolton JL. Differential effects of Glycyrrhiza species on genotoxic estrogen metabolism: licochalcone A downregulates P450 1B1 whereas isoliquiritigenin stimulates. Chem Res Toxicol. 2015;28:1584–94. [DOI] [PMC free article] [PubMed] [Google Scholar]
- [13].Hajirahimkhan A, Simmler C, Dong H, Lantvit DD, Li G, Chen SN, Nikolic D, Pauli GF, van Breemen RB, Dietz BM, Bolton JL. Induction of NAD(P)H:quinone oxidoreductase 1 (NQO1) by Glycyrrhiza species used for women’s health: differential effects of the Michael acceptors isoliquiritigenin and licochalcone A. Chem Res Toxicol. 2015;28:2130–41. [DOI] [PMC free article] [PubMed] [Google Scholar]
- [14].Chen M, Theander TG, Christensen SB, Hviid L, Zhai L, Kharazmi A. Licochalcone A, a new antimalarial agent, inhibits in vitro growth of the human malaria parasite Plasmodium falciparum and protects mice from P. yoelii infection. Antimicrobial Agents Chemother. 1994;38:1470–75. [DOI] [PMC free article] [PubMed] [Google Scholar]
- [15].Nabekura T, Hiroi T, Kawasaki T, Uwai Y. Effects of natural nuclear factor-kappa B inhibitors on anticancer drug efflux transporter human P-glycoprotein. Biomed Pharmacother. 2015;70:140–5. [DOI] [PubMed] [Google Scholar]
- [16].Friis-Møller A, Chen M, Fuursted K, Christensen SRBG, Kharazmi A. In vitro antimycobacterial and antilegionella activity of licochalcone A from Chinese licorice roots. Planta Medica. 2002;68:416–9. [DOI] [PubMed] [Google Scholar]
- [17].Dao TT, Nguyen PH, Lee HS, Kim E, Park J, Lim SI, Oh WK. Chalcones as novel influenza A (H1N1) neuraminidase inhibitors from Glycyrrhiza inflata. Bioorg Med Chem Lett. 2001;21:294–8. [DOI] [PubMed] [Google Scholar]
- [18].Zhang D, Zhu M, Humphreys WG. Drug Metabolism in Drug Design and Development, Part I. John Wiley & Sons; New York, 2008. [Google Scholar]
- [19].Kawai N, Fujibayashi Y, Kuwabara S, Takao K-I, Ijuin Y, Kobayashi S. Synthesis of a potential key intermediate of akaterpin, specific inhibitor of PI-PLC. Tetrahedron. 2000;56:6467–78. [Google Scholar]
- [20].Yu C, Shin YG, Chow A, Li Y, Kosmeder JW, Lee YS, Hirschelman WH, Pezzuto JM, Mehta RG, van Breemen RB. Human, rat, and mouse metabolism of resveratrol. Pharm Res. 2002;19:1907–14. [DOI] [PubMed] [Google Scholar]
- [21].Huang K, Huang L, van Breemen RB. Detection of reactive metabolites using isotope-labeled glutathione trapping and simultaneous neutral loss and precursor ion scanning with ultra-high-pressure liquid chromatography triple quadruple mass spectrometry. Anal Chem. 2015;87:3646–54 [DOI] [PMC free article] [PubMed] [Google Scholar]
- [22].Miners JO, Mackenzie PI. Drug glucuronidation in humans. Pharmacol Ther. 1991;51:347–69. [DOI] [PubMed] [Google Scholar]
- [23].Soars MG, Burchell B, Riley RJ. In vitro analysis of human drug glucuronidation and prediction of in vivo metabolic clearance. J Pharmacol Exp Ther. 2002;301:382–90. [DOI] [PubMed] [Google Scholar]
- [24].George M, Sebastian VS, Reddy PN, Srinivas R, Giblin D, Gross ML. Gas-phase Nazarov cyclization of protonated 2-methoxy and 2-hydroxychalcone: an example of intramolecular proton-transport catalysis. J Am Soc Mass Spectrom. 2009;20:805–18. [DOI] [PMC free article] [PubMed] [Google Scholar]
- [25].Simmler C, Lankin DC, Nikolić D, van Breemen RB, Pauli GF. Isolation and structural characterization of dihydrobenzofuran congeners of licochalcone A. Fitoterapia. 2017;121:6–15. [DOI] [PMC free article] [PubMed] [Google Scholar]
- [26].Nikolic D, Li Y, Chadwick LR, Grubjesic S, Schwab P, Metz P, van Breemen RB. Metabolism of 8-prenylnaringenin, a potent phytoestrogen from hops (Humulus lupulus), by human liver microsomes. Drug Metab Dispos. 2004;32:272–9. [DOI] [PubMed] [Google Scholar]
- [27].Nikolic D, Li Y, Chadwick LR, Pauli GF, van Breemen RB. Metabolism of xanthohumol and isoxanthohumol, prenylated flavonoids from hops (Humulus lupulus L.), by human liver microsomes. J. Mass Spectrom. 2005;40:289–99. [DOI] [PubMed] [Google Scholar]
- [28].Rodrigues AD. Integrated cytochrome P450 reaction phenotyping: attempting to bridge the gap between cDNA-expressed cytochromes P450 and native human liver microsomes. Biochem Pharmacol. 1999;57:465–80. [DOI] [PubMed] [Google Scholar]
- [29].Jurd L. Anthocyanidins and related compounds. XV. The effects of sunlight on flavylium salt-chalcone equilibrium in acid solutions. Tetrahedron. 1969;25:2367–80. [DOI] [PubMed] [Google Scholar]
- [30].Otake Y, Hsieh F, Walle T. Glucuronidation versus oxidation of the flavonoid galangin by human liver microsomes and hepatocytes. Drug Metab Dispos. 2002;30:576–81. [DOI] [PubMed] [Google Scholar]
- [31].Alonso-Salces RM, Ndjoko K, Queiroz EF, Ioset JR, Hostettmann K, Berrueta LA, Gallo B, Vicente F. On-line characterisation of apple polyphenols by liquid chromatography coupled with mass spectrometry and ultraviolet absorbance detection. J Chromatogr A. 2004;1046:89–100. [PubMed] [Google Scholar]
- [32].Guo J, Liu A, Cao H, Luo Y, Pezzuto JM, van Breemen RB. Biotransformation of the chemopreventive agent 2’,4’,4-trihydroxychalcone (isoliquiritigenin) by UDP glucuronosyl transferases. Drug Metab Dispos. 2008;36:2104–16. [DOI] [PMC free article] [PubMed] [Google Scholar]
- [33].Markham KR. Techniques of Flavonoid Identification. Academic Press, New York, 1980. [Google Scholar]
- [34].Nadelmann L, Tjørnelund J, Hansen SH, Cornett C, Sidelmann UG, Braumann U, Christensen E, Christensen SB. Synthesis, isolation and identification of glucuronides and mercapturic acids of a novel antiparasitic agent, licochalcone A. Xenobiotica. 1997;27:667–80. [DOI] [PubMed] [Google Scholar]
- [35].Fisher MB, Paine MF, Strelevitz TJ, Wrighton SA. The role of hepatic and extrahepatic UDP-glucuronosyltransferases in human drug metabolism. Drug Metab Rev. 2001;33:273–97. [DOI] [PubMed] [Google Scholar]
- [36].Piver B, Fer M, Vitrac X, Merillon JM, Dreano Y, Berthou F, Lucas D. Involvement of cytochrome P450 1A2 in the biotransformation of trans-resveratrol in human liver microsomes. Biochem Pharmacol. 2004;68:773–82. [DOI] [PubMed] [Google Scholar]
- [37].Tsuchiya Y, Nakajima M, Yokoi T. Cytochrome P450-mediated metabolism of estrogens and its regulation in human. Cancer Lett. 2004;227:115–24. [DOI] [PubMed] [Google Scholar]
- [38].Shibata S. Anti-tumorigenic chalcones. Stem Cells. 1994;12:44–52. [DOI] [PubMed] [Google Scholar]
- [39].Williams ML, Lennard MS, Martin IJ, Tucker GT. Interindividual variation in the isomerization of 4-hydroxytamoxifen by human liver microsomes: involvement of cytochromes P450. Carcinogenesis. 1994;15:2733–8. [DOI] [PubMed] [Google Scholar]
- [40].Guengerich FP. Common and uncommon cytochrome P450 reactions related to metabolism and chemical toxicity. Chem Res Toxicol. 2001;14:611–50. [DOI] [PubMed] [Google Scholar]
- [41].Gregory PA, Lewinsky RH, Gardner-Stephen DA, Mackenzie PI. Regulation of UDP glucuronosyltransferases in the gastrointestinal tract. Toxicol Appl Pharm. 2004;199:354e363. [DOI] [PubMed] [Google Scholar]
- [42].Tukey RH, Strassburg CP. Genetic multiplicity of the human UDP glucuronosyltransferases and regulation in the gastrointestinal tract. Mol Pharmacol. 2001;59:405–14. [DOI] [PubMed] [Google Scholar]
Associated Data
This section collects any data citations, data availability statements, or supplementary materials included in this article.


