

Abstract
Although targeted therapies often elicit profound initial patient responses, these effects are transient due to residual disease leading to acquired resistance. How tumors transition between drug responsiveness, tolerance and resistance, especially in the absence of pre-existing subclones, remains unclear. In EGFR-mutant lung adenocarcinoma cells, we demonstrate that residual disease and acquired resistance in response to EGFR inhibitors requires AURKA activity. Non-genetic resistance through the activation of AURKA by its co-activator TPX2 emerges in response to chronic EGFR inhibition where it mitigates drug-induced apoptosis. Aurora kinase inhibitors suppress this adaptive survival program, increasing the magnitude and duration of EGFR inhibitor response in pre-clinical models. Treatment induced activation of AURKA was associated with resistance to EGFR inhibitors in-vitro, in-vivo and in individuals with EGFR-mutant lung adenocarcinoma. These findings delineate a path whereby drug resistance emerges from drug-tolerant cells and unveils a synthetic lethal strategy for enhancing responses to EGFR inhibitors by suppressing AURKA driven residual disease and acquired resistance.
MAIN
The approval and use of EGFR inhibitors in EGFR-mutant non-small cell lung cancer (NSCLC) has been a major clinical breakthrough helping to define the paradigm of precision medicine. However, EGFR tyrosine kinase inhibitors (EGFR-TKIs) often produce an incomplete response followed by progression and acquired resistance in 9–12 months, often a lethal event1–3. Disease progression occurs through tumor evolution upon treatment involving distinct genetic and non-genetic changes in cell state and signaling4. Furthermore, patient tumors develop acquired resistance via multiple mechanisms simultaneously5–8 and this polyclonal nature of resistance could limit the efficacy of approaches that target any single genetic driver of resistance. The heterogeneous nature of acquired resistance highlights the need to better understand and target residual disease, defined as the fraction of tumor cells that survive initial treatment and ultimately enable tumor progression in the presence of ongoing treatment9. Acquired resistance occurs through the selection of pre-existing clones as well as evolution of drug-tolerant (i.e. persister) cells without genetic alterations that survive treatment through tumor cell adaptation that may involve the acquisition of genetic mutations later10–12. Both genetic and non-genetic forms of resistance to EGFR-TKIs have been identified including secondary mutations in EGFR, amplification of various receptor tyrosine kinases, transformation to small-cell lung cancer and epithelial-mesenchymal transition (EMT)4,13–16. Third-generation EGFR inhibitors, rociletinib and FDA-approved agent osimertinib, bind and inhibit mutant EGFR with and without the T790M mutation, associated with resistance to previous generation EGFR inhibitors1,2. For these drugs, approximately half of acquired resistance cases have unknown genetic drivers and when genetic drivers exist, multiple drivers often co-occur in the same patient7,8,13. We identified a synthetic lethal interaction between EGFR-TKIs and Aurora kinase inhibitors in acquired resistant cells that has important implications for the development of new treatment strategies that are aimed at preventing rather than intercepting acquired resistance.
We modeled acquired resistance to both osimertinib and rociletinib by deriving polyclonal acquired resistant cell lines based on stepwise dose escalation over a period of 9 days followed by maintenance in 1uM of drug over 6 weeks (osimertinib resistant lines denoted –OR and rociletinib lines –RR, Fig. 1a). We generated 8 acquired resistant models from 4 different EGFR-mutant NSCLC cell lines including PC9, HCC827, HCC4006 and H1975 which expresses a compound EGFR L858R and T790M mutation. There was a >10-fold change in IC50 in each line compared to parental and we observed cross-resistance between drugs indicating a shared mechanism of resistance regardless of which EGFR inhibitor used (Fig. 1b, Supplementary Fig. 1a). In response to TKI, resistant cells suppressed EGFR signaling and we observed no activation of alternate receptor tyrosine kinases previously reported to facilitate bypass of EGFR inhibition (Supplementary Fig. 1b)17. In response to treatment, resistant cells demonstrated heightened ERK and AKT signaling and reduced apoptosis as measured by cleaved PARP compared to parental cells (Fig. 1c). Exome sequencing revealed no recurrent mutations among independently derived acquired resistant lines and no additional mutations in EGFR were detected (data not shown). We next sought to identify if these cells harbored markers of cell states known to be associated with resistance to EGFR-TKI. Compared to parental cells, resistant cells had an increase in Vimentin levels indicative of EMT, increased NF-κB signaling and minor changes in cancer cell stemness, all known to be associated with EGFR-TKI resistance (Supplementary Fig. 1c)4,12,17–20. P53 and NRAS signaling were not strongly associated with resistance (Supplementary Fig. 1d,e)21,22. Heritability analysis using single cell clones indicated that the majority of cells derived from acquired resistant lines were re-sensitized to TKI after a period of drug withdrawal indicating a non-genetic and reversible mechanism of drug resistance (Supplementary Fig. 1f).
Figure 1. EGFR mutant lung adenocarcinoma cells demonstrating acquired resistance to third-generation EGFR tyrosine kinase inhibitors are sensitive to Aurora kinase inhibition.
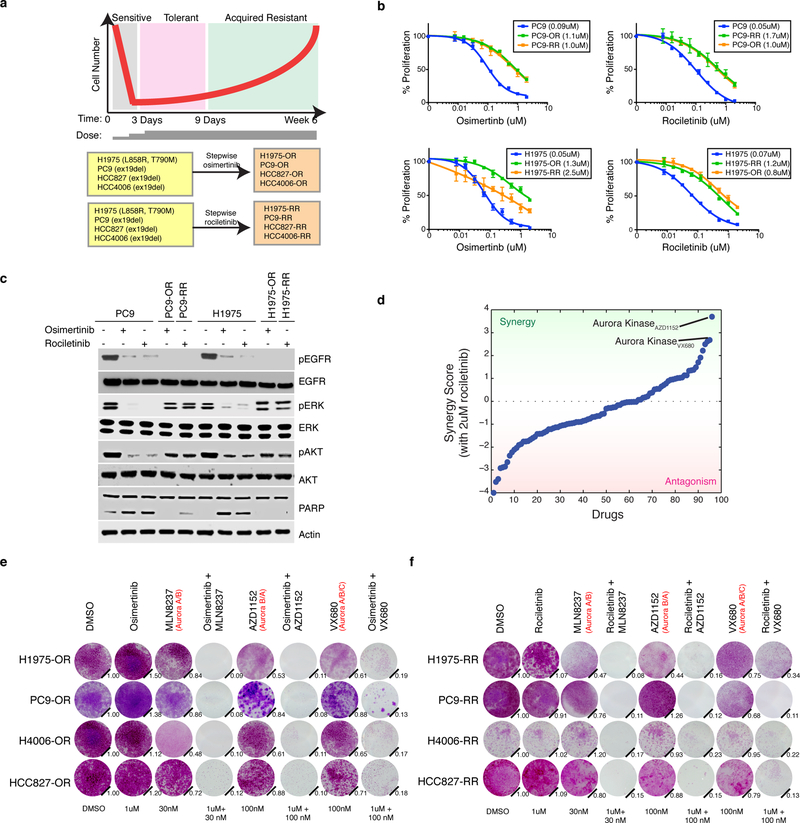
a Schematic of cell number throughout the process to generate acquired resistant EGFR mutant lung adenocarcinoma cell lines through continuous cell culture and stepwise dose escalation of either osimertinib or rociletinib from 10 nM to 1 uM over the course of 9 d. Cell lines and EGFR mutation are listed. b Mean relative proliferation of parental, osimertinib (denoted -OR) and rociletinib (denoted -RR) acquired resistant cell lines treated with the indicated agents and allowed to proliferate for 3 d. IC50 analysis of dose–response curves from n = 4 biologically independent samples. The IC50 for each cell line is indicated in parenthesis. c Immunoblot analysis showing activity of the EGFR, AKT and ERK as well as PARP cleavage in response to 24 h treatment (+) or not (−) with DMSO, osimertinib (1uM) or rociletinib (1uM) in parental or acquired resistant cell lines. Actin is loading control. cl. PARP = cleaved PARP. Experiment was perfomed twice with similar results. d Sorted results from a combinatorial drug screen across 94 drugs combined with 2uM rociletinib in H1975-RR cells. Synergy based on enhancement of growth inhibition compared to either drug along (see Methods). Screen was performed once. e Crystal violet staining of parental and osimertinib acquired resistant cell lines or f rociletinib acquired resistant cell lines 9 d after treatment with DMSO or the indicated drugs. Aurora kinase inhibitors are annotated with their relative targets in order of potency. Quantification (relative number of stained cells) is shown on the bottom right. c,e,f are representative of two independent experiments. Error bars are s.e.m. Full blots are shown in Supplementary Fig. 11.
Based on the absence of any obviously targetable driver of resistance, we sought to identify pathways revealed by drugs that synergistically inhibit growth when combined with EGFR-TKIs. Across a 94-compound cancer-focused library, both Aurora kinase inhibitors in the panel, AZD1152 and VX680, were the top synergistic candidates when combined with 2uM rociletinib in H1975-RR cells (Fig. 1d, Supplementary Table 1). The combination of these two agents as well as MLN8237, the most clinically advanced Aurora kinase inhibitor, with either osimertinib or rociletinib demonstrated synergistic reduction in cell growth in all models (Fig. 1e,f, Supplementary Fig 2a,b). Aurora kinase inhibitors display significant cross-reactivity between AURKA, AURKB and AURKC23. Therefore, these data reveal a primary requirement for Aurora kinase signaling in models of acquired resistance to third generation inhibitors of EGFR.
We sought to determine the relevant target of Aurora kinase inhibitors in driving drug synergy. Compared to parental cells, we found ~2-fold mRNA up-regulation but no increase in total protein levels for all three Aurora kinases in resistant cells (Fig. 2a, Supplementary Fig. 3a,b). In contrast, we found significant activation of AURKA, but not AURKB or AURKC, in resistant models as indicated by increased auto-phosphorylation at T288 (Fig. 2a, Supplementary Fig. 3b). We next asked if activation of AURKA is sufficient to confer resistance to EGFR-TKI. AURKA activity peaks during G2/M phase of the cell cycle where it regulates chromosome alignment, mitotic spindle formation and chromosome segregation24. Parental PC9 cells synchronized using serum starvation or thymidine block into G2/M phase had high levels of phospho-AURKA, and were more viable and had diminished apoptosis in comparison to parental cells that were treated in G1/S or asynchronously (Supplementary Fig. 3c-i). Transient AURKA over-expression, but not AURKB, caused resistance to EGFR-TKIs at levels comparable to KRAS G12V, a known driver of resistance (Fig. 2b, Supplementary Fig. 3j)25.
Figure 2. Activation of Aurora Kinase A is sufficient to cause resistance to EGFR-TKI and drug combinations induce apoptosis through BIM upregulation in vitro and in vivo.
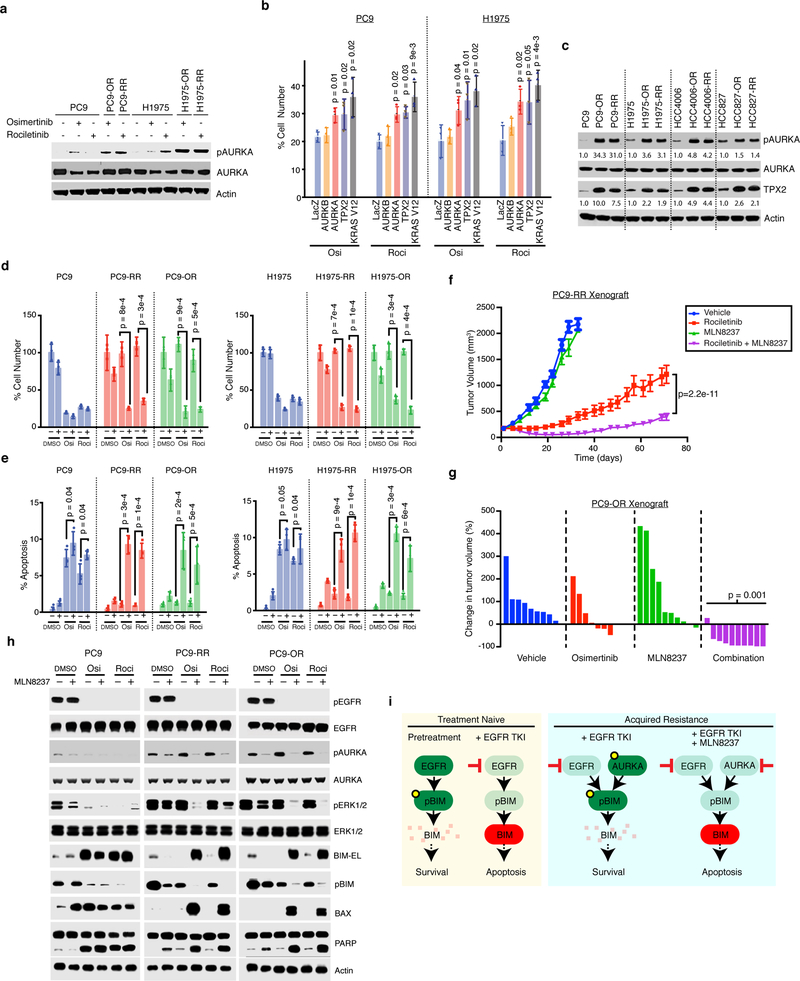
a Immunoblot analysis of total and phosphorylated AURKA in PC9 and H1975 parental and acquired resistant cell lines treated with 1uM of the indicated inhibitors for 24 h. b Mean of cell proliferation of PC9 or H1975 cells transfected with plasmids expressing the indicated genes and treated 1uM EGFR-TKI for 72 h compared to DMSO treated cells performed in n=3 biologically independent samples. Significance based on comparison to LacZ control. c Immunoblot analysis 4 parental and 8 acquired resistant cell lines. Quantified intensities for pAURKA and TPX2 relative to the parental cell line is shown. d Proliferation compared to DMSO of PC9 and H1975 parental or acquired resistant cells treated with 1uM of osimertinib or rociletinib, 30nM of MLN8237 or the combination for 72 h. Mean over n=3 biologically independent samples. e Apoptosis measured by YO-PRO-1 positivity in the same models and drug treatments for 72 h. Shown is mean from n=3 biologically independent samples. f Mean tumor volume (mm3) of PC9-RR xenografts during treatment with rociletinib (100mg/kg), MLN8237 (10mg/kg) or the combination. n=10 tumors in the vehicle and rociletinib arm, and n=7 in the MLN8237 and combination arm. g Percent change in tumor volume compared to baseline for individual PC9-OR cell xenografts teated for 11 days with osimertinib (5mg/kg), MLN8237 (10mg/kg) or the combination. P-value comparing combo to single agent osimertinib treatment. h Immunoblot of lysates from parental PC9, PC9-OR and PC9-RR cells treated with the indicated inhibitors or DMSO for 24 h. i Proposed mechanism for the efficacy of the combination in acquired resistant cells. P-values based two-tailed Student’s t-test. Error bars represent s.e.m. Blots are representative of at least two independent experiments. Full blots shown in Supplementary Fig. 11.
AURKA can be activated by upstream factors which facilitate its auto-phosphorylation including TPX2, NEDD9, AJUBA and PAK126. We investigated each one and observed a consistent increase in TPX2 protein, and to a lesser extent transcription, and an increase in phospho-AURKA in all resistant models (Fig. 2c, Supplementary Fig. 4a,b). TPX2 activates AURKA by locking it in an active conformation and protecting it from protein phosphatases24. Overexpression of TPX2 activated AURKA and caused resistance (Fig. 2b) whereas expression of other reported AURKA activators did not (Supplementary Fig. 4c,d). TPX2 is degraded by the ubiquitin E3 ligase Anaphase Promoting Complex bound to the specific activator CDH1 (APC/C) during mitotic exit and G1 phase27. By subcellular fractionation, we confirmed that CDH1 was nuclear in parental and resistant cells as expected28. In contrast, TPX2 was cytosolic in acquired resistant cells whereas in parental cells it was more likely to be nuclear (Supplementary Fig. 4e). Hence, TPX2 is not co-localized with the complex responsible for its degradation in resistant cells. Together, these data suggest that altered TPX2 localization in acquired resistant cells contributes to AURKA activation during interphase and contributes to acquired resistance to 3rd generation EGFR-TKIs.
We next sought to determine the mechanism of synergy focusing on MLN8237, the most advanced AURKA inhibitor (Fig. 1e,f). Combination treatment resulted in reduction in cell proliferation and increase in cell death measured by YO-PRO-1 positivity in acquired resistant models (Fig. 2d,e). In PC9-RR mouse xenografts, rociletinib partially abrogated tumor growth but rapidly progressed and the combination led to a stronger initial reduction in tumor growth which was sustained for 70 days (p=2.2e-11) (Fig. 2f). We observed no apparent toxicity based on body weight (Supplementary Fig. 5a). Similar results were also observed with osimertinib where the combination resulted in decrease tumor growth in 9 out of 10 tumors derived from PC9-OR cells (p=0.001, Fig. 2g, Supplementary Fig. 5b). To understand how AURKA might regulate apoptosis and proliferation we probed several signaling pathways known to be associated with resistance to EGFR inhibitors18,19,29. Combination treatment caused a decrease in ERK and NF-κB signaling, indicating multiple potentially overlapping routes through which AURKA signaling contributes to cell growth (Fig. 2h, Supplementary Fig. 6). Therefore the combination of EGFR and Aurora kinase inhibitors induce apoptosis and are synergistic in suppressing the growth of acquired resistant cells both in vitro and in vivo.
We next sought to understand the molecular mechanisms underlying how this combination engaged apoptotic machinery focusing on the pro-apoptotic factor BIM since its induction is essential for cell death induced by EGFR-TKIs30,31. BIM and its splice variant BIM-EL are regulated by phosphorylation leading to proteasomal degradation32. EGFR inhibition alone in parental PC9 cells suppressed phospho-BIM resulting in the accumulation of BIM-EL and induced PARP cleavage consistent with previous reports (Fig. 2h)30,31. In contrast, in resistant cells the combination of EGFR-TKI and MLN8237 was necessary to suppress phospho-BIM leading to the accumulation of BIM-EL, its primary effector BAX and cleaved PARP (Fig. 2h). In normal cells, AURKA suppresses apoptosis during mitosis by suppression of BIM24,33. Since acquired resistant cells expressed high levels of phospho-AURKA throughout the cell cycle in contrast to parental cells (Supplementary Fig. 3d), these data indicate that resistant cells co-opt this natural function of AURKA for use throughout the cell cycle, thereby exploiting a redundancy in the control of BIM that is normally temporally segregated. Therefore acquired resistant cells escape from EGFR inhibition through a shift in the control of pro-apoptotic machinery from EGFR alone to both EGFR and AURKA (Fig. 2i).
We next sought to elucidate the temporal processes leading to AURKA activation in acquired resistant cells. Based on our modeling after treatment we divided the period of drug response into three distinct phases: (1) a sensitive phase, (2) a drug tolerant phase where remaining cells persist and (3) a proliferative acquired resistance phase. We measured signaling dynamics across a time course of 9 days in H1975 cells treated with osimertinib and compared this with acquired resistant H1975-OR cells that were exposed for more than 6 weeks (Fig. 3a). While osimertinib treatment inhibited EGFR throughout, we observed BIM-mediated apoptosis for two days after which it was suppressed indicating that the remaining cells were drug tolerant. In the sensitive phase, we observed a gradual increase in TPX2 followed by activation of AURKA peaking during drug tolerance and maintained into acquired resistance (Fig. 3b). These data indicate that AURKA activation emerges after chronic EGFR inhibition the formation of drug tolerant cells and acquired resistance.
Figure 3. EGFR inhibition leads to the activation of TPX2 and AURKA during drug tolerance where it is necessary for survival and emergence of acquired resistance in vitro.
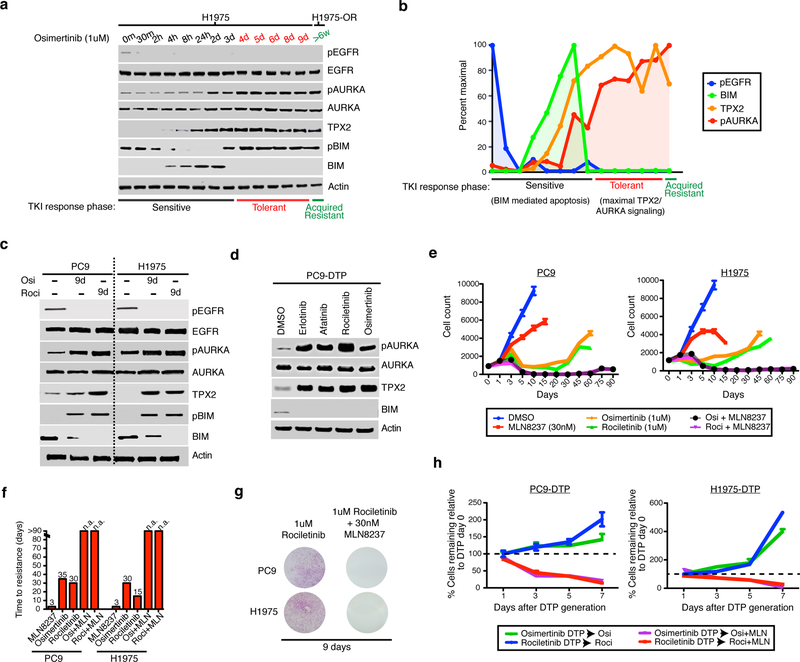
a Immunoblot of lysates from H1975 cells treated with osimertinib between 0 and 9 days and in H1975 osimertinib acquired resistant cells (H1975-OR) which have undergone continual treatment for >6 weeks. b Quantification of the indicated molecules in (a) normalized to actin and scaled by maximal intensity. c Immunoblot of indicated molecules lysates from drug tolerant PC9 or H1975 cells that persist after treatment with 1uM of the indicated agents for 9 d or in the parental cell line. d Immunoblot of PC9 drug tolerant persister (DTP) cells formed by treatment with 1uM of EGFR inhibitors erlotinib (first generation), afatinib (second generation), rociletinib or osimertinib (both third generation) for 9 d. e Growth of PC9 or H1975 cells in culture over time after plating and treated with the indicated drugs. Shown is mean over n=4 biologically independent samples per time point. f Time to resistance defined as days to reach exponential growth in various treatment conditions. n.a. = resistance not achieved after 90 d. g Clonogenic growth of PC9 and H1975 cells treated with either 1uM rociletinib or the combination of rociletinib and 30nM MLN8237 for 9 d. Images represents n=2 independent experiments. h Drug tolerant persister PC9 or H1975 cells were generated through 9 d of treatment with 1uM of osimertinib or rociletinib and then exposed to either 1uM EGFR-TKI alone or with that addition of 30nM MLN8237 for up to 7 d. Shown is mean of percent cells remaining relative to day 0 calculated from n=4 biologically independent samples per time point. Error bars s.e.m. c,d are representative images of at least two independent experiments. Full blots shown in Supplementary Fig. 11.
Since high levels of TPX2 and AURKA cause mitotic errors and polyploidy34,35, we hypothesized that its abnormal levels should also leave a signature of defects associated with mitotic stress. We surveyed for mitotic defects induced by EGFR-TKI treatment and in acquired resistant cells. Seventy-two hour treatment with EGFR-TKI resulted in an accumulation of errors in centrosome biogenesis, spindle assembly and chromosome segregation in parental and acquired resistant models (Supplementary Fig. 7a,b, Supplemental Table 2) indicating persistent mitotic stress is a feature of EGFR inhibition. Upon EGFR inhibition, errors in mitosis lead to the generation of polyploid cells (Supplementary Fig. 7c) which were phenocopied by overexpression of AURKA or TPX2 in parental cells, implying causation (Supplementary Fig. 7d,e). These data indicate that acquired resistant cells emerge from drug-tolerant cells through the AURKA-dependent suppression of BIM, coincident with mitotic stress driven by abnormal levels of TPX2 and AURKA.
Because AURKA became activated during drug tolerance, we hypothesized that AURKA might also be necessary for the formation and survival of drug tolerant cells. While osimertinib and rociletinib drug tolerant persister cells12 maintained EGFR inhibition and suppressed BIM mediated apoptosis, they also displayed increased levels of phospho-AURKA and TPX2 (Fig. 3c). This mechanism of tolerance to EGFR inhibition also observed with other EGFR inhibitors including erlotinib and afatinib (Fig. 3d). To determine if AURKA inhibition blocks the emergence of acquired resistance in EGFR-TKI naïve NSCLC cells, we treated single cell derived PC9 and H1975 cells with either single agent EGFR-TKI, MLN8237 or the combination over a period of 13 weeks and measured the rate of outgrowth of resistant clones. Combination treatments enhanced the magnitude of the response and delayed the emergence of resistance as compare to monotherapy (Fig. 3e,f). This was due to the combination increasing the proportion of cells displaying evidence of apoptosis over the course of treatment leading to a reduction in the formation of drug tolerant residual cells and was independent of which EGFR or Aurora kinase inhibitor was used (Fig. 3g, Supplementary Fig. 8a-c). Combination treatment was also effective in eradicating previously formed drug tolerant persister cells with near complete elimination within one week indicating that AURKA activity is necessary for their survival (Fig. 3h). These data suggest that the combination of EGFR-TKI and Aurora kinase inhibitors administered simultaneously or in sequence at the time of residual disease may be an effective means to enhance the initial response and postpone acquired resistance.
We next explored the contribution of AURKA activation in clinical residual disease and progression. We tested an EGFR L858R positive and T790M negative patient-derived xenograft (PDX) tumor model from a residual mass obtained from a patient demonstrating an incomplete response to erlotinib19. Rociletinib treatment only modestly impaired tumor growth, indicating cross-resistance between erlotinib and rociletinib in this model. In contrast, the combination robustly decreased tumor growth compared to rociletinib alone (p=3.4e-4) and in most cases induced tumor regression with no observed toxicity based on weight (Fig. 4a, Supplementary Fig. 9a,b). Combination treatment induced apoptosis as evident by increased staining for cleaved Caspase-3 as well as loss of Ki67 staining in tumor tissue (Supplementary Fig. 9c,d). We also observed efficacy and lack of toxicity using osimertinib in combination with MLN8237 (p=6.6e-5, Fig. 4b, Supplementary Fig. 9e,f).
Figure 4. Clinical potential of combined EGFR and Aurora kinase inhibition on residual disease and acquired resistance.
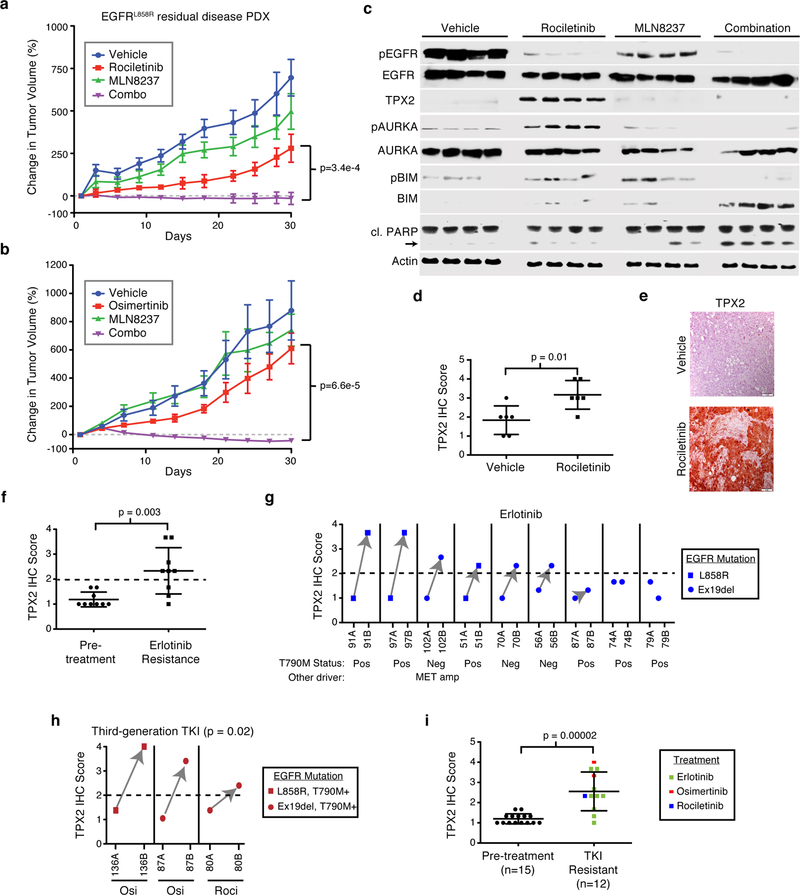
a Growth of patient derived xenograft derived from a patient with an EGFR L858R mutant lung adenocarcinoma displaying an incomplete response to erlotinib biopsied at the point of residual disease. Mice were treated with 100mg/kg rociletinib, 10mg/kg MLN8237 or the combination of rociletinib and MLN8237 for 30 d. P-value based on comparison of combination to rociletinib alone. Shown are averages over six tumors per arm. b Growth of individual PDX tumors treated 1mg/kg osimertinib, 10mg/kg MLN8237 or the combination for 30 d. P-value based on comparison of combination to osimertinib alone. Shown are averages over four tumors the osimertinib arm and six tumors in all others. c Immunoblot of lysates from individual PDX tumors harvested 30 d after the initiation of treatment with the indicated compounds. cl. PARP = cleaved PARP. Images represents n=4 independent tumors and was performed once. d Mean TPX2 levels from PDX tumors based on quantification of immunohistochemical (IHC) staining. e Representative image of TPX2 IHC from PDX tumors treated with the indicated agents. Images taken at 20× magnification. Scale bar, 100¼M. Data representative of six independent tumors. f Mean TPX2 IHC scores from 9 matched tumor samples from EGFR-mutant lung adenocarcinoma patients taken at the time of diagnosis and at the time of relapse to erlotinib. g TPX2 IHC score of patient tumor tissue obtained before (ending with A) and upon relapse on erlotinib (ending with B). Same numbers indicate tumors from same patient. Known genetic drivers of resistance based on genomic analysis are indicated. h Quantification of TPX2 IHC scores from human tumor samples taken from EGFR-mutant lung adenocarcinoma patients at the time of diagnosis (ending with the letter A) and at the time of relapse after treatment with either osimertinib or rociletinib (ending with letter B). i Mean TPX2 IHC score from all tumors taken from EGFR-mutant lung adenocarcinoma patients before treatment and after resistance to the indicated TKIs. All plots are mean with error bars as s.e.m. in panels a and b, and s.d. in panels d,f and i. P-values based two-tailed Student’s t-test. Full blot images are shown in Supplementary Fig. 11.
Consistent with our in vitro data, tumors treated with rociletinib for 30 days had lower phospho-EGFR levels and an increase in phospho-AURKA and TPX2 levels compared to vehicle alone (Fig. 4c). Enhanced TPX2 levels in rociletinib treated tumors was also evident through immuno-histochemistry (IHC) (Fig. 4d,e). EGFR suppression also induced mitotic stress in vivo, as there was a significant increase in the number of abnormal mitoses quantified via H&E staining (Supplementary Fig. 9g,h). The combination also induced apoptosis evidenced by suppression of phospho-BIM, increased total BIM and cleaved PARP compared to either single agent (Fig. 4c). These results provide mechanistic insights into processes occurring in vitro with those occuring at the point of residual disease and indicate that pharmacologically targeting AURKA at the point of maximal response or residual disease may be a viable clinical strategy to deepen responses.
We next sought to establish the clinical relevance of heightened TPX2/AURKA signaling in mediating acquired resistance to EGFR inhibition in NSCLC. Staining and automated quantification of TPX2 levels in matched diagnosis and relapse samples from 9 patients with advanced stage EGFR-mutant NSCLC who underwent treatment with erlotinib revealed a significant increase in TPX2 levels after acquired resistance as compared to pre-treatment (p=0.003, Fig. 4f). Using a threshold TPX2 score of 2 which was higher than what we observed in all 9 pre-treatment samples, we observed TPX2 positivity in 6 out of 9 cases (Fig 4g, Supplementary Fig. 10a). Interestingly, we observed increased TPX2 levels in three cases that were also EGFR T790M+ and another with MET amplification in the erlotinib resistant sample, suggesting that this non-genetic mechanism of resistance may co-occur with other genetic drivers of acquired resistance. In 3 acquired resistance cases to third generation inhibitors (two osimertinib and one rociletinib), all three were TPX2 positive and were increased compared to pre-treatment (p=0.02, Fig. 4h, Supplementary Fig. 10b). Together, resistance was associated with an increase in TPX2 regardless of EGFR-TKI used (p=2e-5, Fig. 4i). These data suggest that AURKA activation via TPX2 is a feature of most acquired resistant EGFR-mutant lung cancers regardless of therapy. We propose that TPX2 could be used as a biomarker to select patients for combination therapy with an EGFR-TKI and an Aurora kinase inhibitor in EGFR-mutant lung adenocarcinoma.
In summary, our findings have important implications for intercepting EGFR-TKI resistance in NSCLC patients, offering an alternative approach to combat the emergence of resistance. In light of observations that multiple distinct mechanisms of drug resistance can co-occur within the same patient at the time of relapse5–8, AURKA activation might co-occur with other factors driving resistance or could even provide a mechanism upon which such resistance-causing mutations could appear, giving rise to multiple genetically distinct clones11. The maintenance of residual disease by AURKA may provide a fertile ground for the formation of such resistance causing mutations, potentially through a late-emerging resistance model10,11. For example, mitotic abnormalities catalyzed by AURKA hyperactivity may give rise to gene amplifications that have been observed in patients progressing on EGFR inhibitors. Since mitotic errors lead to chromosomal instability contributing to disease progression and drug resistance36, resistance driven by AURKA may contribute to tumor heterogeneity and promote the generation of distinct clones harboring different genetic drivers of drug resistance. If correct, this adaptive response to EGFR inhibition could actually enhance tumor heterogeneity. We show AURKA contributes to a number of pathways and processes previously associated with resistance to EGFR inhibition including NF-κB, ERK and EMT26,37. Therefore it appears that AURKA is associated with a number of seemingly disparate mechanisms of acquired resistance, warranting further investigation.
Our results call for clinical trials testing the combination of Aurora kinase and EGFR inhibitors in EGFR-mutant lung adenocarcinoma, up front, at the point of residual disease, as well as after acquired resistance in tumors harboring high levels of TPX2. Patients progressing on first and third-generation EGFR-TKIs often have high levels of TPX2, indicating therapeutic relevance in a significant fraction of acquired resistant, immunotherapy refractory38 lung cancers. As single agent therapies, Aurora kinase inhibitors have reached phase III clinical trials39,40 and have non-overlapping toxicity profiles with EGFR inhibitors. We propose that the most effective use of this combination should be directed toward eliminating residual cancer cells before they acquire genetic mechanisms of resistance that could be polyclonal and heterogeneous in nature. While clinical studies will be necessary to determine the degree to which this combination strategy can delay the onset of resistance in patients, these results call to action a proactive paradigm aimed at preventing resistance rather than the current reactive paradigm of intercepting and treating drug resistance incrementally.
METHODS
Cell culture and compounds.
H1975, HCC827, and HCC4006 were from the American Type Culture Collection (ATCC). PC9 cells were a gift from Dr. F. Koizumi (National Cancer Center Research Institute and Shien-Lab, Tokyo, Japan). PC9 Parental cell line identity was confirmed by short-tandem repeat analysis (Genetica) and cells were used for no longer than 12 months before being replaced and were routinely tested for mycoplasma to ensure accuracy of experimental data. Rociletinib (CO-1686) was obtained from Clovis Inc. Erlotinib, afatinib and osimertinib (AZD9291) were purchased from Selleck Chemicals (Houston, TX USA).
Generation of acquired resistant and drug tolerant cells.
Acquired resistant cells were derived by treating individual cell lines with increasing concentration of rociletinib or osimertinib starting at 50nM followed with a stepwise dose escalation every 48 hours up to 1uM. Acquired resistance cell lines derived by rociletinib treatment (PC9-RR, H1975-RR, HCC4006-RR, and HCC827-RR) or osimertinib treatment (PC9-OR, H1975-OR, HCC4006-OR, HCC827-OR) were maintained in 1μM of the respective drug. To generate drug tolerant persister cells parental PC9, H1975 were treated with 1 μM of erlotinib, afatinib, rociletinib and osimertinib for 9 days according to protocols described previously12. Cells were washed and replenished by fresh drug every 48 hrs.
Cell Proliferation/Apoptosis Assays.
Cell lines were seeded in 384-well assay plates at a density of 1,000 cells/well in a total volume of 40 μL/well, and incubated at 37°C, 5% CO2 overnight. Following drug exposure, proliferation was measured by staining with Hoechst 33422 (Life Technologies) nuclear dye and apoptosis using YO-PRO-1 (Life Technologies) early apoptosis dye and analyzed using a Thermo CellInsight high content microscope for indicated time. IC50 values were determined using GraphPad Prism 6.0. For drug synergy, fixed dose ratios were used to determine five different drug combinations. Following 72 hours of drug exposure, proliferation and cell death was measured by staining with Hoescht (Life Technologies) nuclear dye and YO-PRO-1 (Life Technologies), respectively, and analyzed using a Thermo CellInsight High Content microscope. Synergistic, additive, or antagonistic effects were determined using the combination index (CI) method of Chou and Talalay41.
Combinatorial drug screen.
H1975-RR cells were seeded in 384-well plates at a density of 1,000 cells/well in the presence of 2uM rociletinib or vehicle and after 24 hours exposed to three different doses of compounds from a 90-drug library for 72 hours. At the end of this period nuclei were stained with Hoechst 33422 (Life Technologies) and counted using a Thermo CellInsight high content microscope. The screen was repeated three times using varying library concentrations of 5 μg/mL, 500 ng/mL, and 50 ng/mL and each combination measured in quadruplicate. Raw cell numbers were median normalized on a per-plate basis. For each compound in the library, the relative cell number in the DMSO plate was compared with the number in the rociletinib plate using a Student’s t-test. A synergy score was developed based on the −log10 of the P value of this t-test and was signed to indicate synergistic inhibition of growth (positive score) or antagonism (negative score). The reported synergy score is based on the average of scores over three different library concentrations.
Clonogenic growth assay.
Colony outgrowth assays were performed via crystal violet staining and quantification. Briefly, cells were seeded in 12-well plates at a density of 1000 cells/well. Appropriate drugs were added after an additional 24 hr. Cells were exposed to drug or DMSO for 9–10 days, with media change and fresh drug addition every 3 days. Cells were fixed with 4% formaldehyde and stained with 0.5% crystal violet. Pictures of stained cells were taken using EPSON Perfection V600. Growth was quantified by dissolving crystal violet in 0.1% SDS and absorbance quantified at 590nm using a spectrophotometer and normalized to DMSO treatment.
Immunoblot.
Cells for immunoblots were harvested and lysed in lysis buffer containing 1 mol/L Tris-HCl, pH 7.6, 0.5 mol/L EDTA, 5 mol/L NaCl, 1% NP40, and 1% Triton X-100, supplemented with protease and phosphatase inhibitors (Calbiochem). Samples were sonicated and then centrifuged at 14,000 RPM for 10 minutes at 4°C. Protein concentrations were determined by Bradford assay (Bio-Rad). Equal amounts of protein (10–40ug) were loaded onto SDS-PAGE gels, transferred to a PVDF membrane (Bio-Rad), and incubated with the indicated primary antibodies. Proteins were detected via incubation with HRP-conjugated secondary antibodies Clarity Western ECL Blotting Substrates (Bio-Rad) or SuperSignal West Femto Maximum Sensitivity Chemiluminescent Substrate (Thermo Fisher Scientific). Antibodies for pEGFR (Y1068; 3777), pERK1/2 (T202/Y204; 4370), ERK1/2 (9102), pAKT (S473; 4060), AKT (9272), PARP (5625), pAURKA (T288; 3079), AURKA (4718) pRb (S780; 9307), BIM (2933), pBIM (S69; 4585), BAX (5023), Vimentin (5741), p-p65 (S536; 3033), p65 (8242), Pan phospho-AURKA/B/C (T288/T232/T198; 2914), CD44 (3570), Histone H3 (9715) were purchased from Cell Signaling Technology; TPX2 (HPA005487) and pan total AURKA/B/C (HPA002636) were purchased from Sigma; EGFR (SC-03), NEDD9 (sc-33657), AJUBA (sc-398008), PAK1 (sc-16617), CD24 (sc-19585), CD133 (sc-30219), B-tubulin (sc-9104), p53 (sc-126) were purchased from Santa Cruz biotechnology and FZR1/CDH1 (ab3242) from Abcam and V5 tag (46–0705) from Thermofisher. Band intensities were quantified by Adobe Photoshop CS3. Phospho-RTK array were performed according to the manufacturer’s protocol (R&D systems, Minneapolis, MN USA).
Cell cycle synchronization and analysis.
For double thymidine block cells were seeded and 2mM thymidine was added and then later released from this block by washing the cells three times with PBS and adding complete media followed by second thymidine block and release. For synchronization using serum starvation and release, cells were kept in serum free media for 48hrs. For synchronizing cells in G1/S phase, cells were released for 2 hours and for synchronizing cells in G2/M phase, cells were released for 8 hours followed by drug treatment. In all cases the expected cell cycle was validated using FACS. For cell cycle analysis cells were fixed in cold ethanol and re-suspended in propidium Iodide (PI)/RNase Staining Solution (Cell Signaling Technology). After incubation for 15 minutes at room temperature in the dark, flow cytometric analysis was performed on a FACS AriaII cytometer (BD Biosciences). Flow cytometry data was analyzed by using FlowJo software to measure polyploidy (>4N).
Plasmid transfections.
LacZ, TPX2, AURKA, AURKB, AJUBA, NEDD9, PAK1 and KRAS G12V were obtained in a PLX304 backbone from Addgene (Cambridge, MA). 1ug/well of plasmids were transfected with 0.1% Fugene HD (Promega) for 48 hours before further analysis.
Quantification of mitotic defects.
Cells were plated overnight on a tissue culture treated 8-well chamber slide (ThermoFisher). After 72-hour drug treatment, cells were washed with PBS and fixed by with ice-cold methanol at −20 C for 3 min. Following fixation, cells were permeabilized with PBS and 0.1% Triton X-100 for 3 min, blocked in PBST (PBS, 5%BSA, 0.1% Triton X-100) for 30 min, and then incubated with primary antibodies in blocking buffer for 90 min. Cells were washed with PBS and incubated with species-specific fluorescent secondary antibodies (Alexa-conjugated, Molecular Probes). DNA was stained with Hoechst 33342 (1:5,000; Invitrogen) for 5min in PBS. Coverslips were mounted with ProLong Anti-fade mounting medium (MolecularProbes). Antibodies were anti a-tubulin DM1a (1:500; Sigma-Aldrich T6199), anti y-tubulin (1:500; Sigma-Aldrich D00015). Images were collected with a Zeiss Cell Observer using the 404, 488 and 561nm laser.
Human tissue and immunohistochemistry.
All patient tumor samples analyzed were obtained under IRB-approved protocols with informed consent obtained from each subject under the guidance of the University of California, San Francisco. All relevant ethical regulations were followed. Mutational status of EGFR or other known drivers or resistance was determined using either FoundationOne (Foundation Medicine, Cambridge, MA) or UCSF pathology. Tissues were fixed in 10% formalin overnight and embedded in paraffin. Tissue sections of patient derived xenograft and patients samples were sectioned on slides with 4-μm thickness. The paraffin sections were de-paraffinized in xylene and rehydrated in a graded alcohol series, boiled with 10 mmol/L of citrate buffer (pH 6) for 10 min, and treated with 0.3% H2O2 for 10 min. The steps were performed using the envision two-step method using the Envision and DAB Color kit (Gene Tech Company Limited, Shanghai). The TPX2 antibody (Sigma HPA005487, 1:200 dilution), cleaved-caspase-3 (#9661, Cell Signaling Technologies, 1:200 dilution), the mouse monoclonal antibody Ki67 (KI67-MM1-L-CE, Leica Microsystems, 1:100 dilution), were used, and PBS was used as a negative control. Images were captured using Zeiss AxioImager M1 and immunoreactivity was evaluated IHC profiler42 as an Image J plug-in in blinded manner. The evaluation was based on the staining intensity and extent of staining. The staining area was scored using the following scale, 0: 0–10%, 1: 10–20% of tissue stained positive, 2: 20–40% stained positive, 3: 40–70% stained positive and 4: > 70% positive cells. The sum of staining score (intensity + extension) index was designated as follows, 0–2: negative expression, 3–4: strong expression. IHC score was generated from 3 different areas of the slides and average score was calculated for each sample.
Mouse xenograft studies.
Cell line xenograft experiments were performed in female C.B-17 SCID mice age 8 weeks by injecting 5 X 10⁶ PC9-RR, PC9-OR tumor cells within 50% matrigel. Tumors were allowed to grow until they reached a minimum volume of 150 mm3 and mice were randomized to receive treatment by oral gavage seven days per week for 71 days. Rociletinib was formulated using 5% DMSO, 15% Solutol HS15 (Sigma Inc) in 80% water and osimertinib was formulated in 1% DMSO, 30% PEG300 and 69% water. MLN8237 was formulated using 10% (2-Hydroxypropyl)-β-cyclodextrin in water. Tumor growth was assessed twice weekly by caliper measurements. A minimum of 10 tumors per treatment group were assessed for the duration of the study. For PDX xenografts, patient derived tumor cells were engrafted subcutaneously into the flank C.B-17 SCID mice. Tumors were allowed to grow until they reached a minimum volume of 200 mm3 and then randomly placed into control or treatment groups. Animals were treated daily for 30 days via oral gavage and tumor volume was calculated daily using caliper measurement. Percentage change for tumor growth was based on volumes calculated from size on day 1 at the beginning of treatment. All animal studies were conducted in accordance with the UCSF Institutional Animal Care and Use Committee (IACUC) and all relevant ethical regulations were followed.
Real time PCR.
RNA was isolated according to the manufacturer’s instructions (TRIzol, Life Technologies). One microgram of total RNA from each sample was subjected to first-strand cDNA synthesis according to the manufacturer’s recommendations (Promega). Quantitative PCR was performed on a CFX96 Real-Time PCR detection system with a PrimeTime Gene Expression Master Mix (IDT technology) according to the manufacturer’s protocol. TPX2 was amplified with the following primers: 5′-AGGGGCCCTTTGAACTCTTA-3′ (forward primer) and 5′-TGCTCTAAACAAGCCCCATT-3′ (reverse primer). RPL13A was used as an endogenous control with the following primers: 5′-CGGATTTGGTCGTATTGG-3′ (forward primer) and 5′-TCCTGGAAGATGGTGATG-3′ (reverse primer). AURKA was amplified with following forward primer for AGTTGGCAAACGCTCTGTCT (forward primer) and GTGCCACACATTGTGGTTCT (reverse primer). AURKB was amplified using TCCCTGTTCGCATTCAACCT (forward primer) and GTCCCACTGCTATTCTCCATCAC (reverse primer). AURKC was amplified ACAACACCGGAACATCCTTC (forward primer) and TGCTGGTCCAACTTCTGATG (reverse primer). The cycling conditions for TPX2, AURKA, AURKB and AURKC and RPL13A were as follows: one cycle at 95°C for 3 min, 40 cycles of 95°C for 15 s, and 60°C for 60 s. The specificity of the PCR amplification was validated by the presence of a single peak in the melting curve analyses. Each RT-qPCR experiment was repeated three times.
In-vitro resistance assay
Single cell expanded PC9 and H1975 cells were plated in 96-well plates at a density of 500 cells per well (~10% confluency), and drug treatments began the following day. Each treatment group had 12 replicates, and drug was replaced every 72–96 hr. Each plate was harvested at the end of day 1,3,5,10,15,20,30,45,60,75 and 90 and cell proliferation measured.
Reversibility of resistance
To test the reversibility of resistance, we seeded single cell clones using limited dilution method into 384-well plates. Single cell clones were allowed to expand in absence or in presence of drugs for 14 days. Once these single cells achieved about 80% confluence at the end of 14 days, a subset that were expanded in the absence of drug were tested for the sensitization by adding 1uM of respective EGFR-TKI for 72 hours. For each cell line 96 single cell clones were analyzed in each treatment condition.
RasGTP Pull-down Assay
Cells were washed twice in ice-cold PBS and lysed in 1% TX100-TNM lysis buffer (20 mmol/L Tris pH 7.5, 5 mmol/L MgCl2, 150 mmol/L NaCl, 1% Triton X-100) supplemented with 1 mmol/L DTT, and protease and phosphatase inhibitors (SigmaAldrich). Equal amounts of protein from each sample were added to 10 ¼L of packed GST-Raf-RBD or Ral-GDS-RBD beads in 300 to 500 ¼L of 1% TX100-TNM lysis buffer and rotated at 4°C for 1 to 2 hours. Beads were washed 3 times with 1 mL of cold lysis buffer and boiled in lithium dodecyl sulfate (LDS) sample buffer (Invitrogen).
Subcellular Fractionation
Nuclear and cytoplasmic fractions were prepared using the NE-PER Nuclear and Cytoplasmic Extraction reagents (Thermo Scientific) as per manufacturer’s instruction. Protein concentration was quantitated using the BCA protein assay kit (Pierce). Equal amounts of protein were loaded in each lane and separated on a 4–12% Bis-Tris gel (Invitrogen), then transferred onto a nitrocellulose membrane.
Supplementary Material
ACKNOWLEDGEMENTS
We thank members of the Bandyopadhyay laboratory for helpful discussions and technical assistance. We also thank Jane Gordon from LCA microscopy core for technical assistance and reagents. This work was supported by NCI U01CA168370 (S.B.), NIGMS R01GM107671 (S.B.), NCI R01CA169338 (T.G.B) and NCI U54CA224081 (S.B., T.G.B).
Footnotes
COMPETING INTERESTS STATEMENT
H.J.H., L.R., A.D.S. and T.C.H. are employees of Clovis Oncology.
Reporting Summary: Further information on experimental design is available in the Nature Research Reporting Summary linked to this article.
DATA AVAILABILITY STATEMENT
All data generated or analyzed during this study are included in this published article and its supplementary information files. Cell lines generated in this study are available upon reasonable request from the authors.
REFERENCES
- 1.Janne PA, et al. AZD9291 in EGFR inhibitor-resistant non-small-cell lung cancer. The New England journal of medicine 372, 1689–1699 (2015). [DOI] [PubMed] [Google Scholar]
- 2.Sequist LV, et al. Rociletinib in EGFR-mutated non-small-cell lung cancer. The New England journal of medicine 372, 1700–1709 (2015). [DOI] [PubMed] [Google Scholar]
- 3.Rosell R, et al. Erlotinib versus standard chemotherapy as first-line treatment for European patients with advanced EGFR mutation-positive non-small-cell lung cancer (EURTAC): a multicentre, open-label, randomised phase 3 trial. The Lancet. Oncology 13, 239–246 (2012). [DOI] [PubMed] [Google Scholar]
- 4.Sequist LV, et al. Genotypic and histological evolution of lung cancers acquiring resistance to EGFR inhibitors. Science translational medicine 3, 75ra26 (2011). [DOI] [PMC free article] [PubMed] [Google Scholar]
- 5.Blakely CM, et al. Evolution and clinical impact of co-occurring genetic alterations in advanced-stage EGFR-mutant lung cancers. Nature genetics 49, 1693–1704 (2017). [DOI] [PMC free article] [PubMed] [Google Scholar]
- 6.Burrell RA & Swanton C Tumour heterogeneity and the evolution of polyclonal drug resistance. Molecular oncology 8, 1095–1111 (2014). [DOI] [PMC free article] [PubMed] [Google Scholar]
- 7.Chabon JJ, et al. Circulating tumour DNA profiling reveals heterogeneity of EGFR inhibitor resistance mechanisms in lung cancer patients. Nature communications 7, 11815 (2016). [DOI] [PMC free article] [PubMed] [Google Scholar]
- 8.Yang Z, et al. Investigating Novel Resistance Mechanisms to Third-Generation EGFR Tyrosine Kinase Inhibitor Osimertinib in Non-Small Cell Lung Cancer Patients. Clinical cancer research : an official journal of the American Association for Cancer Research 24, 3097–3107 (2018). [DOI] [PubMed] [Google Scholar]
- 9.Bivona TG & Doebele RC A framework for understanding and targeting residual disease in oncogene-driven solid cancers. Nature medicine 22, 472–478 (2016). [DOI] [PMC free article] [PubMed] [Google Scholar]
- 10.Hata AN, et al. Tumor cells can follow distinct evolutionary paths to become resistant to epidermal growth factor receptor inhibition. Nature medicine 22, 262–269 (2016). [DOI] [PMC free article] [PubMed] [Google Scholar]
- 11.Ramirez M, et al. Diverse drug-resistance mechanisms can emerge from drug-tolerant cancer persister cells. Nature communications 7, 10690 (2016). [DOI] [PMC free article] [PubMed] [Google Scholar]
- 12.Sharma SV, et al. A chromatin-mediated reversible drug-tolerant state in cancer cell subpopulations. Cell 141, 69–80 (2010). [DOI] [PMC free article] [PubMed] [Google Scholar]
- 13.Kim TM, et al. Mechanisms of Acquired Resistance to AZD9291: A Mutation-Selective, Irreversible EGFR Inhibitor. Journal of thoracic oncology : official publication of the International Association for the Study of Lung Cancer 10, 1736–1744 (2015). [DOI] [PubMed] [Google Scholar]
- 14.Li L, et al. Transformation to small-cell carcinoma as an acquired resistance mechanism to AZD9291: A case report. Oncotarget 8, 18609–18614 (2017). [DOI] [PMC free article] [PubMed] [Google Scholar]
- 15.Piotrowska Z, et al. Heterogeneity Underlies the Emergence of EGFRT790 Wild-Type Clones Following Treatment of T790M-Positive Cancers with a Third-Generation EGFR Inhibitor. Cancer discovery 5, 713–722 (2015). [DOI] [PMC free article] [PubMed] [Google Scholar]
- 16.Thress KS, et al. Acquired EGFR C797S mutation mediates resistance to AZD9291 in non-small cell lung cancer harboring EGFR T790M. Nature medicine 21, 560–562 (2015). [DOI] [PMC free article] [PubMed] [Google Scholar]
- 17.Niederst MJ & Engelman JA Bypass mechanisms of resistance to receptor tyrosine kinase inhibition in lung cancer. Science signaling 6, re6 (2013). [DOI] [PMC free article] [PubMed] [Google Scholar]
- 18.Bivona TG, et al. FAS and NF-kappaB signalling modulate dependence of lung cancers on mutant EGFR. Nature 471, 523–526 (2011). [DOI] [PMC free article] [PubMed] [Google Scholar]
- 19.Blakely CM, et al. NF-kappaB-activating complex engaged in response to EGFR oncogene inhibition drives tumor cell survival and residual disease in lung cancer. Cell reports 11, 98–110 (2015). [DOI] [PMC free article] [PubMed] [Google Scholar]
- 20.Shien K, et al. Acquired resistance to EGFR inhibitors is associated with a manifestation of stem cell-like properties in cancer cells. Cancer research 73, 3051–3061 (2013). [DOI] [PMC free article] [PubMed] [Google Scholar]
- 21.Chen J, et al. AURKA upregulation plays a role in fibroblast-reduced gefitinib sensitivity in the NSCLC cell line HCC827. Oncology reports 33, 1860–1866 (2015). [DOI] [PMC free article] [PubMed] [Google Scholar]
- 22.Eberlein CA, et al. Acquired Resistance to the Mutant-Selective EGFR Inhibitor AZD9291 Is Associated with Increased Dependence on RAS Signaling in Preclinical Models. Cancer research 75, 2489–2500 (2015). [DOI] [PMC free article] [PubMed] [Google Scholar]
- 23.Karaman MW, et al. A quantitative analysis of kinase inhibitor selectivity. Nature biotechnology 26, 127–132 (2008). [DOI] [PubMed] [Google Scholar]
- 24.Fu J, Bian M, Jiang Q & Zhang C Roles of Aurora kinases in mitosis and tumorigenesis. Molecular cancer research : MCR 5, 1–10 (2007). [DOI] [PubMed] [Google Scholar]
- 25.Sharifnia T, et al. Genetic modifiers of EGFR dependence in non-small cell lung cancer. Proceedings of the National Academy of Sciences of the United States of America 111, 18661–18666 (2014). [DOI] [PMC free article] [PubMed] [Google Scholar]
- 26.Nikonova AS, Astsaturov I, Serebriiskii IG, Dunbrack RL Jr. & Golemis EA Aurora A kinase (AURKA) in normal and pathological cell division. Cellular and molecular life sciences : CMLS 70, 661–687 (2013). [DOI] [PMC free article] [PubMed] [Google Scholar]
- 27.Stewart S & Fang G Anaphase-promoting complex/cyclosome controls the stability of TPX2 during mitotic exit. Molecular and cellular biology 25, 10516–10527 (2005). [DOI] [PMC free article] [PubMed] [Google Scholar]
- 28.Zhou Y, Ching YP, Chun AC & Jin DY Nuclear localization of the cell cycle regulator CDH1 and its regulation by phosphorylation. The Journal of biological chemistry 278, 12530–12536 (2003). [DOI] [PubMed] [Google Scholar]
- 29.Ercan D, et al. Reactivation of ERK signaling causes resistance to EGFR kinase inhibitors. Cancer discovery 2, 934–947 (2012). [DOI] [PMC free article] [PubMed] [Google Scholar]
- 30.Costa DB, et al. BIM mediates EGFR tyrosine kinase inhibitor-induced apoptosis in lung cancers with oncogenic EGFR mutations. PLoS medicine 4, 1669–1679; discussion 1680 (2007). [DOI] [PMC free article] [PubMed] [Google Scholar]
- 31.Cragg MS, Kuroda J, Puthalakath H, Huang DC & Strasser A Gefitinib-induced killing of NSCLC cell lines expressing mutant EGFR requires BIM and can be enhanced by BH3 mimetics. PLoS medicine 4, 1681–1689; discussion 1690 (2007). [DOI] [PMC free article] [PubMed] [Google Scholar]
- 32.Hubner A, Barrett T, Flavell RA & Davis RJ Multisite phosphorylation regulates Bim stability and apoptotic activity. Molecular cell 30, 415–425 (2008). [DOI] [PMC free article] [PubMed] [Google Scholar]
- 33.Moustafa-Kamal M, Gamache I, Lu Y, Li S & Teodoro JG BimEL is phosphorylated at mitosis by Aurora A and targeted for degradation by betaTrCP1. Cell death and differentiation 20, 1393–1403 (2013). [DOI] [PMC free article] [PubMed] [Google Scholar]
- 34.Anand S, Penrhyn-Lowe S & Venkitaraman AR AURORA-A amplification overrides the mitotic spindle assembly checkpoint, inducing resistance to Taxol. Cancer cell 3, 51–62 (2003). [DOI] [PubMed] [Google Scholar]
- 35.Gruss OJ, et al. Chromosome-induced microtubule assembly mediated by TPX2 is required for spindle formation in HeLa cells. Nature cell biology 4, 871–879 (2002). [DOI] [PubMed] [Google Scholar]
- 36.Lee AJ, et al. Chromosomal instability confers intrinsic multidrug resistance. Cancer research 71, 1858–1870 (2011). [DOI] [PMC free article] [PubMed] [Google Scholar]
- 37.D’Assoro AB, et al. The mitotic kinase Aurora--a promotes distant metastases by inducing epithelial-to-mesenchymal transition in ERalpha(+) breast cancer cells. Oncogene 33, 599–610 (2014). [DOI] [PMC free article] [PubMed] [Google Scholar]
- 38.Lee CK, et al. Clinical and Molecular Characteristics Associated With Survival Among Patients Treated With Checkpoint Inhibitors for Advanced Non-Small Cell Lung Carcinoma: A Systematic Review and Meta-analysis. JAMA oncology 4, 210–216 (2018). [DOI] [PMC free article] [PubMed] [Google Scholar]
- 39.Bavetsias V & Linardopoulos S Aurora Kinase Inhibitors: Current Status and Outlook. Frontiers in oncology 5, 278 (2015). [DOI] [PMC free article] [PubMed] [Google Scholar]
- 40.Melichar B, et al. Safety and activity of alisertib, an investigational aurora kinase A inhibitor, in patients with breast cancer, small-cell lung cancer, non-small-cell lung cancer, head and neck squamous-cell carcinoma, and gastro-oesophageal adenocarcinoma: a five-arm phase 2 study. The Lancet. Oncology 16, 395–405 (2015). [DOI] [PubMed] [Google Scholar]
- 41.Chou TC Drug combination studies and their synergy quantification using the Chou-Talalay method. Cancer research 70, 440–446 (2010). [DOI] [PubMed] [Google Scholar]
- 42.Varghese F, Bukhari AB, Malhotra R & De A IHC Profiler: an open source plugin for the quantitative evaluation and automated scoring of immunohistochemistry images of human tissue samples. PloS one 9, e96801 (2014). [DOI] [PMC free article] [PubMed] [Google Scholar]
Associated Data
This section collects any data citations, data availability statements, or supplementary materials included in this article.