Abstract
Arterial Spin Labeling (ASL) MRI is increasingly used in research and clinical settings. The purpose of this work is to develop a cloud-based tool for ASL data processing, referred to as ASL-MRICloud, which may be useful to the MRI community. Different from existing ASL toolboxes that are based on software installation on user’s local computer, ASL-MRICloud uses a web browser for data upload and results download, and the computation is performed on the remote server. As such, this tool is independent of user’s operating system, software version, or CPU speed. The ASL-MRICloud tool was implemented to be compatible with data acquired by scanners from all major MRI manufacturers, is capable of processing several common forms of ASL, including pseudo-continuous ASL and pulsed ASL, and can process single-delay and multi-delay ASL data. The outputs of ASL-MRICloud include absolute and relatively values of cerebral blood flow (CBF), arterial transit time (ATT), voxel-wise masks indicating regions with potential hyper-perfusion and hypo-perfusion, and an image quality index. The ASL tool is also integrated with T1-based brain segmentation and normalization tool in MRICloud to allow generation of parametric maps in standard brain space as well as region-of-interest values. The tool was tested on a large dataset containing 309 ASL scans as well as on publically available ASL data from the Alzheimer’s Disease Neuroimaging Initiative (ADNI) study.
Arterial Spin Labeling (ASL) MRI is increasingly used in research and clinical settings. The purpose of this work is to develop a cloud-based tool for ASL data processing, referred to as ASL-MRICloud, which may be useful to the MRI community. Different from existing ASL toolboxes that are based on software installation on user’s local computer, ASL-MRICloud uses a web browser for data upload and results download, and the computation is performed on the remote server.
Keywords: ASL-MRICloud, arterial spin labeling, cerebral blood flow, cloud computing, data analysis
Graphical Abstract
1. INTRODUCTION
Arterial spin labeling (ASL) MRI is a noninvasive method to quantify hemodynamic parameters such as cerebral blood flow (CBF). This technique is increasingly used in studies of brain function, physiology, and neurological and psychiatric diseases. All major MRI manufacturers now provide ASL MRI as part of their product portfolio. Major multi-site studies such as Alzheimer’s Disease Neuroimaging Initiative (ADNI),1 Adolescent Brain Cognitive Development (ABCD),2 and UK Biobank study3 have also included ASL MRI in their scan protocol.
As acquisition of ASL perfusion data becomes more accessible to the broader imaging community, processing of ASL data emerges as a timely issue. ASL is a specialized pulse sequence and its signal is determined by a kinetic model that describes the time-dependence of arterial spins as they travel to capillary and tissue. Many potential users of ASL such as radiologists, neurologists, psychiatrists, and neuroscientists may not have the expertise to carry out these sophisticated modeling procedures. Therefore, a turnkey solution for ASL data processing is expected to significantly facilitate the wide application of this promising technique.
In this work, we developed a cloud-based tool for ASL data processing, termed as ASL-MRICloud. This tool is based on the infrastructure of MRICloud.org.4,5 Compared with other existing ASL toolboxes,6–11 which are based on local computing, ASL-MRICloud is based on cloud computing. The cloud-based tool uses computational and storage resources on a remote server and the user only needs to upload the raw data to the server using a webpage. ASL processing is ideally suited for cloud computing because analysis of ASL data does not require frequency user adjustments or interactive inputs. The main strengths of this tool are that it does not depend on local computer operating system, does not require installation of any software, places no constraints on the CPU or memory capacity of the local computer, and that the developer rather than the user will take the responsibility of software upgrade.
The ASL-MRICloud tool was implemented to be compatible with data acquired by scanners from all major MRI manufacturers. Given the presence of multiple ASL variants, our tool was made to be capable of processing several common forms of ASL scheme, including pseudo-continuous ASL (PCASL), pulsed ASL (PASL), and multi-delay ASL. The ASL-MRICloud tool is also compatible with background suppression schemes as well as multi-slice and 3D acquisitions, which require slightly different equations in perfusion quantification. A quality control index is also provided by the tool. Furthermore, an important advantage of our tool is that the processing of ASL data is integrated with a sophisticated T1-based multi-atlas brain segmentation tool in the MRICloud platform. Consequently, the outcome CBF results are presented in Montreal-Neurologic-Institute (MNI) template space with regional values of up to 289 standard brain structures, which can readily undergo statistical analysis. This article provides a description of the ASL-MRICloud tool in terms of its functionalities, main algorithms used in the pipeline, typical steps to use it, and representative results, so that users of the tool can find the exact algorithms used in the processing and can refer to these technical details in their scientific reports.
2. METHODS
2.1. General concept of ASL-MRICloud
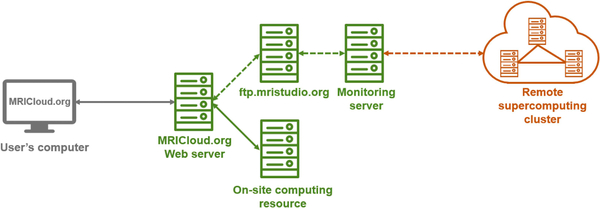
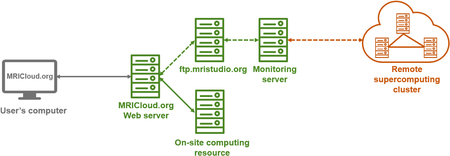
The framework of the ASL-MRICloud is illustrated in Figure 1. The proposed ASL-MRICloud with an option of the T1 multi-atlas brain segmentation is highly computing intensive. Instead of performing computational analysis of the ASL data on the user’s local computer, the tool places the computational and programming burden on our internal or publicly available computation resources such as Computational Anatomy Gateway via XSEDE (www.xsede.org) (Figure 1). To start, the user only needs to upload the ASL data onto the server using a web browser and click the submit button. Then, a few minutes later, quantitative perfusion outcomes will be available for download. The user can then download the outcomes and conduct their study-specific statistical analysis. For the software upgrade and maintenance, the developers will take the responsibility and free the user from installing updates or patches. The deployment of the software is conducted in a version-controlled manner. That is, when a new version is released, it will have a specific version number and all older versions are still available on the ASL-MRICloud.
Figure 1.
General framework of the ASL-MRICloud platform. The user interacts with a web server computer to upload their image data and submit the job. The web server computer in turn transfers the data to on-site computers inside Johns Hopkins University (JHU) for computing and processing (green solid arrow). When necessary, supercomputing resources outside the JHU will be used (orange dash arrow), in which the uploaded image data are placed in a queue via FTP and transferred to a supercomputing resource via a monitoring server. Once the processing is completed, the results are available to the user for download through the web server.
2.2. Major steps of using ASL-MRICloud
When the user browses the ASL-MRICloud website, https://braingps.mricloud.org/asl.v4, a main page, shown in Figure S1, is displayed. The user is requested to complete the following steps:
-
Step 1.
Upload the ASL file. At present, the required file format is ANALYZE (.hdr and .img). This is because this file format does not contain Patient Health Information (PHI), thus it is compatible with Health Insurance Portability and Accountability Act (HIPAA) regulations.
-
Step 2.
Upload an optional equilibrium magnetization (M0) file. Information of M0 is necessary for quantitative estimation of CBF in the unit of ml/100g/min. If an M0 image was acquired in the experiment, the user should upload the file in this step. If the M0 image is already incorporated in the ASL data file (usually the first or last volume of the scan), then no additional files are needed. If an M0 image was not acquired, the user can skip this step. The processing algorithm (described below) will use the ASL data to estimate M0.
-
Step 3.
Upload an optional T1 anatomic file. Most research requires the CBF image to be registered to high-resolution anatomic space or standard template, e.g. MNI, space. Therefore, the tool gives the user an option to upload a high-resolution T1 data set for registration and normalization purposes.
-
Step 4.
Provide imaging parameters. The user is requested to select or provide sequence information that is necessary for CBF quantification. This includes the type of ASL sequence (e.g. PCASL or PASL), the order of data presentation (control first or label first), image acquisition method (2D or 3D), labeling duration, post-labeling delay, background suppression timings, as well as assumptions necessary in the kinetic model such as blood T1, brain-blood-partition coefficient, and labeling efficiency. Some of these imaging parameters are quite technical and may require the user to consult with their MR physicist to obtain these values. However, they will only need to do this once in the entire analysis because most likely the same sequence parameters are used in all data sets in their study.
2.3. Major functionalities of ASL-MRICloud
2.3.1. Quantification of CBF using single-delay ASL
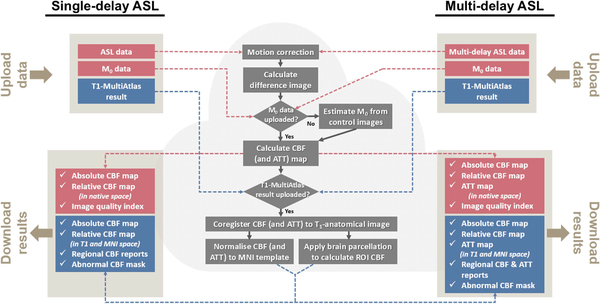
The processing pipeline of single-delay ASL is illustrated in Figure 2. The ASL image series is corrected for motion, in which all control and label images are aligned to their respective first time point.12 The difference images (i.e. control-label) are then calculated. Next, information about M0 is determined. If the user has uploaded an M0 image, a voxel-by-voxel M0 map is used. To alleviate partial voluming effects in voxels near brain boundary which result in low signal intensity, the M0 image is smoothed by a 3×3×3 kernel before being used for voxel-wise division. Additionally, in cases when the uploaded M0 image was acquired with a TR of less than 5 seconds, the image will be adjusted for T1 recovery before being used as M0 map. If an M0 image is not uploaded, a global M0 will be used in CBF quantification. The pipeline will estimate the equilibrium magnetization from the control images, after accounting all RF pulses present in the pulse sequence and by assuming a tissue T1. However, it should be noted that a global M0 may introduce some bias in CBF estimation due to inhomogeneous distribution of proton density and T2*.
Figure 2.
Major processing steps implemented in ASL-MRICloud. Both single-delay and multi-delay ASL data can be processed with our tool. Red boxes represent processing steps when a T1-weighted anatomic image is not uploaded. Blue boxes represent the additional processing steps when a T1 image is uploaded, which provides parametric maps in the MNI-space.
The quantification of CBF follows models described in the ASL white paper.13 Specifically, voxel-wise CBF value is obtained by
| [1] |
for PCASL and
| [2] |
for PASL. In Eqs. [1] and [2], is the CBF in mL/100 g/min, is the brain/blood partition coefficient in mL/g, is the difference signal intensity between control and label images, is the longitudinal relaxation rate of artery blood in Hz, is the labeling efficiency, and is the labeling duration in seconds, and PLD is the post-labeling delay.
The single-delay ASL data can also be processed in a batch mode, in which up to 10 data sets can be uploaded and processed at once.
2.3.2. Quantification of CBF and ATT using multi-delay ASL
The processing pipeline of multi-delay ASL is illustrated in Figure 2. Pre-processing steps of motion correction and control-label subtraction were similar to that of single-delay ASL. In particular, within each PLD, the repetitions are realigned to their first time point. Then, in order to realign images from different PLDs, the first repetition of each PLD is registered to the first repetition of the first PLD, generating PLD-specific transformation matrix (affine transformation). The transformation matrix is then applied to realigned repetitions within each PLD, respectively. For M0 determination, if an M0 image is not uploaded, the pipeline will use the ASL data to estimate a voxel-by-voxel M0 map. In the case of PCASL, the M0 map is obtained by fitting the control signals as a function of PLD to a saturation recovery equation. In the case of multi-delay PASL which is sometimes acquired using a Look-Locker acquisition scheme, the control signals is fitted to a slightly different equation to account for the Look-Locker acquisition:14,15
| [3] |
in which and , theta is the excitation flip angle, and ΔPLD is the interval between excitation pulses.
For quantification of CBF and ATT from the multi-delay ASL data, the signals are fitted to a kinetic model using a nonlinear least-square curve fitting with trust-region-reflective algorithm.16,17 Specifically, for multi-delay PCASL, the signals are fitted to the following equations:
| [4] |
in which , where is the longitudinal relaxation rate of tissue in Hz, and is the ATT. For multi-delay PASL with look-locker acquisition, the signals are fitted to the following equations:
| [5] |
in which , and is the duration from labeling pulse to the time when the trailing edge of the label reaches the imaging voxel. A voxel-by-voxel fitting of the signals to these equations then yields maps of CBF, ATT, and .
2.3.3. Presentation of ASL results in anatomic and template spaces
If a T1 data set has been uploaded, the ASL control image will be coregistered to the individual T1 space using a 12-parameter affine transformation, which is also applied to the parametric maps, e.g. CBF and ATT. Furthermore, all images will be normalized to the MNI space by applying an elastic transformation determined by the T1-MRICloud tool.
Finally, since the T1 data set also contain parcellation results of the individual brain, regional CBF values up to 289 ROIs will be obtained.
2.3.4. Examination assistance indices
To aid users to conduct further examinations of the CBF maps, we provide two additional indices on each data set. One is an ASL image quality index (QI), which is a categorical scale that indicates the general SNR of the data ranging from 1 (Excellent) to 4 (Poor). To calculate the image QI, voxel-wise standard deviations of the ASL difference images were first computed across repetitions, and were divided by the square root of repetitions to account for the benefit of averaging. Next, these values were averaged across the whole-brain and divided by whole-brain averaged difference signals. Finally, the continuous values were converted to a categorical scale (i.e. 1, 2, 3, or 4) based on predefined thresholds: 0.0 to 0.47 corresponds to 1; 0.47 to 0.73 corresponds to 2; 0.73 to 1.00 corresponds to 3; 1.00 and above corresponds to 4. It should be pointed out that ASL data with higher resolution tend to result in lower voxel-wise SNR and thus lower QI. We further validated the QI by comparing it to the manual ratings of an expert ASL researcher in a large CBF database consisting of 309 healthy volunteers ranging from 20 to 89 years old.18
The second index is a voxel-wise Z-score map that indicates potential hyperperfusion and hypoperfusion regions, referred to as perfusion abnormality (Abnorm) map. We first established expected CBF and its normal variation by calculating voxel-by-voxel distributions of relative CBF in our database of 309 healthy volunteers and obtained voxel-wise maps of mean and standard deviation. For a new CBF map that the user uploads, we can then calculate a map of Z-scores based on the mean and standard deviation of the healthy subjects. Due to the limited sample size, we did not further divide our database of 309 healthy volunteers into age-specific sub-groups. We also did not separate the database by genders because a voxel-wise comparison (data not shown) suggested that males and females have no systematic difference in relative CBF maps. The Abnorm index was tested on ASL data from Moyamoya patients with arterial stenosis.
2.3.5. Experimental data used to test the tool
The single-delay ASL pipeline was tested using PCASL data acquired in a previous aging study18,19 and PASL data acquired in the Alzheimer’s Disease Neuroimaging Initiative (ADNI) database (adni.loni.ucla.edu). For the PCASL data, the participants consisted of 309 healthy volunteers aged from 20 to 89 years old (average age 54±19 years, 114 males, 195 females). The imaging parameters were: FOV = 240×240 mm2, matrix = 80×80, multi-slice acquisition with 27 axial slices acquired in an ascending fashion, thickness = 5 mm, TR/TE = 4020 ms/14 ms, labeling duration = 1650 ms, post-labeling delay of the lowest slice = 1525 ms, single-shot echo-planar imaging (EPI), 30 pairs of label and control images, and duration = 4 min. For the PASL data, baseline scans from ADNI 3 participants were used. This cohort included 29 cognitively normal elderly (average age 72±8 years, 8 males, 21 females). ASL data were acquired using the Siemens product PICORE sequence.20 The imaging parameters were: FOV = 256×256 mm2, matrix = 64×64, multi-slice acquisition with 24 axial slices, 4 mm thick slices with a 25% gap between the adjacent slices, TR/TE = 3400/13 ms, TI1/TI2 = 700/1900 ms. The first volume of the 105 ASL acquisitions was used as the M0 image.21
The multi-delay ASL pipeline was tested using data acquired in five healthy volunteers (average age 25±2 years, 2 males).22 The multi-delay PCASL used the following imaging parameters: FOV = 180×180 mm2, matrix = 64×64, single-slice acquisition, labeling duration = 1500 ms, seven PLDs = 100 ms, 600 ms,1100 ms, 1600 ms, 2100 ms, 2600 ms, 3100 ms, 4 pairs of label and control images for each PLD, scan duration = 4 min 35 sec. The multi-delay PASL Look-Locker technique used a QUASAR labeling scheme,23 with following imaging parameters: initial PLD = 40 ms, ΔPLD = 300 ms, non-crushed acquisition, 13 PLDs, flip angle = 35°, 24 averages, scan duration = 3 min 12 sec.
The algorithm to identify abnormal perfusion territories was tested using ASL data collected from patients with a steno-occlusive disease, Moyamoya disease.24 Seven patients (average age 39 ± 10 years, 1 male and 6 females) were studied using the following imaging parameters: 2D multi-slice acquisition, labeling duration = 1650 ms, post-labeling delay = 1525ms, TR/TE = 4260 ms/14 ms, FOV = 240×240×145.5 mm3, voxel size 3×3×5 mm3, 29 axial slices without gap, 40 pairs of control and label images, scan duration = 5 min 40 sec.
3. RESULTS
3.1. Single-delay ASL
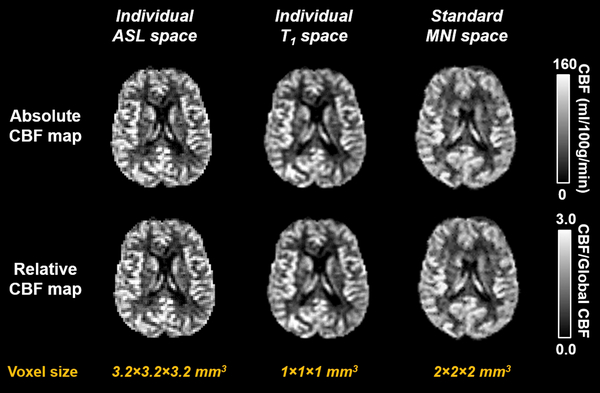
Figure 3 shows CBF maps generated from a representative single-delay PCASL data set. The outcomes include absolute (in mL/100 g/min) and relative (with reference to whole-brain CBF) CBF maps in each of the following spaces: individual ASL space, individual T1 space, and MNI space. Figure S2 shows region-of-interest (ROI) results. Three levels of brain parcellations are provided, which divide the brain into 19, 54, and 289 ROIs, respectively. Average CBF of the whole brain (including both gray matter and white matter) was 42.2±7.4 mL/100 g/min. For the PASL data from the ADNI 3 elderly participants, average CBF of the whole brain was 30.1±8.6 mL/100 g/min, which is consistent with the findings in previous ADNI publications.21
Figure 3.
Representative output images of ASL-MRICloud. CBF maps in multiple spaces are generated.
Additionally, the motion vectors are also provided in the outcome files. All outcomes of the ASL-MRICloud are downloadable through a .zip file.
3.2. Multi-delay ASL
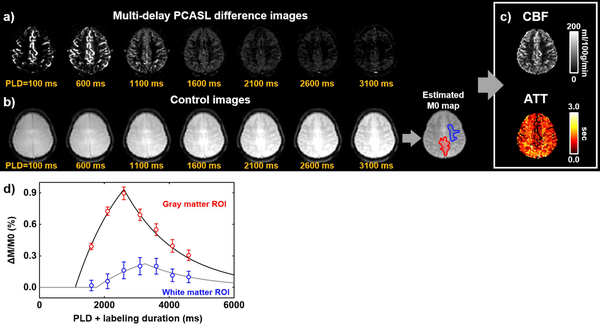
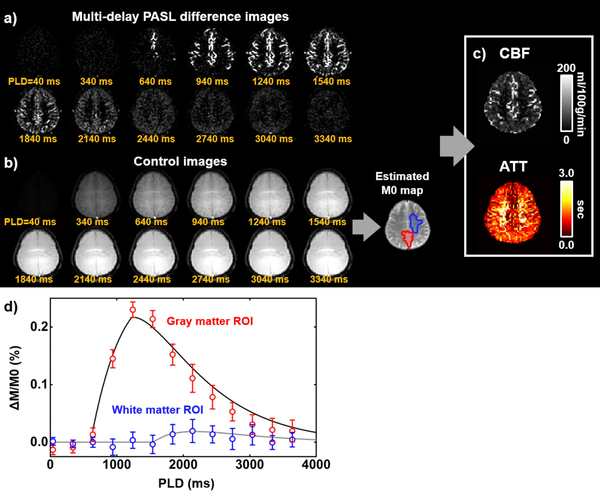
A representative multi-delay PCASL data set is shown in Figure 4. Figure 4a shows difference images, i.e. control-label, as a function of PLD. Figure 4b displayed an M0 map that was obtained from fitting the control images to a saturation recovery curve. Figure 4c shows CBF and ATT maps from the kinetic model fitting. Figure 4d illustrates ROI results from a gray matter and a white matter ROI. Average CBF and ATT were 58.4±7.2 mL/100 g/min and 1250±289 ms, respectively (N=5).
Figure 4.
Multi-delay pseudo-continuous ASL (PCASL) data processing. (a) ASL difference images as a function of post-labeling delay (PLD). (b) ASL control images as a function of PLD, which is used to estimate M0. (c) Output images of CBF and ATT computed by ASL-MRICloud. (d) Representative regional signals in the gray (red ROI in M0 map) and white matter (blue ROI in M0 map) and the corresponding model fitting curves.
Figure 5 shows a representative data set using multi-delay PASL. Average CBF and ATT were 53.1±11.0 mL/100 g/min and 1072±66 ms, respectively.
Figure 5.
Multi-delay pulsed ASL (PASL) data processing. (a) ASL difference images as a function of post-labeling delay (PLD). (b) ASL control images as a function of PLD, which is used to estimate M0. (c) Output images of CBF and ATT computed by ASL-MRICloud. (d) Representative regional signals in the gray (red ROI in M0 map) and white matter (blue ROI in M0 map) and the corresponding model fitting curves.
3.3. Examination assistance indices
Figure 6a shows four representative CBF images, one for each QI category. It can be seen that, as the QI becomes larger, the quality of the CBF images is increasingly degraded. The QI can be used as a reference for the user to decide if the data set should be excluded from group analysis. We validated the QI by comparing it to manual ratings conducted by an experienced ASL researcher. Figure 6b shows a scatter plot between the automatic QI scales and the manual ratings. Noting that the ratings are given in integers, we use the size of the circle to represent the number of data points that overlapped on certain integer coordinates. A strong correlation (r = 0.82) was observed.
Figure 6.
ASL quality index (QI). (a) Five representative CBF maps with a range of QI. In category 4, two CBF maps suffered from either poor labeling efficiency or motion are displayed. (b) The correspondence between the automatically determined QI and manual rating by an ASL expert (r = 0.82). A total of 309 datasets from healthy volunteers (age 20–89 years old) were used in calculating the plot in (b). Because the index is a discrete value and many datasets may be overlapping on the plot, the number of datasets for each symbol is indicated by its area.
Figure 7a shows an example of the Abnorm index map in a patient with Moyamoya disease, in whom both hypoperfusion (due to ischemia) and apparent hyperperfusion (due to delayed bolus clearance) are present. Figure 7b summarizes the volume ratio of abnormal perfusion region to whole brain from seven Moyamoya patients, where data was acquired in a previous published study.24
Figure 7.
Mask indicating voxels with abnormal perfusion (Abnorm). (a) Representative Abnorm mask from a patient with a cerebrovascular disease, Moyamoya disease. The TOF angiogram shows diseased vessels (red arrows) and revascularization (green arrow). The CBF map under examination is compared to a template database on a voxel-by-voxel basis and a z-score map is obtained. Voxels with CBF values outside 99.5% of the normal distribution are detected and labeled. (b) A summary of the volume ratio of abnormal voxels within the whole brain in seven Moyamoya patients,24 compared to healthy volunteers.
4. DISCUSSION
In this work, we developed ASL-MRICloud, a cloud-based tool for ASL data processing, which may be useful to the community in view of the increasing use of ASL in research and clinical settings. ASL-MRICloud employs a web interface for uploading data and downloading results, provides a fully automated analysis pipeline, and is capable of processing both single-delay and multi-delay ASL data.
4.1. Features of ASL-MRICloud
An important feature of the cloud-based analysis methods is that the user does not have to install the software on their local computer thus there is no burden on version or operating system compatibility. The tool also facilitates the dissemination of shared high-end computational resources, and the user does not have to be constrained by CPU and memory capacity of their own computer. In addition, the cloud-based analysis methods allow more efficient implementation of software updating and bug fixing. Finally, since the quantification of CBF is based on recommendations made in the ASL consensus paper, it can potentially promote standardization of ASL processing in the community.
Another useful feature associated with ASL-MRICloud is that this tool is closely integrated with other toolboxs on MRICloud, most notably the T1-MRICoud tool. The output from the T1 tool can thus be directly used by the ASL-MRICloud for registration purposes. The benefit of this integration is that CBF maps in the individual space can be automatically normalized into the MNI-space and that ROI CBF values will also be available. These outcome variables can then be readily used for study-specific statistical analyses.
To our knowledge, our group was among the first to implement cloud-based MRI processing tools in the community.5,25,26 Since its conception in 2014, more than 30,000 processing jobs have been submitted through MRICloud. For ASL-MRICloud, since this tool was launched in 2016, approximately 3,000 jobs from outside our institution have been submitted and processed. Several research studies that used ASL-MRICloud has been published in scientific journals.19,27
4.2. Comparison with other ASL processing software
Several other ASL processing programs have been developed. The ASL toolbox is a MATLAB-based script tool that is capable of providing CBF quantification, spatial normalization, and group analysis.6 In addition, the ASL toolbox also includes outlier elimination function, as well as cortex activation detection in functional ASL data.28 This tool requires functions from a MATLAB-based software SPM. The user is also required to have basic MATLAB programming skills and several steps of the processing require manual operation. Another ASL processing package that is based on Linux operating system is BASIL,7 one of the toolboxes from the Functional Software Library (FSL) suite. BASIL is based on Bayesian inference principles and was primarily developed for multi-delay ASL data. The package provides functions for estimation of perfusion and bolus arrival time, spatial regularization, and partial volume correction, without relying on a MATLAB environment. The use of this tool requires command line inputs and multi-subject processing is not feasible on the graphic interface. Another tool, Automatic software for ASL processing (ASAP),11 is a MATLAB-based package that wraps scripts into a user-friendly interface and is not based on command line. In addition to the above-mentioned toolboxes that provide comprehensive processing of ASL MRI data, several algorithms aiming to improve specific processing steps have also been proposed, such as Enhancement of Automated Blood Flow Estimates (ENABLE) for eliminating poor volumes of ASL signal,29 and Voxel-Wise Functional Connectomics for functional ASL denoising.9
4.3. Protection of health information
Compared to ASL processing tools that are installed on local computers, ASL-MRICloud requires the user to upload their raw MRI data to a cloud server for processing. Thus, it is necessary that protected health information (PHI) is removed before uploading. In the current implementation, this requirement is met by using ANALYZE format in the file uploading. For users who only have DICOM files, we developed a converter software (written in C++) that removes the PHI from the DICOM data and save the de-identified data in ANALYZE file format.
Some countries prohibit researchers from sending certain medical data to foreign countries. Our processing servers are currently located in USA. Such regulations could vary depending on countries and the nature of the data (e.g. whether the data were originated from clinical data or research data or with or without consent forms). In general, regulations are stricter for data originally acquired for clinical purposes. Readers are advised to consult with administrators before sending such data to our cloud services.
4.4. Limitations
One limitation of ASL-MRICloud is that it did not build in the flexibility for the user to adjust steps in the workflow. For example, some user may prefer some spatial smoothing of the data, but this is not feasible in the current implementation. We made this decision based on considerations of a tradeoff between flexibility and complexity. Another limitation is that there is an upper limit on the batch size, i.e. 10 data sets, the user can upload each time. This restriction was applied in consideration of the uploading size, preventing prolonged uploading time or upload abortion due to interrupted internet connection. Even with the current batch limit, we sometimes receive reports from our users that the time it takes to upload the data was excessive in certain part of the world. Therefore, we feel that a batch size of 10 is appropriate for our tool. For studies with large subject number, the user only needs to divide the data sets into several batches. A third potential limitation of ASL-MRICloud is that only the most common forms of ASL schemes were currently implemented. Future work will consider the inclusion of other promising ASL sequeunces such as velocity selective ASL,30,31 Hadamard time-encoded ASL,32–34 and MR fingerprinting ASL. 22,35
5. CONCLUSION
We have developed an online processing tool for ASL MRI data, referred to as ASL-MRICloud. The tool is web-based and the processing is automatic. Use of the tool does not require installation of software on the local computer. We demonstrated that ASL-MRICloud can provide quantitative CBF maps in both individual and standard space as well as ROI CBF values in major brain structures. ASL-MRICloud may be a useful tool for ASL MRI data processing in clinical and research settings.
Supplementary Material
Acknowledgments
Grant Sponsors:
NIH R01 NS106711, NIH R01 MH084021, NIH R37 AG006265, NIH R01 AG042753, NIH R01 AG047972, NIH R21 NS095342, NIH R21 NS085634, NIH R43 NS078917, NIH R01 NS084957, NIH R01 NS086888 and NIH P41 EB015909.
Abbreviations used:
- ASL
arterial spin labeling
- CBF
cerebral blood flow
- PCASL
pseudo-continuous arterial spin labeling
- PASL
pulsed arterial spin labeling
- MNI
Montreal-Neurologic-Institute
- ROI
region of interest
- QI
quality index
- PLD
post-labeling delay
- ATT
arterial-travel-time
- EPI
echo-planar imaging
- PHI
protected health information
REFERENCES
- 1.Jack CR, Bernstein MA, Fox NC, et al. The Alzheimer’s Disease Neuroimaging Initiative (ADNI): MRI methods. J Magn Reson Imaging. 2008;27(4):685–691. [DOI] [PMC free article] [PubMed] [Google Scholar]
- 2.Jernigan TL, Brown SA, Dowling GJ. The Adolescent Brain Cognitive Development Study. J Res Adolescence. 2018;28(1):154–156. [DOI] [PMC free article] [PubMed] [Google Scholar]
- 3.Miller KL, Alfaro-Almagro F, Bangerter NK, et al. Multimodal population brain imaging in the UK Biobank prospective epidemiological study. Nat Neurosci. 2016;19(11):1523–1536. [DOI] [PMC free article] [PubMed] [Google Scholar]
- 4.ASL-MRICloud website, https://braingps.mricloud.org/asl.v4.
- 5.Mori S, Wu D, Ceritoglu C, et al. MRICloud: Delivering High-Throughput MRI Neuroinformatics as Cloud-Based Software as a Service. Comput Sci Eng. 2016;18(5):21–35. [Google Scholar]
- 6.Wang Z, Aguirre GK, Rao H, et al. Empirical optimization of ASL data analysis using an ASL data processing toolbox: ASLtbx. Magn Reson Imaging. 2008;26(2):261–269. [DOI] [PMC free article] [PubMed] [Google Scholar]
- 7.Chappell MA, Groves AR, Whitcher B, Woolrich MW. Variational Bayesian Inference for a Nonlinear Forward Model. Ieee T Signal Proces. 2009;57(1):223–236. [Google Scholar]
- 8.Hernandez-Garcia L, Jahanian H, Rowe DB. Quantitative analysis of arterial spin labeling FMRI data using a general linear model. Magn Reson Imaging. 2010;28(7):919–927. [DOI] [PMC free article] [PubMed] [Google Scholar]
- 9.Liang X, Connelly A, Calamante F. Voxel-Wise Functional Connectomics Using Arterial Spin Labeling Functional Magnetic Resonance Imaging: The Role of Denoising. Brain Connect. 2015;5(9):543–553. [DOI] [PubMed] [Google Scholar]
- 10.Shirzadi Z, Crane DE, Robertson AD, et al. Automated removal of spurious intermediate cerebral blood flow volumes improves image quality among older patients: A clinical arterial spin labeling investigation. J Magn Reson Imaging. 2015;42(5):1377–1385. [DOI] [PubMed] [Google Scholar]
- 11.Abad VM, Garcia-Polo P, O’Daly O, Hernandez-Tamames JA, Zelaya F. ASAP (Automatic Software for ASL Processing): A toolbox for processing Arterial Spin Labeling images. Magn Reson Imaging. 2016;34(3):334–344. [DOI] [PubMed] [Google Scholar]
- 12.Friston KJ, Ashburner J, Frith CD, Poline JB, Heather JD, Frackowiak RSJ. Spatial registration and normalization of images. Human Brain Mapping. 1995;3(3):165–189. [Google Scholar]
- 13.Alsop DC, Detre JA, Golay X, et al. Recommended implementation of arterial spin-labeled perfusion MRI for clinical applications: A consensus of the ISMRM perfusion study group and the European consortium for ASL in dementia. Magn Reson Med. 2015;73(1):102–116. [DOI] [PMC free article] [PubMed] [Google Scholar]
- 14.Shin WY, Gu H, Yang YH. Fast High-Resolution T-1 Mapping Using Inversion-Recovery Look-Locker Echo-Planar Imaging at Steady State: Optimization for Accuracy and Reliability. Magnetic Resonance in Medicine. 2009;61(4):899–906. [DOI] [PMC free article] [PubMed] [Google Scholar]
- 15.Li W, Griswold M, Yu X. Rapid T-1 Mapping of Mouse Myocardium With Saturation Recovery Look-Locker Method. Magnetic Resonance in Medicine. 2010;64(5):1296–1303. [DOI] [PMC free article] [PubMed] [Google Scholar]
- 16.Coleman TF, Li YY. An interior trust region approach for nonlinear minimization subject to bounds. Siam J Optimiz. 1996;6(2):418–445. [Google Scholar]
- 17.Thomas FC, Li YY. On the Convergence of Interior-Reflective Newton Methods for Nonlinear Minimization Subject to Bounds. Math Program. 1994;67(2):189–224. [Google Scholar]
- 18.Lu H, Xu F, Rodrigue KM, et al. Alterations in cerebral metabolic rate and blood supply across the adult lifespan. Cereb Cortex. 2011;21(6):1426–1434. [DOI] [PMC free article] [PubMed] [Google Scholar]
- 19.De Vis JB, Peng SL, Chen X, et al. Arterial-spin-labeling (ASL) perfusion MRI predicts cognitive function in elderly individuals: A 4-year longitudinal study. J Magn Reson Imaging. 2018. [DOI] [PMC free article] [PubMed] [Google Scholar]
- 20.Wong EC, Buxton RB, Frank LR. Implementation of quantitative perfusion imaging techniques for functional brain mapping using pulsed arterial spin labeling. Nmr Biomed. 1997;10(4–5):237–249. [DOI] [PubMed] [Google Scholar]
- 21.Wang Z, Das SR, Xie SX, et al. Arterial spin labeled MRI in prodromal Alzheimer’s disease: A multi-site study. Neuroimage Clin. 2013;2:630–636. [DOI] [PMC free article] [PubMed] [Google Scholar]
- 22.Su P, Mao D, Liu PY, et al. Multiparametric Estimation of Brain Hemodynamics With MR Fingerprinting ASL. Magnetic Resonance in Medicine. 2017;78(5):1812–1823. [DOI] [PMC free article] [PubMed] [Google Scholar]
- 23.Petersen ET, Lim T, Golay X. Model-free arterial spin labeling quantification approach for perfusion MRI. Magnetic Resonance in Medicine. 2006;55(2):219–232. [DOI] [PubMed] [Google Scholar]
- 24.Liu PY, Li Y, Pinho M, Park DC, Welch BG, Lu HZ. Cerebrovascular reactivity mapping without gas challenges. Neuroimage. 2017;146:320–326. [DOI] [PMC free article] [PubMed] [Google Scholar]
- 25.Shin DD, Ozyurt IB, Liu TT. The Cerebral Blood Flow Biomedical Informatics Research Network (CBFBIRN) database and analysis pipeline for arterial spin labeling MRI data. Front Neuroinform. 2013;7:21. [DOI] [PMC free article] [PubMed] [Google Scholar]
- 26.Shin DD, Ozyurt IB, Brown GG, Fennema-Notestine C, Liu TT. The Cerebral Blood Flow Biomedical Informatics Research Network (CBFBIRN) data repository. Neuroimage. 2016;124(Pt B):1202–1207. [DOI] [PMC free article] [PubMed] [Google Scholar]
- 27.Stephens JA, Liu PY, Lu HZ, Suskauer SJ. Cerebral Blood Flow after Mild Traumatic Brain Injury: Associations between Symptoms and Post-Injury Perfusion. J Neurotraum. 2018;35(2):241–248. [DOI] [PMC free article] [PubMed] [Google Scholar]
- 28.Wang Z Improving cerebral blood flow quantification for arterial spin labeled perfusion MRI by removing residual motion artifacts and global signal fluctuations. Magn Reson Imaging. 2012;30(10):1409–1415. [DOI] [PMC free article] [PubMed] [Google Scholar]
- 29.Shirzadi Z, Stefanovic B, Chappell MA, et al. Enhancement of automated blood flow estimates (ENABLE) from arterial spin-labeled MRI. J Magn Reson Imaging. 2018;47(3):647–655. [DOI] [PubMed] [Google Scholar]
- 30.Wong EC, Cronin M, Wu WC, Inglis B, Frank LR, Liu TT. Velocity-selective arterial spin labeling. Magn Reson Med. 2006;55(6):1334–1341. [DOI] [PubMed] [Google Scholar]
- 31.Qin Q, van Zijl PC. Velocity-selective-inversion prepared arterial spin labeling. Magn Reson Med. 2016;76(4):1136–1148. [DOI] [PMC free article] [PubMed] [Google Scholar]
- 32.Wells JA, Lythgoe MF, Gadian DG, Ordidge RJ, Thomas DL. In vivo Hadamard encoded continuous arterial spin labeling (H-CASL). Magn Reson Med. 2010;63(4):1111–1118. [DOI] [PubMed] [Google Scholar]
- 33.Dai WY, Shankaranarayanan A, Alsop DC. Volumetric measurement of perfusion and arterial transit delay using hadamard encoded continuous arterial spin labeling. Magnetic Resonance in Medicine. 2013;69(4):1014–1022. [DOI] [PMC free article] [PubMed] [Google Scholar]
- 34.Teeuwisse WM, Schmid S, Ghariq E, Veer IM, van Osch MJ. Time-encoded pseudocontinuous arterial spin labeling: basic properties and timing strategies for human applications. Magn Reson Med. 2014;72(6):1712–1722. [DOI] [PubMed] [Google Scholar]
- 35.Wright KL, Jiang Y, Ma D, et al. Estimation of perfusion properties with MR Fingerprinting Arterial Spin Labeling. Magn Reson Imaging. 2018;50:68–77. [DOI] [PMC free article] [PubMed] [Google Scholar]
Associated Data
This section collects any data citations, data availability statements, or supplementary materials included in this article.


