

Abstract
Background:
Existing functional connectivity studies of obsessive-compulsive disorder (OCD) support a model of circuit dysfunction. However, these group-level observations have failed to yield neuroimaging biomarkers sufficient to serve as a test for the OCD diagnosis, to predict current or future symptoms, or to predict treatment response, perhaps because these studies failed to account for the substantial inter-subject variability in structural and functional brain organization.
Methods:
We used functional regions, localized in each of 41 individual OCD patients, to identify cortical connectivity biomarkers of both global and dimension-specific symptom severity and to detect functional connections that track changes in symptom severity following intensive residential treatment.
Results:
Global OCD symptom severity was directly linked to dysconnectivity between large-scale intrinsic brain networks – particularly between dorsal attention, default, and frontoparietal networks. Changes within a subset of connections between these networks were associated with symptom resolution. Additionally, distinct and non-overlapping cortical connectivity biomarkers were identified that were significantly associated with the severity of contamination/washing and responsibility for harm/checking symptoms, highlighting the contribution of dissociable neural networks to specific OCD symptom dimensions. By contrast, when we defined functional regions conventionally, using a population-level brain atlas, we no longer could identify connectivity biomarkers of severity or improvement for any of the symptom dimensions.
Conclusions:
Our findings would seem to encourage use of individual-level approaches to connectivity analyses in order to better delineate the cortical and subcortical networks underlying symptom severity and improvement at the dimensional level in OCD patients.
Keywords: Obsessive-compulsive disorder, OCD, fMRI, connectivity, biomarker, dimension
Introduction
Obsessive-compulsive disorder (OCD) is a prevalent chronic illness causing substantial morbidity and even mortality (1, 2). Studies using resting state functional connectivity magnetic resonance imaging (rs-fcMRI) have supported the widely accepted neurobiological model of cortico-striato-thalamo-cortical (CSTC) dysfunction in OCD (3–8), while also detecting abnormal connectivity between brain regions outside the CSTC circuit – particularly involving prefrontal (9), temporal (10, 11), and parietal (12) cortices and cerebellum (9, 11, 12). However, these group-level studies have failed to identify neuroimaging biomarkers sufficient to test for the diagnosis of OCD, predict current or future symptoms, or predict treatment response.
One critical limitation of existing rs-fcMRI studies of OCD is disregard for the high variability of structural and functional brain organization across individuals, especially in regions critical to OCD such as the association cortices (13, 14). Most of these studies have defined functional regions based on a nominal “average” brain or on subjects’ anatomy, thus failing to localize functional areas in individuals, potentially obscuring biologically important signals. Additionally, most studies have examined OCD as a single diagnostic entity without respecting its clinical heterogeneity (“symptom dimensions”), and few studies have used longitudinal within-subjects designs to examine associations between changes in connectivity and symptom severity over time.
To address these limitations, we used a subject-specific, longitudinal design to: 1) identify cortical connectivity biomarkers of both global and dimension-specific symptom severity in OCD patients, based on functional networks mapped at the individual level (14–16); and 2) detect functional connections that tracked changes in global and dimension-specific symptom severity in OCD patients following intensive residential treatment. We hypothesized that individual-level brain mapping would surpass traditional atlas-based approaches in achieving these goals.
Methods and Materials
Participants
Forty-seven participants (18–65 years) with a DSM-IV primary diagnosis of OCD, and scoring ≥ 16 on the Yale-Brown Obsessive-Compulsive Scale (YBOCS) were enrolled and received admission and discharge scans following treatment in the Obsessive-Compulsive Disorder Institute (OCDI) at McLean Hospital. After quality control of the rs-fcMRI data, data from 41 participants were retained for subsequent analysis (Table 1). See Supplemental Information for details of intensive residential treatment and rs-fcMRI data quality control.
Table 1.
Participant Demographics and Clinical Characteristics
| Characteristic | N = 41 |
|---|---|
| Age, years, mean (SD) | 27.2 (7.9) |
| Range | 18–50 |
| Education, years, mean (SD) | 15.2 (2.6) |
| Range | 11–23 |
| Sex | |
| Male, N (%) | 24 (59) |
| Female, N (%) | 17 (41) |
| Handedness | |
| Right, N (%) | 34 (83) |
| Left, N (%) | 7 (17) |
| Length of stay, days, mean (SD, range) | 56.7 (25.3, 10–100) |
| Age of OCD onset, years, mean (SD)a | 11.8 (5.8) |
| Duration of OCD, years, mean (SD)a | 15.5 (9.6) |
| Yale-Brown Obsessive-Compulsive Scale (YBOCS) | |
| Pre-treatment, mean (SD) | 26.2 (4.5) |
| Post-treatment, mean (SD) | 15.3 (7.0) |
| Six-item Hamilton Depression Rating Scale (HAM-D6) | |
| Pre-treatment, mean (SD) | 8.7 (4.5) |
| Post-treatment, mean (SD) | 4.2 (4.9) |
| Predominant OCD Symptom Dimensionb | |
| Germs and Contamination, N (%) | 13 (32) |
| Responsible for Harm, Injury, or Bad Luck, N (%) | 9 (22) |
| Unacceptable Thoughts, N (%) | 14 (34) |
| Symmetry, Completeness, and “Just Right”, N (%) | 8 (20) |
| Current DSM-IV Axis I Psychiatric Comorbidity at Time of Studyc | |
| None, N (%) | 9 (22) |
| Major depressive disorder, N (%) | 13 (32) |
| Attention deficit hyperactivity disorder, N (%)d | 8 (20) |
| Social anxiety disorder, N (%) | 8 (20) |
| Generalized anxiety disorder, N (%) | 5 (12) |
| Body dysmorphic disorder, N (%) | 3 (7) |
| Excoriation disorder, N (%) | 3 (7) |
| Hoarding disorder, N (%) | 3(7) |
| Panic disorder, N (%) | 3 (7) |
| Post-traumatic stress disorder, N (%) | 3 (7) |
| Depressive Disorder, NOS, N (%) | 2 (5) |
| Dysthymic disorder, N (%) | 2 (5) |
| Eating disorder NOS, N (%) | 2 (5) |
| Specific phobia, N (%) | 2 (5) |
| Agoraphobia, N (%) | 1 (2) |
| Alcohol dependence, without physiological dependence, N (%) | 1 (2) |
| Anorexia nervosa, N (%) | 1 (2) |
| Bipolar disorder, NOS, N (%) | 1 (2) |
| Tic disorder, N (%)d | 1 (2) |
| Medications at Admission | |
| None, N (%) | 5 (12) |
| Selective serotonin reuptake inhibitor (SSRI), N (%) | 25 (61) |
| Serotonin-norephinephrine reuptake inhibitor (SNRI), N (%) | 4 (10) |
| Clomipramine, N (%) | 7 (17) |
| Second-generation antipsychotic, N (%) | 10 (24) |
| Benzodiazepine, N (%) | 16 (39) |
| Other, N (%) | 12 (29) |
| Amphetamine/dextroamphetamine | 2 |
| Bupropion | 1 |
| Buspirone | 1 |
| Gabapentin | 1 |
| Lamotrigine | 2 |
| Lithium | 2 |
| N-acetylcysteine | 1 |
| Memantine | 1 |
| Mirtazapine | 1 |
| Trazodone | 2 |
Data not collected from one participant.
Determined by highest rated category on Dimensional Obsessive-Compulsive Scale (DOCS). Two participants scored equally high on multiple DOCS categories and therefore were considered to have more than one predominant OCD symptom dimension.
Three participants did not complete Structured Clinical Interview for DSM-IV (SCID). Primary OCD diagnosis confirmed by admission evaluation of treating psychiatrist.
Not formally assessed in SCID. Based on patient report.
Clinical evaluation
All participants completed written informed consent, approved by the Partners Institutional Review Board, for ongoing research studies in the OCDI. As part of these projects, participants received the Structured Clinical Interview for DSM-IV (SCID), and completed self-report versions of the YBOCS (17), Dimensional Obsessive-Compulsive Scale (DOCS) (18), and 6-item Hamilton Depression Rating Scale (HAM-D6) (19) at admission (within the first week of treatment), discharge (within the last week of treatment), and weekly throughout treatment. The DOCS is a self-administered measure assessing the severity of symptoms within four OCD symptom dimensions (DOCS1–4; 1-concerns about germs and contamination; 2-responsibility for harm, injury, or bad luck; 3-unacceptable thoughts; 4-concerns about symmetry, completeness, and the need for things to be “just right”) (18). The self-report versions of the YBOCS (20) and HAM-D6 (19) correlate highly with the clinician-administered versions. Additionally, participants provided separate written informed consent, approved by the Partners Institutional Review Board, to receive MRI scans at admission and discharge. At these visits, participants provided demographic information, medical/psychiatric history, and current medications.
Image acquisition
Imaging data were collected on a 3T Siemens Tim Trio scanner with a 12-channel phased-array head coil. Participants were instructed to remain still, stay awake, and keep their eyes open. The parameters for functional image acquisition were: TR 3000ms; TE 30ms; flip angle, 85°; 3×3×3 mm voxels; field of view, 216; and 47 axial sections collected with interleaved acquisition and no gap. Each functional run lasted 6.2 minutes (124 time points). Two runs were acquired per participant. Structural data included a high-resolution, multiecho, T1-weighted, magnetization-prepared, gradient-echo image, which allows increased contrast through weighted averaging of the 4 derived images (21).
Imaging data processing and identifying functional ROIs in each individual participant
Resting-state fMRI data were processed as previously described (22, 23). Cortical functional networks were first mapped in individual participants using the iterative parcellation approach presented in our previous work (15). The cortical networks were then segmented into discrete “patches” using a clustering algorithm (mri_surfcluster in FreeSurfer; see Supplemental Information). The toolboxes for mapping functional networks in individual participants and for segmenting the networks into discrete functional regions can be downloaded from our website (http://nmr.mgh.harvard.edu/bid/DownLoad.html).
We attempted to identify homologous functional regions of interest (ROIs) in each individual participant based on the 116 regions previously reported in the population-level atlas based on 1000 individuals (23). However, some small ROIs were not detected in all individuals, either due to technical limitations or because these regions were absent in some participants. For our connectivity analyses, 86 ROIs, covering 91.7% ± 1.6% of the cortical surface, were recognized in all 41 participants (Figure S1). For comparison, we also identified the 86 corresponding ROIs in the group-level network atlas.
Assessment of symptom-connectivity associations
Resting state fMRI signals in each ROI were extracted and functional connectivity among these ROIs was computed, creating a large pairwise connectivity matrix for each participant: the individualized “functional connectome.” Associations between symptom severity scores and ROI-to-ROI connectivity were investigated using a support vector machine for regression (SVR) algorithm. The SVR algorithm identifies connections associated with symptom severity score by modeling the relationship between the dependent variable (i.e., YBOCS, YBOCS improvement, DOCS, DOCS improvement) and the independent variables (ROI-to-ROI connections). The L2-regularized L2-loss SVR model was implemented in the LIBLINEAR package (https://www.csie.ntu.edu.tw/~cjlin/liblinear/), a model supporting large-scale linear regression.
The SVR model was trained and tested using leave-one-out cross validation (LOOCV). Specifically, data from N-1 participants were used to train the model, and the resulting trained model was then applied to predict the remaining participant’s symptom severity. This procedure was repeated N times to predict the pre-treatment symptom scores of all participants. Because each individualized functional connectome consists of thousands of connectivity values, we reduced the dimensionality of the input data by 1) calculating the correlations between symptom scores and functional connectivity values and then 2) selecting connections that showed a significant correlation (p<0.05, uncorrected) to symptom scores. We chose the lenient threshold of p<0.05 to avoid missing symptom-relevant connections in the model. The machine-learning algorithm determined which connections ultimately contributed to the prediction. Pearson correlations between the predicted and observed symptom scores were then used to measure the performance of the SVR algorithm in predicting symptom scores. To estimate YBOCS and DOCS scores, we used only pre-treatment data. To estimate changes in YBOCS or DOCS scores following treatment, we used differences in symptoms and connectivity values from baseline to follow-up visits.
To control for potential confounding factors, we included pre-treatment depression severity, measured by the HAM-D6, and mean relative in-scanner head motion as covariates in the SVR models for pre-treatment YBOCS and DOCS severity. In the SVR models assessing the association of changes in functional connections and changes in YBOCS and DOCS scores following treatment, covariates included pre-treatment HAM-D6, change in HAM-D6 between the two scans, mean head motion, between-scan differences in mean head motion, and duration of treatment.
The weight of each functional connection for symptom prediction was computed as the averaged weight across all LOOCV folds. If a connection was not selected in one fold, its weight was set to zero in this fold. The weight of a given ROI was then calculated by summing up the weights of all connections involving that ROI. The weight of a given ROI could be computed using cross-network connections or within-network connections. To generate the bar plots in Figures 2 and 4C, ROIs were grouped according to 7 well-studied canonical networks (23) and then the weight of each network was computed as the sum of weights of all ROIs falling within the network.
Figure 2. Pre-treatment global OCD symptom severity is associated with abnormal crosstalk between functional networks.
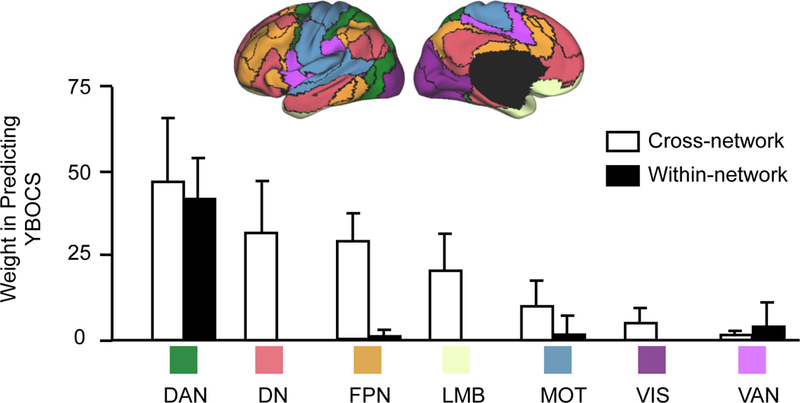
The 64 functional connections that are involved in the prediction of pre-treatment YBOCS scores are grouped according to the 7 well-studied networks (DN: default; VIS: visual; DAN: dorsal attention; MOT: motorsensory; VAN: ventral attention; FPN: frontoparietal; LMB: limbic). Connections contributing to pre-treatment YBOCS prediction are mainly cross-network connections (white bars). These cross-network connections involved regions in DAN, DN, FPN, and LMB. Only a few within-network connections (black bars) contributed to pre-treatment YBOCS prediction and mainly involved DAN. Error bars represent standard deviation.
Figure 4. Use of individualized functional connectome identifies discrete, non-overlapping cortical connectivity biomarkers of pre-treatment dimensional OCD symptom severity.
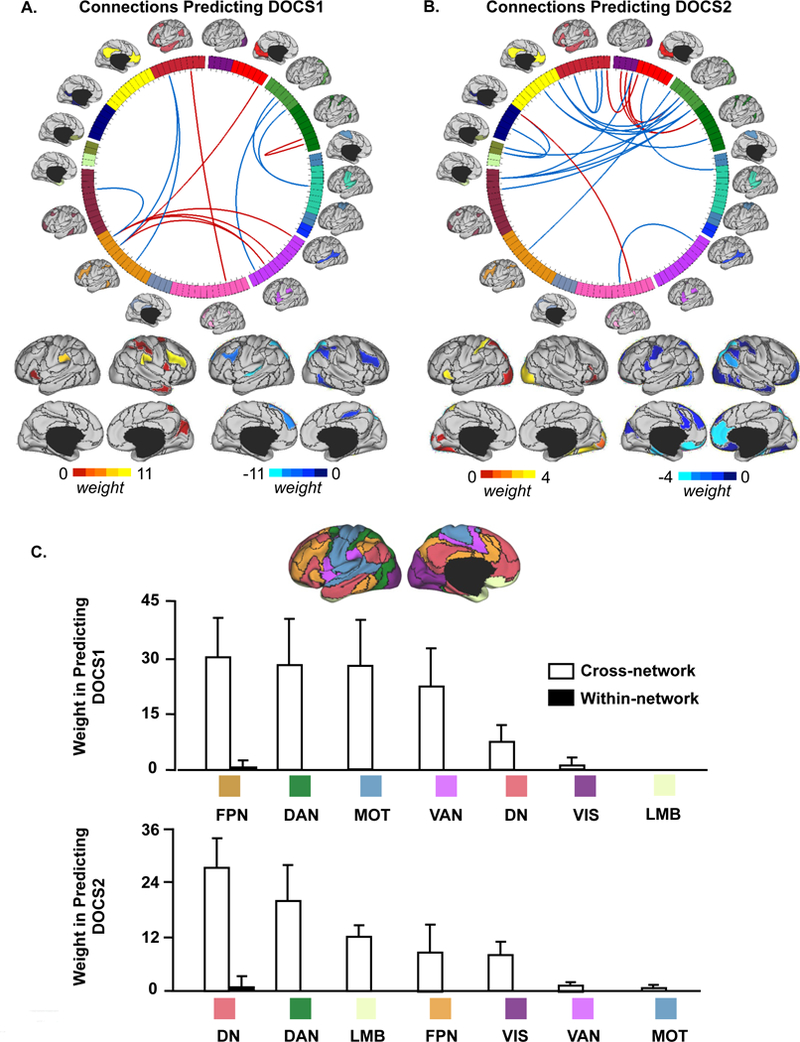
(A, B) Connections that are predictive of pre-treatment DOCS1 and DOCS2 scores are shown on the wheel. Functional regions involved in these connections are also rendered on the cortical surface. The predictive power of each region is color-coded. Connections positively correlated with DOCS scores are shown in red and connections negatively correlated with DOCS scores are shown in blue. (C) Pre-treatment DOCS1 and DOCS2 are both associated with abnormal crosstalk between functional networks. Functional connections that are involved in the prediction of pre-treatment DOCS1 scores are grouped according to the 7 networks (DN: default; VIS: visual; DAN: dorsal attention; MOT: motorsensory; VAN: ventral attention; FPN: frontoparietal; LMB: limbic). Connections contributing to the prediction of pre-treatment DOCS1 are mainly cross-network connections (white bars) involving regions in FPN, DAN, MOT, and VAN. Connections contributing to the prediction of pre-treatment DOCS2 are mainly cross-network connections involving regions in DN, DAN, and LMB. Error bars represent standard deviation.
Visualization
All imaging results were projected onto the inflated PALS cortical surface using CARET software. The connectograms in Figures 1, 4 and S3 were created using Circos (http://circos.ca/).
Figure 1. Individualized functional connectome predicts pre-treatment global OCD symptom severity and tracks change in symptom severity longitudinally.
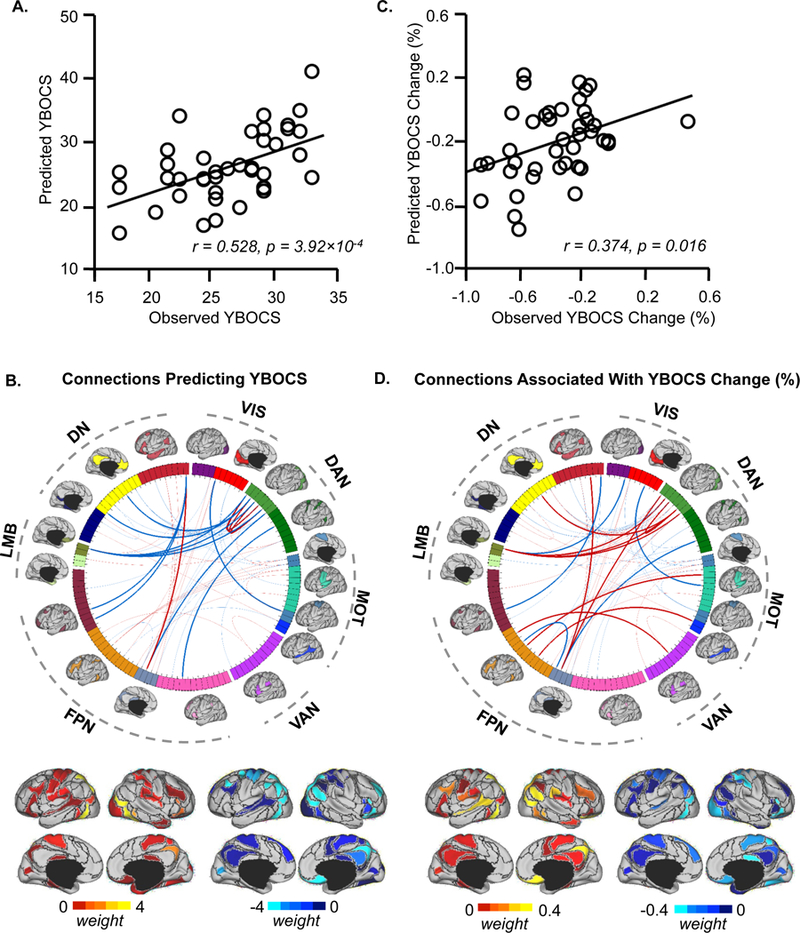
(A) The scatterplot illustrates the correlation (r = 0.528, p = 3.92 ×10 −4) between the pre-treatment YBOCS scores predicted by connectivity among the individually-specified ROIs and the scores actually observed in the 41 participants with OCD. Pre-treatment depression symptoms and head motion were controlled as covariates in the prediction. (B) 86 ROIs extracted from 18 individualized networks are represented on a wheel. ROIs are color-coded according to the 18 networks. Group-level maps of the 18 functional networks are shown on the cortical surface outside the wheel. ROIs derived from the 18 networks could be grouped according to 7 well-studied canonical networks(23) (DN: default; VIS: visual; DAN: dorsal attention; MOT: motorsensory; VAN: ventral attention; FPN: frontoparietal; LMB: limbic). Sixty-four connections (ROI pairs) were identified that contributed to the prediction of pre-treatment YBOCS scores. The fifteen connections contributing most strongly to the prediction of pre-treatment YBOCS scores are indicated by the dark lines in the wheel (transparent lines indicate other 49 connections; see Figure S2 for more details on these 15 ROI pairs). The predictive power of each connection is indicated by the “weight”, as color-coded on the cortical surface representations under the wheel. Connections positively correlated with YBOCS scores are shown in red and connections negatively correlated with YBOCS scores are shown in blue. (C) Connectivity among individually-specified functional regions tracks changes in global symptom severity longitudinally. Among the 64 connections that predicted pre-treatment global OCD symptom severity, functional connectivity changes after intensive residential treatment are associated with percent change of YBOCS scores (r = 0.374, p = 0.016). (D) The fifteen connections most strongly associated with YBOCS improvement are indicated by the dark lines in the wheel. Functional regions involved in these connections are also rendered on the cortical surface. Connections positively correlated with change in YBOCS scores are shown in red and connections negatively correlated with change in YBOCS scores are shown in blue.
Results
The individualized functional connectome can predict pre-treatment global OCD symptom severity and tracks its change longitudinally
Pre-treatment YBOCS scores predicted by the individualized connectome correlated significantly with participants’ actual YBOCS scores (r = 0.528, p<0.001, Figure 1A). Sixty-four connections contributed to predicting YBOCS scores, and each connection’s contribution was quantified by its “weight” in the SVR model (Figure 1B). The most predictive connections involved brain regions with previously demonstrated functional (24–28) and/or structural abnormalities (26, 29, 30) in OCD, including orbitofrontal cortex (OFC), ventrolateral prefrontal cortex (vlPFC), superior and inferior parietal lobules (SPL and IPL), and precuneus, together with other areas not previously implicated in OCD, including posterior temporal and parieto-occipital regions (Figure S2).
The pre-treatment individualized connectome failed to predict treatment response as measured by the YBOCS. However, changes in functional connectivity were significantly associated with change in YBOCS scores following treatment (r = 0.374, p = 0.016, Figure 1C). Connections most relevant to YBOCS improvement involved OFC, SPL, IPL, precuneus, mid-cingulate cortex, posterior temporal and parieto-occipital cortex, and to a lesser degree superior temporal cortex and vlPFC (Figure 1D).
For comparison, we repeated our initial analysis using the corresponding 86 ROIs extracted from a population-level functional network atlas. Functional connectivity among the atlas-based ROIs was comparable to the individualized connectome in predicting pre-treatment YBOCS scores (r = 0.484, p = 0.001; Figure S3B), but the specific connections identified in this analysis differed from those identified using the individualized connectome (Dice’s coefficient 0.44; Figure S3A). Notably, changes in atlas-based connections were not significantly associated with post-treatment changes in YBOCS (r = 0.177, p = 0.27; Figure S3C).
Pre-treatment global OCD symptom severity is associated with abnormal interactions between functional networks
Of the individual-specific connections that collectively predicted YBOCS scores, most represented connections between ROIs across different networks (Figures 1B & 1D). Interestingly, comparing cross-network connectivity estimated by individually-specified vs. atlas-based methods (Figure S4), we found that the strength of cross-network connectivity showed a mean decrease of 9.43% when ROIs were individually-specified versus atlas-based (p<0.001 for 17 of the 18 networks, paired t-test, Bonferroni correction for 18 comparisons). Nevertheless, the weaker cross-network connectivity using individually-specified ROIs was significantly associated with longitudinal change in OCD symptoms, suggesting that cross-network connectivity based on individually-specified ROIs was likely more specific than atlas-based connectivity.
To quantify the contribution of each functional region to the prediction of pre-treatment YBOCS scores, we summed the weights of predictive connections involving that region (see Methods). For visualization purposes, we further grouped ROIs according to the 7 canonical functional networks [visual (VIS), sensorimotor (MOT), dorsal attention (DAN), ventral attention (VAN), limbic (LMB), frontoparietal (FPN), and default (DN)] (23). The weights of cross-network and within-network connections were quantified separately. Connections contributing to YBOCS were mainly cross-network connections involving DAN, DN, FPN and to a lesser degree LMB (Figure 2). We found few within-network connections, primarily within DAN, that contributed to YBOCS prediction.
The individualized functional connectome can predict dimension-specific OCD symptom severity
Using the 86 individually-specified ROIs, the support vector machine identified 13 connections that collectively predicted pre-treatment DOCS1 scores (r = 0.333; p = 0.033, Figure 3A), and 23 that predicted pre-treatment DOCS2 scores (r = 0.337; p = 0.031, Figure 3B). However, connectivity analyses using the 86 atlas-based ROIs failed to predict either DOCS1 or DOCS2 (r = 0.053, p = 0.742, Figure 3C; r = −0.172, p = 0.282, Figure 3D). Functional connectivity using both individualized and atlas-based ROIs failed to predict DOCS3 and DOCS4 scores (Figure S5). As with YBOCS scores, we found that predictions of DOCS1 and DOCS2 were also driven primarily by cross-network connections (Figures 4A & 4B), with DOCS1 involving mainly regions in FPN, DAN, MOT, and VAN, and DOCS2 involving regions in DN, DAN and LMB (Figure 4C). Notably, connections associated with DOCS1 and DOCS2 showed no overlap, suggesting distinct connectivity footprints for these two symptom dimensions.
Figure 3. Functional connectivity among individually-specified ROIs can predict pre-treatment dimension-specific symptoms in OCD participants.
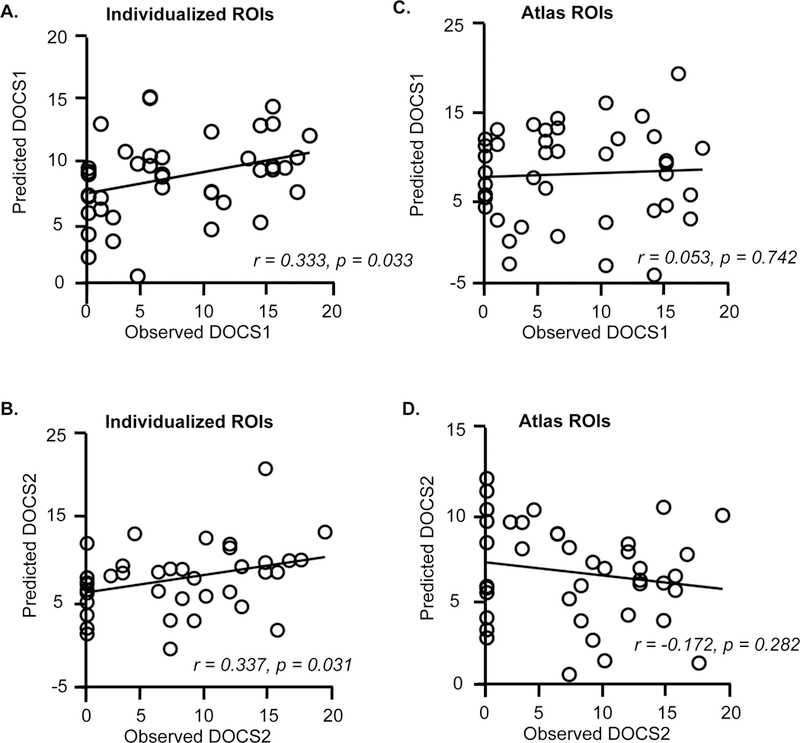
(A, B) The scatter plots demonstrate the correlation between the predicted and observed pre-treatment DOCS1 scores (r = 0.333; p = 0.033) and the correlation between the predicted and observed pre-treatment DOCS2 scores (r = 0.337, p = 0.031). (C, D) In contrast, connectivity among the atlas-based ROIs did not predict pre-treatment DOCS1 (r = 0.053, p = 0.742) or DOCS2 scores ( r = −0.172, p = 0.282).
Individualized functional connectome tracks dimension-specific OCD symptom severity longitudinally
Changes in the 13 connections shown to predict initial DOCS1 scores were significantly associated with DOCS1 improvement (r = 0.359, p = 0.021, Figure 5). However, changes in connections predicting DOCS2 scores were not significantly associated with improvement in DOCS2 (r = 0.217, p = 0.172).
Figure 5. Connectivity changes among individually-specified functional regions tracks changes in contamination/washing symptom severity longitudinally.
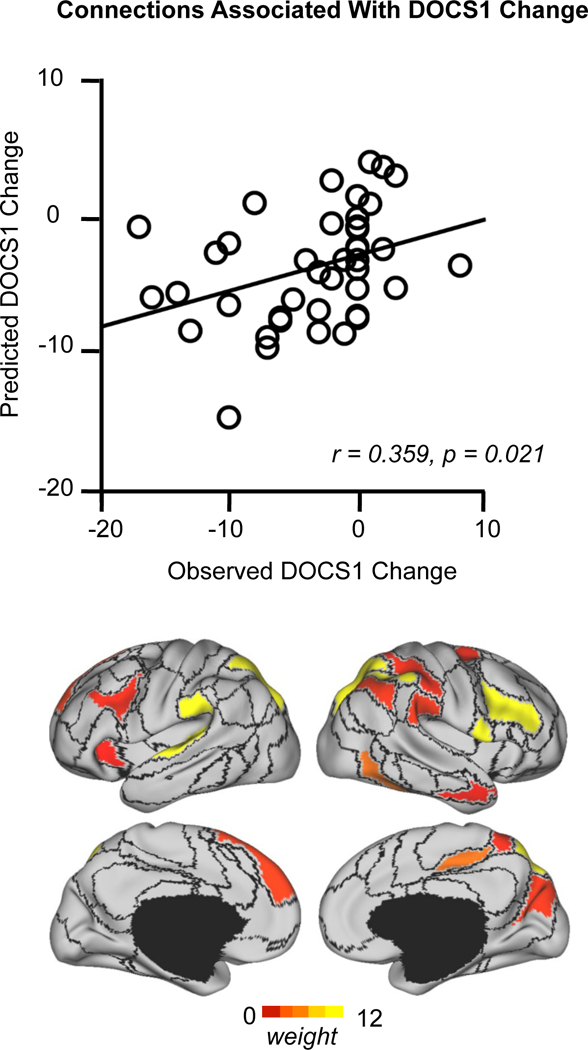
Functional connectivity changes within the 13 connections that are predictive of pre-treatment DOCS1 scores are associated with percent change in DOCS1 scores after treatment (r = 0.359, p = 0.021). The strength of association of each functional region involved in these connections is color-coded.
Discussion
Using individually-specified functional brain regions, we identified cortical connectivity biomarkers that significantly predicted pre-treatment YBOCS, DOCS1, and DOCS2 scores as well as connectivity changes within these biomarkers that were significantly associated with changes in YBOCS and DOCS1 scores following treatment. However, we were unable to identify a pre-treatment connectivity biomarker of treatment response, perhaps due to the variable, individually-tailored treatment strategies administered to different patients in intensive residential treatment. Collectively, these findings suggest that identification of subject-specific functional regions may reduce the “background noise” of atlas-based approaches, enabling identification of heretofore difficult-to-detect cortical connectivity biomarkers of dimensional symptom severity and improvement in OCD.
Cortical connectivity biomarker of global OCD symptoms
Some of the most strongly predictive connections in our connectivity biomarker of YBOCS severity involved the OFC – consistent with prior evidence implicating connectivity abnormalities in this brain region as a biomarker of global OCD symptom severity (3–5). However, many connections outside the traditional CSTC circuit also predicted YBOCS severity, including SPL, IPL and vlPFC, and an area of temporo-occipital cortex encompassing the middle temporal area (MT). These brain regions overlap with areas demonstrating reduced cortical thickness in a recent multi-site meta-analysis of OCD patients (30) and have shown abnormalities in prior OCD studies. For example, vlPFC has long been implicated in OCD, as illustrated by its role in response inhibition (31); hyperactivation with symptom provocation (32, 33); functional abnormalities when performing cognitive control tasks (34); and decreased grey matter (29, 35), white matter (36), and cortical thickness (30) in OCD patients. Similarly, IPL has evidenced white matter (37) and grey matter (38) abnormalities in OCD patients, but, in contrast to vlPFC, has demonstrated hypometabolism at rest (27, 39, 40) and hyperactivation with symptom provocation (33). Additional evidence exists for OCD-related structural abnormalities involving SPL (37, 41–43). While MT and occipital regions have not been considered to play a significant role in OCD, altered white matter connections linking parieto-temporo-occipital regions to areas in prefrontal cortex have been consistently demonstrated in OCD (37), and in one study (44) were associated with symptom severity. Additionally, increased functional connectivity within a similar middle temporal region bilaterally has been observed in OCD patients and their first-degree relatives (11) and reduced cortical thickness in this area has been associated with increased YBOCS scores (30). Overall, our connectivity biomarker, in conjunction with the findings presented above, further supports to the concept of OCD as a disorder of widespread brain dysfunction involving not just the classic CSTC circuit(s) but also cortical regions within temporal, parietal, and occipital lobes, as well as other sub-cortical structures – see various reviews (34, 35, 37, 45).
Abnormal crosstalk between functional networks in OCD
Examining our cortical connectivity biomarker from the perspective of the 7 canonical functional networks, OCD symptom severity was mainly predicted by connections involving DAN, DN, and FPN, with a minor contribution from LMB. With the exception of within-network connections involving DAN, overall OCD symptom severity was largely predicted by cross-network connections, suggesting that dysfunctional interactions between multiple high-order association networks precipitate OCD symptoms. This finding is particularly striking, given that use of individually-specified ROIs decreased the strength of cross-network connectivity compared to atlas-based ROIs.
Global OCD symptom severity was best predicted by both within- and cross-network connections involving DAN. Few rs-fcMRI studies in OCD have demonstrated abnormal DAN connectivity (11, 46, 47), perhaps due to the predominance of seed-based analyses targeting brain regions outside DAN. Indeed, two prior studies using data-driven approaches found abnormal connectivity in SPL (46) and MT (11) – DAN brain regions showing strong predictive value in our connectivity biomarker. Moreover, a recent study (48) found abnormal activation and connectivity of occipital regions within DAN in OCD patients compared to controls when switching internally and externally focused attention. Another study (49) found increased activation in multiple DAN regions, including middle-temporal and fusiform gyrus, in OCD patients during a biological motion task – a finding consistent with evidence of poor performance on similar tasks in OCD (50). More generally, in neuropsychological studies (51), individuals with OCD have demonstrated visuospatial attention deficits involving difficulties in perceiving and manipulating complex visual information. Although some have questioned the significance of these effects (52), the above findings invite further investigation into DAN dysfunction in OCD.
Consistent with several prior studies demonstrating connectivity abnormalities involving both DN and FPN in OCD (11, 42, 47, 53–56), cross-network connections involving DN, FPN, and DAN contributed heavily to our biomarker of YBOCS severity. The DN has been shown to mediate self-referential thinking and introspection, and its component regions activate during these activities (57), whereas regions within the DAN regulate attention to external stimuli and normally activate during externally focused tasks (58). The FPN may intermediate between DN and DAN by coupling with either network to maintain the dynamic balance necessary to shift between internally and externally directed cognition (IDC and EDC), allowing for adaptive cognitive functioning (59). Thus, abnormal interactions between DN, FPN, and DAN could disrupt the balance between IDC and EDC, producing cognitive and behavioral dysfunction such as a failure to disengage DN, potentially causing unrestrained IDC including self-generated thoughts and overestimation of threat (47, 60).
Cross-network connections involving LMB, particularly connections between OFC and multiple DAN regions, also contributed to our biomarker of YBOCS severity, consistent with the literature documenting abnormal OFC connectivity in OCD (3–5, 11, 12, 53, 61–64). However, most, but not all (11, 12, 61, 64), of these studies employed pre-defined seed ROIs within the CSTC circuit, most frequently within striatum, hence possibly missing connectivity abnormalities between unforeseen brain regions. By contrast, our whole-brain, data- driven, subject-specific approach identified more diffuse connectivity abnormalities between OFC and non-CSTC regions, especially multiple regions within DAN, potentially important in OCD.
Cortical connectivity biomarkers of dimension-specific OCD symptoms
While OCD is widely acknowledged to be a heterogeneous disorder comprising empirically-supported symptom dimensions (65), it is unclear how these dimensions differ neurobiologically. We identified distinct cortical connectivity biomarkers that predicted the severity of contamination/washing (DOCS1) and responsibility for harm/checking (DOCS2) symptoms.
DOCS1 scores were most strongly predicted by connections involving SPL, dorsolateral prefrontal cortex (dlPFC), superior temporal gyrus (STG), and to a lesser degree temporoparietal junction (TPJ), vlPFC/anterior insula (AI), and dorsomedial prefrontal cortex (dmPFC). Notably, pre-post change in the connectivity of these same regions significantly predicted change in DOCS1 scores. Several of these regions, including vlPFC/AI, STG, and fusiform/lingual gyrus, have demonstrated abnormal activation to washing-related stimuli (66, 67), disgusting pictures (68), and facial expressions of disgust (69) in OCD patients with predominant contamination symptoms.
DOCS2 scores were best predicted by connections between DN, DAN, and LMB, primarily involving OFC, ventromedial PFC (vmPFC), and SPL. The only other large-scale study to examine dimension-specific connectivity abnormalities in OCD found an association between harm obsessions and increased connectivity between ventral caudate and vmPFC (3) – a region strongly implicated in our DOCS2 biomarker. Prior studies have implicated vmPFC in fear learning (70), and abnormal activation in this region has been associated with impairments in both extinction learning and the ability to assign safety to environmental stimuli (so-called “safety signaling”) in OCD patients (71, 72). Deficiencies in such processes might contribute substantially to harm-related obsessions in OCD. Additionally, both vmPFC and OFC have been implicated in experiencing guilt (73), and OCD patients demonstrate hyperactivity in these regions when performing a moral dilemma task (74). This is particularly pertinent for harm-related OCD, which may be uniquely associated with greater guilt sensitivity (75). Notably, abnormal connections involving other DN brain regions, including posterior IPL, parahippocampal gyri, dmPFC, and vlPFC, also predicted DOCS2 severity, suggesting that widespread disruption in DN connectivity may underlie harm-related obsessions.
Our finding of discrete cortical networks underlying contamination/washing and harm/checking symptoms raises the question of how to understand these findings in the context of the existing model of CSTC circuit dysfunction in OCD. For example, OFC connectivity, which has been shown to be associated with YBOCS severity in several prior studies (3–5), similarly predicted global OCD symptom severity in our sample, but not contamination/washing symptoms specifically. However, this finding accords with the only other study to examine dimension-specific connectivity abnormalities in a large sample of OCD patients (3), which also found no association between CSTC connections and contamination/washing symptoms, suggesting that the neural substrates underlying these symptoms may lie outside the CSTC circuit. Notably, 37 (90%) of the patients in our sample reported symptoms in multiple dimensions, with 29 (71%) reporting symptoms in 3 or 4 dimensions. As such, the functional connections identified in our biomarker of YBOCS severity are difficult to interpret, as they largely reflect the confluence of multiple coexisting symptom dimensions. Lastly, because our individual-level approach at this point has only been developed to examine cortical connectivity, we could not examine dimension-specific striatal connectivity in this study, precluding any definitive testing of the CSTC model. Future studies using our individual-level approach, adapted to examine both cortical and subcortical connectivity in a larger sample of OCD patients, and sufficiently powered to detect connections predictive of all four symptom dimensions, will be needed to more thoroughly understand our findings in the context of the current CSTC model of OCD.
Limitations
We acknowledge several study limitations. First, our participants with severe, treatment-resistant OCD may not be representative of general-population OCD patients. However, despite possible biological differences between our subgroup and “typical” OCD patients, the core underlying network abnormalities are likely similar, and indeed might be more readily detectable in our more symptomatic OCD population. Second, our participants were receiving both pharmacotherapy and psychotherapy, which may impact connectivity (61), and limits our ability to isolate the treatment(s) responsible for the clinical improvement found associated with our connectivity biomarkers. Third, many of our participants had comorbid psychiatric disorders, particularly depression, limiting our ability to assess functional connectivity abnormalities specific to OCD. However, adjustment for depression severity in our analytical models likely mitigated any substantial effect of depression on our findings. Fourth, our analyses relied on “consensus ROIs” that were identified in all participants. Some ROIs may have been absent in select individuals due to variability in functional organization or because smaller ROIs may have merged with neighboring larger ROIs – particularly in participants with poor SNR. An ROI was excluded if it was absent even in a single participant, potentially excluding important functional information from our analyses. However, this concern is lessened by the fact that the 86 consensus ROIs in our data covered most of the cortical area (91.7% ± 1.6%) and included regions from all 18 functional networks. Fifth, a reliable technique for mapping functional networks in individual participants’ subcortical regions is not yet available, precluding our ability to investigate sub-cortical connectivity in this study. However, we plan to adapt our individual-level approach to examine cortico-striatal connectivity in future studies, given the pivotal role of these circuits in OCD. Finally, we used a self-administered version of the YBOCS rather than the standard clinician-administered version. Although the two versions have been shown to be highly correlated (20), we cannot completely exclude the possibility of response bias.
Conclusions
Using a novel individual-level approach, we identified: 1) a cortical connectivity biomarker that robustly predicted global OCD symptom severity, together with a set of connections within this biomarker that changed in association with clinical improvement following intensive residential treatment; 2) distinct, non-overlapping, cortical connectivity biomarkers of symptom severity for the contamination/washing and responsibility for harm/checking dimensions of OCD; and 3) a set of cortical connections that changed in association with improvement in contamination/washing symptoms following intensive residential treatment. In contrast, a traditional atlas-based approach identified a dissimilar cortical connectivity biomarker that comparably predicted overall symptom severity, but failed to predict dimension-specific severity. Important next steps are to extend this approach to include sub-cortical territories, and to examine larger, ideally unmedicated, cohorts in an effort to replicate and expand our dimension-specific findings. This would provide a more fine-grained understanding of OCD neurobiology and might help pinpoint the optimal cortical sites for non-invasive neuromodulatory approaches based on symptom dimensions – an essential step toward the development of much-needed personalized therapeutics for individuals with OCD.
Supplementary Material
Acknowledgments
This study was funded by grants K23-MH092397 (Dr. Brennan) and K23-MH104515 (Dr. Baker) from the National Institute of Mental Health and the David Judah Fund at the Massachusetts General Hospital. Dr. Liu was supported by NIH grants 1R01NS091604, P50MH106435, Beijing Municipal Science & Technology Commission No. Z161100002616009, and National Natural Science Foundation of China grants No. 81790652. We acknowledge Brittany Mathes, BA, Lauryn Garner, BA, and Eric Tifft, BA who assisted with participant recruitment and clinical assessment.
Dr. Brennan has received consulting fees from Rugen Therapeutics and Nobilis Therapeutics and research grant support from Eli Lilly, Transcept Pharmaceuticals, and Biohaven Pharmaceuticals. Dr. Pope has received consulting fees from Pronutria and research grant support from Genentech, Shire, and Sunovion. Dr. Rauch has received research funding from NIMH and the US Army and royalties from APPI and Oxford University Press. He further receives honoraria for advisory board service from the Harvard Football Players Health Study. He is employed by, and receives salary from, McLean Hospital/Partners Healthcare. Dr. Rauch also holds leadership roles with the SOBP, APA, NNDC and ADAA. Dr. Baker has received research support from the NIMH and Valera Health.
Footnotes
Publisher's Disclaimer: This is a PDF file of an unedited manuscript that has been accepted for publication. As a service to our customers we are providing this early version of the manuscript. The manuscript will undergo copyediting, typesetting, and review of the resulting proof before it is published in its final form. Please note that during the production process errors may be discovered which could affect the content, and all legal disclaimers that apply to the journal pertain.
Financial Disclosures
All other authors report no biomedical financial interests or potential conflicts of interest.
References
- 1.Ruscio AM, Stein DJ, Chiu WT, and Kessler RC. (2010): The epidemiology of obsessive-compulsive disorder in the National Comorbidity Survey Replication. Mol Psychiatry 15: 53–63. [DOI] [PMC free article] [PubMed] [Google Scholar]
- 2.Meier SM, Mattheisen M, Mors O, Schendel DE, Mortensen PB, and Plessen KJ. (2016): Mortality Among Persons With Obsessive-Compulsive Disorder in Denmark. JAMA Psychiatry 73: 268–74. [DOI] [PMC free article] [PubMed] [Google Scholar]
- 3.Harrison BJ, Pujol J, Cardoner N, Deus J, Alonso P, Lopez-Sola M, et al. (2013): Brain corticostriatal systems and the major clinical symptom dimensions of obsessive-compulsive disorder. Biol Psychiatry 73: 321–8. [DOI] [PubMed] [Google Scholar]
- 4.Harrison BJ, Soriano-Mas C, Pujol J, Ortiz H, Lopez-Sola M, Hernandez-Ribas R, et al. (2009): Altered corticostriatal functional connectivity in obsessive-compulsive disorder. Arch Gen Psychiatry 66: 1189–200. [DOI] [PubMed] [Google Scholar]
- 5.Posner J, Marsh R, Maia TV, Peterson BS, Gruber A, and Simpson HB. (2014): Reduced functional connectivity within the limbic cortico-striato-thalamo-cortical loop in unmedicated adults with obsessive-compulsive disorder. Hum Brain Mapp 35: 2852–60. [DOI] [PMC free article] [PubMed] [Google Scholar]
- 6.Fitzgerald KD, Liu Y, Stern ER, Welsh RC, Hanna GL, Monk CS, et al. (2013): Reduced error-related activation of dorsolateral prefrontal cortex across pediatric anxiety disorders. J Am Acad Child Adolesc Psychiatry 52: 1183–1191 e1. [DOI] [PMC free article] [PubMed] [Google Scholar]
- 7.Sakai Y, Narumoto J, Nishida S, Nakamae T, Yamada K, Nishimura T, et al. (2011): Corticostriatal functional connectivity in non-medicated patients with obsessive-compulsive disorder. Eur Psychiatry 26: 463–9. [DOI] [PubMed] [Google Scholar]
- 8.Bernstein GA, Mueller BA, Schreiner MW, Campbell SM, Regan EK, Nelson PM, et al. (2016): Abnormal striatal resting-state functional connectivity in adolescents with obsessive-compulsive disorder. Psychiatry Res 247: 49–56. [DOI] [PMC free article] [PubMed] [Google Scholar]
- 9.Anticevic A, Hu S, Zhang S, Savic A, Billingslea E, Wasylink S, et al. (2014): Global resting-state functional magnetic resonance imaging analysis identifies frontal cortex, striatal, and cerebellar dysconnectivity in obsessive-compulsive disorder. Biol Psychiatry 75: 595–605. [DOI] [PMC free article] [PubMed] [Google Scholar]
- 10.Chen Y, Juhas M, Greenshaw AJ, Hu Q, Meng X, Cui H, et al. (2016): Abnormal resting-state functional connectivity of the left caudate nucleus in obsessive-compulsive disorder. Neurosci Lett 623: 57–62. [DOI] [PubMed] [Google Scholar]
- 11.Hou JM, Zhao M, Zhang W, Song LH, Wu WJ, Wang J, et al. (2014): Resting-state functional connectivity abnormalities in patients with obsessive-compulsive disorder and their healthy first-degree relatives. J Psychiatry Neurosci 39: 304–11. [DOI] [PMC free article] [PubMed] [Google Scholar]
- 12.Tian L, Meng C, Jiang Y, Tang Q, Wang S, Xie X, et al. (2016): Abnormal functional connectivity of brain network hubs associated with symptom severity in treatment-naive patients with obsessive-compulsive disorder: A resting-state functional MRI study. Prog Neuropsychopharmacol Biol Psychiatry 66: 104–11. [DOI] [PubMed] [Google Scholar]
- 13.Mueller S, Wang D, Fox MD, Yeo BT, Sepulcre J, Sabuncu MR, et al. (2013): Individual variability in functional connectivity architecture of the human brain. Neuron 77: 586–95. [DOI] [PMC free article] [PubMed] [Google Scholar]
- 14.Langs G, Wang D, Golland P, Mueller S, Pan R, Sabuncu MR, et al. (2015): Identifying Shared Brain Networks in Individuals by Decoupling Functional and Anatomical Variability. Cereb Cortex [DOI] [PMC free article] [PubMed]
- 15.Wang D, Buckner RL, Fox MD, Holt DJ, Holmes AJ, Stoecklein S, et al. (2015): Parcellating cortical functional networks in individuals. Nat Neurosci 18: 1853–60. [DOI] [PMC free article] [PubMed] [Google Scholar]
- 16.Fox MD, Qian T, Madsen JR, Wang D, Li M, Ge M, et al. (2016): Combining task-evoked and spontaneous activity to improve pre-operative brain mapping with fMRI. Neuroimage 124: 714–23. [DOI] [PMC free article] [PubMed] [Google Scholar]
- 17.Goodman WK, Price LH, Rasmussen SA, Mazure C, Fleischmann RL, Hill CL, et al. (1989): The Yale-Brown Obsessive Compulsive Scale. I. Development, use, and reliability. Arch Gen Psychiatry 46: 1006–11. [DOI] [PubMed] [Google Scholar]
- 18.Abramowitz JS, Deacon BJ, Olatunji BO, Wheaton MG, Berman NC, Losardo D, et al. (2010): Assessment of obsessive-compulsive symptom dimensions: development and evaluation of the Dimensional Obsessive-Compulsive Scale. Psychol Assess 22: 180–98. [DOI] [PubMed] [Google Scholar]
- 19.Bech P, Wilson P, Wessel T, Lunde M, and Fava M (2009): A validation analysis of two self-reported HAM-D6 versions. Acta Psychiatr Scand 119: 298–303. [DOI] [PubMed] [Google Scholar]
- 20.Federici A, Summerfeldt LJ, Harrington JL, McCabe RE, Purdon CL, Rowa K, et al. (2010): Consistency between self-report and clinician-administered versions of the Yale-Brown Obsessive-Compulsive Scale. J Anxiety Disord 24: 729–33. [DOI] [PubMed] [Google Scholar]
- 21.van der Kouwe AJ, Benner T, Salat DH, and Fischl B (2008): Brain morphometry with multiecho MPRAGE. Neuroimage 40: 559–69. [DOI] [PMC free article] [PubMed] [Google Scholar]
- 22.Buckner RL, Krienen FM, Castellanos A, Diaz JC, and Yeo BT. (2011): The organization of the human cerebellum estimated by intrinsic functional connectivity. J Neurophysiol 106: 2322–45. [DOI] [PMC free article] [PubMed] [Google Scholar]
- 23.Yeo BT, Krienen FM, Sepulcre J, Sabuncu MR, Lashkari D, Hollinshead M, et al. (2011): The organization of the human cerebral cortex estimated by intrinsic functional connectivity. J Neurophysiol 106: 1125–65. [DOI] [PMC free article] [PubMed] [Google Scholar]
- 24.Baxter LR Jr., Phelps ME, Mazziotta JC, Guze BH, Schwartz JM, and Selin CE. (1987): Local cerebral glucose metabolic rates in obsessive-compulsive disorder. A comparison with rates in unipolar depression and in normal controls. Arch Gen Psychiatry 44: 211–8. [DOI] [PubMed] [Google Scholar]
- 25.Baxter LR Jr., Schwartz JM, Mazziotta JC, Phelps ME, Pahl JJ, Guze BH, et al. (1988): Cerebral glucose metabolic rates in nondepressed patients with obsessive-compulsive disorder. Am J Psychiatry 145: 1560–3. [DOI] [PubMed] [Google Scholar]
- 26.Menzies L, Achard S, Chamberlain SR, Fineberg N, Chen CH, del Campo N, et al. (2007): Neurocognitive endophenotypes of obsessive-compulsive disorder. Brain 130: 3223–36. [DOI] [PubMed] [Google Scholar]
- 27.Nordahl TE, Benkelfat C, Semple WE, Gross M, King AC, and Cohen RM. (1989): Cerebral glucose metabolic rates in obsessive compulsive disorder. Neuropsychopharmacology 2: 23–8. [DOI] [PubMed] [Google Scholar]
- 28.Swedo SE, Schapiro MB, Grady CL, Cheslow DL, Leonard HL, Kumar A, et al. (1989): Cerebral glucose metabolism in childhood-onset obsessive-compulsive disorder. Arch Gen Psychiatry 46: 518–23. [DOI] [PubMed] [Google Scholar]
- 29.de Wit SJ, Alonso P, Schweren L, Mataix-Cols D, Lochner C, Menchon JM, et al. (2014): Multicenter voxel-based morphometry mega-analysis of structural brain scans in obsessive-compulsive disorder. Am J Psychiatry 171: 340–9. [DOI] [PubMed] [Google Scholar]
- 30.Fouche JP, du Plessis S, Hattingh C, Roos A, Lochner C, Soriano-Mas C, et al. (2017): Cortical thickness in obsessive-compulsive disorder: multisite mega-analysis of 780 brain scans from six centres. Br J Psychiatry 210: 67–74. [DOI] [PubMed] [Google Scholar]
- 31.Aron AR, Robbins TW, and Poldrack RA. (2004): Inhibition and the right inferior frontal cortex. Trends Cogn Sci 8: 170–7. [DOI] [PubMed] [Google Scholar]
- 32.Breiter HC, Rauch SL, Kwong KK, Baker JR, Weisskoff RM, Kennedy DN, et al. (1996): Functional magnetic resonance imaging of symptom provocation in obsessive-compulsive disorder. Arch Gen Psychiatry 53: 595–606. [DOI] [PubMed] [Google Scholar]
- 33.McGuire PK, Bench CJ, Frith CD, Marks IM, Frackowiak RS, and Dolan RJ. (1994): Functional anatomy of obsessive-compulsive phenomena. Br J Psychiatry 164: 459–68. [DOI] [PubMed] [Google Scholar]
- 34.Menzies L, Chamberlain SR, Laird AR, Thelen SM, Sahakian BJ, and Bullmore ET. (2008): Integrating evidence from neuroimaging and neuropsychological studies of obsessive-compulsive disorder: the orbitofronto-striatal model revisited. Neurosci Biobehav Rev 32: 525–49. [DOI] [PMC free article] [PubMed] [Google Scholar]
- 35.Piras F, Piras F, Chiapponi C, Girardi P, Caltagirone C, and Spalletta G (2015): Widespread structural brain changes in OCD: a systematic review of voxel-based morphometry studies. Cortex 62: 89–108. [DOI] [PubMed] [Google Scholar]
- 36.Goncalves OF, Sousa S, Maia L, Carvalho S, Leite J, Ganho A, et al. (2015): Inferior frontal gyrus white matter abnormalities in obsessive-compulsive disorder. Neuroreport 26: 495–500. [DOI] [PubMed] [Google Scholar]
- 37.Piras F, Piras F, Caltagirone C, and Spalletta G (2013): Brain circuitries of obsessive compulsive disorder: a systematic review and meta-analysis of diffusion tensor imaging studies. Neurosci Biobehav Rev 37: 2856–77. [DOI] [PubMed] [Google Scholar]
- 38.Rotge JY, Langbour N, Guehl D, Bioulac B, Jaafari N, Allard M, et al. (2010): Gray matter alterations in obsessive-compulsive disorder: an anatomic likelihood estimation meta-analysis. Neuropsychopharmacology 35: 686–91. [DOI] [PMC free article] [PubMed] [Google Scholar]
- 39.Kwon JS, Kim JJ, Lee DW, Lee JS, Lee DS, Kim MS, et al. (2003): Neural correlates of clinical symptoms and cognitive dysfunctions in obsessive-compulsive disorder. Psychiatry Res 122: 37–47. [DOI] [PubMed] [Google Scholar]
- 40.Lucey JV, Costa DC, Blanes T, Busatto GF, Pilowsky LS, Takei N, et al. (1995): Regional cerebral blood flow in obsessive-compulsive disordered patients at rest. Differential correlates with obsessive-compulsive and anxious-avoidant dimensions. Br J Psychiatry 167: 629–34. [DOI] [PubMed] [Google Scholar]
- 41.Carmona S, Bassas N, Rovira M, Gispert JD, Soliva JC, Prado M, et al. (2007): Pediatric OCD structural brain deficits in conflict monitoring circuits: a voxel-based morphometry study. Neurosci Lett 421: 218–23. [DOI] [PubMed] [Google Scholar]
- 42.Peng ZW, Xu T, He QH, Shi CZ, Wei Z, Miao GD, et al. (2014): Default network connectivity as a vulnerability marker for obsessive compulsive disorder. Psychol Med 44: 1475–84. [DOI] [PubMed] [Google Scholar]
- 43.Tan L, Fan Q, You C, Wang J, Dong Z, Wang X, et al. (2013): Structural changes in the gray matter of unmedicated patients with obsessive-compulsive disorder: a voxel-based morphometric study. Neurosci Bull 29: 642–8. [DOI] [PMC free article] [PubMed] [Google Scholar]
- 44.Garibotto V, Scifo P, Gorini A, Alonso CR, Brambati S, Bellodi L, et al. (2010): Disorganization of anatomical connectivity in obsessive compulsive disorder: a multi-parameter diffusion tensor imaging study in a subpopulation of patients. Neurobiol Dis 37: 468–76. [DOI] [PubMed] [Google Scholar]
- 45.Milad MR and Rauch SL. (2012): Obsessive-compulsive disorder: beyond segregated cortico-striatal pathways. Trends Cogn Sci 16: 43–51. [DOI] [PMC free article] [PubMed] [Google Scholar]
- 46.Gottlich M, Kramer UM, Kordon A, Hohagen F, and Zurowski B (2015): Resting-state connectivity of the amygdala predicts response to cognitive behavioral therapy in obsessive compulsive disorder. Biol Psychol 111: 100–9. [DOI] [PubMed] [Google Scholar]
- 47.Beucke JC, Sepulcre J, Eldaief MC, Sebold M, Kathmann N, and Kaufmann C (2014): Default mode network subsystem alterations in obsessive-compulsive disorder. Br J Psychiatry 205: 376–82. [DOI] [PubMed] [Google Scholar]
- 48.Stern ER, Muratore AF, Taylor SF, Abelson JL, Hof PR, and Goodman WK. (2017): Switching between internally and externally focused attention in obsessive-compulsive disorder: Abnormal visual cortex activation and connectivity. Psychiatry Res 265: 87–97. [DOI] [PMC free article] [PubMed] [Google Scholar]
- 49.Jung WH, Gu BM, Kang DH, Park JY, Yoo SY, Choi CH, et al. (2009): BOLD response during visual perception of biological motion in obsessive-compulsive disorder : an fMRI study using the dynamic point-light animation paradigm. Eur Arch Psychiatry Clin Neurosci 259: 46–54. [DOI] [PubMed] [Google Scholar]
- 50.Kim J, Blake R, Park S, Shin YW, Kang DH, and Kwon JS. (2008): Selective impairment in visual perception of biological motion in obsessive-compulsive disorder. Depress Anxiety 25: E15–25. [DOI] [PubMed] [Google Scholar]
- 51.Rampacher F, Lennertz L, Vogeley A, Schulze-Rauschenbach S, Kathmann N, Falkai P, et al. (2010): Evidence for specific cognitive deficits in visual information processing in patients with OCD compared to patients with unipolar depression. Prog Neuropsychopharmacol Biol Psychiatry 34: 984–91. [DOI] [PubMed] [Google Scholar]
- 52.Abramovitch A, Abramowitz JS, and Mittelman A (2013): The neuropsychology of adult obsessive-compulsive disorder: a meta-analysis. Clin Psychol Rev 33: 1163–71. [DOI] [PubMed] [Google Scholar]
- 53.Fitzgerald KD, Stern ER, Angstadt M, Nicholson-Muth KC, Maynor MR, Welsh RC, et al. (2010): Altered function and connectivity of the medial frontal cortex in pediatric obsessive-compulsive disorder. Biol Psychiatry 68: 1039–47. [DOI] [PMC free article] [PubMed] [Google Scholar]
- 54.Jang JH, Kim JH, Jung WH, Choi JS, Jung MH, Lee JM, et al. (2010): Functional connectivity in fronto-subcortical circuitry during the resting state in obsessive-compulsive disorder. Neurosci Lett 474: 158–62. [DOI] [PubMed] [Google Scholar]
- 55.Posner J, Song I, Lee S, Rodriguez CI, Moore H, Marsh R, et al. (2016): Increased functional connectivity between the default mode and salience networks in unmedicated adults with obsessive-compulsive disorder. Hum Brain Mapp [DOI] [PMC free article] [PubMed]
- 56.Stern ER, Fitzgerald KD, Welsh RC, Abelson JL, and Taylor SF. (2012): Resting-state functional connectivity between fronto-parietal and default mode networks in obsessive-compulsive disorder. PLoS One 7: e36356. [DOI] [PMC free article] [PubMed] [Google Scholar]
- 57.Buckner RL, Andrews-Hanna JR, and Schacter DL. (2008): The brain’s default network: anatomy, function, and relevance to disease. Ann N Y Acad Sci 1124: 1–38. [DOI] [PubMed] [Google Scholar]
- 58.Fox MD, Snyder AZ, Vincent JL, Corbetta M, Van Essen DC, and Raichle ME. (2005): The human brain is intrinsically organized into dynamic, anticorrelated functional networks. Proc Natl Acad Sci U S A 102: 9673–8. [DOI] [PMC free article] [PubMed] [Google Scholar]
- 59.Spreng RN, Stevens WD, Chamberlain JP, Gilmore AW, and Schacter DL. (2010): Default network activity, coupled with the frontoparietal control network, supports goal-directed cognition. Neuroimage 53: 303–17. [DOI] [PMC free article] [PubMed] [Google Scholar]
- 60.Stern ER and Taylor SF. (2014): Cognitive neuroscience of obsessive-compulsive disorder. Psychiatr Clin North Am 37: 337–52. [DOI] [PubMed] [Google Scholar]
- 61.Beucke JC, Sepulcre J, Talukdar T, Linnman C, Zschenderlein K, Endrass T, et al. (2013): Abnormally high degree connectivity of the orbitofrontal cortex in obsessive-compulsive disorder. JAMA Psychiatry 70: 619–29. [DOI] [PubMed] [Google Scholar]
- 62.Hou J, Song L, Zhang W, Wu W, Wang J, Zhou D, et al. (2013): Morphologic and functional connectivity alterations of corticostriatal and default mode network in treatment-naive patients with obsessive-compulsive disorder. PLoS One 8: e83931. [DOI] [PMC free article] [PubMed] [Google Scholar]
- 63.Jung WH, Yucel M, Yun JY, Yoon YB, Cho KI, Parkes L, et al. (2017): Altered functional network architecture in orbitofronto-striato-thalamic circuit of unmedicated patients with obsessive-compulsive disorder. Hum Brain Mapp 38: 109–119. [DOI] [PMC free article] [PubMed] [Google Scholar]
- 64.Gottlich M, Kramer UM, Kordon A, Hohagen F, and Zurowski B (2014): Decreased limbic and increased fronto-parietal connectivity in unmedicated patients with obsessive-compulsive disorder. Hum Brain Mapp 35: 5617–32. [DOI] [PMC free article] [PubMed] [Google Scholar]
- 65.Bloch MH, Landeros-Weisenberger A, Rosario MC, Pittenger C, and Leckman JF. (2008): Meta-analysis of the symptom structure of obsessive-compulsive disorder. Am J Psychiatry 165: 1532–42. [DOI] [PMC free article] [PubMed] [Google Scholar]
- 66.Mataix-Cols D, Wooderson S, Lawrence N, Brammer MJ, Speckens A, and Phillips ML. (2004): Distinct neural correlates of washing, checking, and hoarding symptom dimensions in obsessive-compulsive disorder. Arch Gen Psychiatry 61: 564–76. [DOI] [PubMed] [Google Scholar]
- 67.Phillips ML, Marks IM, Senior C, Lythgoe D, O’Dwyer AM, Meehan O, et al. (2000): A differential neural response in obsessive-compulsive disorder patients with washing compared with checking symptoms to disgust. Psychol Med 30: 1037–50. [DOI] [PubMed] [Google Scholar]
- 68.Shapira NA, Liu Y, He AG, Bradley MM, Lessig MC, James GA, et al. (2003): Brain activation by disgust-inducing pictures in obsessive-compulsive disorder. Biol Psychiatry 54: 751–6. [DOI] [PubMed] [Google Scholar]
- 69.Lawrence NS, An SK, Mataix-Cols D, Ruths F, Speckens A, and Phillips ML. (2007): Neural responses to facial expressions of disgust but not fear are modulated by washing symptoms in OCD. Biol Psychiatry 61: 1072–80. [DOI] [PubMed] [Google Scholar]
- 70.Milad MR, Wright CI, Orr SP, Pitman RK, Quirk GJ, and Rauch SL. (2007): Recall of fear extinction in humans activates the ventromedial prefrontal cortex and hippocampus in concert. Biol Psychiatry 62: 446–54. [DOI] [PubMed] [Google Scholar]
- 71.Apergis-Schoute AM, Gillan CM, Fineberg NA, Fernandez-Egea E, Sahakian BJ, and Robbins TW. (2017): Neural basis of impaired safety signaling in Obsessive Compulsive Disorder. Proc Natl Acad Sci U S A 114: 3216–3221. [DOI] [PMC free article] [PubMed] [Google Scholar]
- 72.Milad MR, Furtak SC, Greenberg JL, Keshaviah A, Im JJ, Falkenstein MJ, et al. (2013): Deficits in conditioned fear extinction in obsessive-compulsive disorder and neurobiological changes in the fear circuit. JAMA Psychiatry 70: 608–18; quiz 554. [DOI] [PubMed] [Google Scholar]
- 73.Young L and Koenigs M (2007): Investigating emotion in moral cognition: a review of evidence from functional neuroimaging and neuropsychology. Br Med Bull 84: 69–79. [DOI] [PubMed] [Google Scholar]
- 74.Harrison BJ, Pujol J, Soriano-Mas C, Hernandez-Ribas R, Lopez-Sola M, Ortiz H, et al. (2012): Neural correlates of moral sensitivity in obsessive-compulsive disorder. Arch Gen Psychiatry 69: 741–9. [DOI] [PubMed] [Google Scholar]
- 75.Melli G, Carraresi C, Poli A, Marazziti D, and Pinto A (2017): The role of guilt sensitivity in OCD symptom dimensions. Clin Psychol Psychother 24: 1079 – 1089. [DOI] [PubMed] [Google Scholar]
Associated Data
This section collects any data citations, data availability statements, or supplementary materials included in this article.