Abstract
Chronic inflammation in tissues often causes the development of hypoxia. Herpes Stromal Keratitis (HSK) is a corneal chronic inflammatory condition that develops in response to recurrent herpes simplex virus-1 (HSV-1) infection. In this study, we investigated the development of hypoxia and the expression of hypoxia associated glycolytic genes in HSV-1 infected cornea, and the outcome of blocking hypoxia inducible factors (HIFs) dimerization on the severity of HSK. Our results showed the development of hypoxia, an elevated expression of hypoxia associated glycolytic genes, and an increased level of lactate in corneas with progressing HSK lesions. The magnitude of hypoxia correlated with the extent of neutrophils infiltrating the infected corneas, and the depletion of neutrophils reduced the development of hypoxia in infected corneas. Additionally, in progressing HSK lesions, nuclear localization of HIF-2α protein was detected in corneal epithelial cells, whereas HIF-1α protein stabilization was observed in infiltrating immune cells. Administration of acriflavine drug to HSV-1 infected mice inhibited nuclear accumulation of HIF-1α and HIF-2α protein in immune cell types and epithelial cells, respectively, in infected corneas. As a result, a decreased influx of CD4 T cells and non-granulocytic myeloid cells, but an increased influx of neutrophils was noted in developing HSK lesions. Interestingly, acriflavine treatment given during clinical disease period decreased neovascularization, but increased the opacity in HSV-1 infected corneas. Together, our study lay the foundation to dissect the role of inflammatory hypoxia and hypoxia associated genes in pathogenesis of HSK.
Keywords: Hypoxia, glycolysis, inflammation, HIF, HSK, neutrophils
Introduction
Herpes Stromal Keratitis (HSK) is a chronic inflammatory condition, which develops in the corneal tissue in response to recurrent corneal herpes simplex virus-1 (HSV-1) infection. Studies carried out in the mouse model of primary corneal HSV-1 infection have shown the influx of monocytes, natural killer (NK) cells, macrophages, neutrophils and T cells in inflamed corneal tissue (1). In mouse model, HSK is broadly categorized into pre-clinical and clinical disease period (2). During pre-clinical stage, viral replication in corneal lesion is regulated by innate sensors such as type I interferon signaling and by infiltrating innate immune cells like inflammatory monocytes and NK cells (3–6). Although the majority of infectious virus is cleared from the infected cornea by 6-day post-infection, the influx of leukocytes in the corneal stroma continues. Among the infiltrating leukocytes in progressing HSK lesions, neutrophils are the most prominent immune cell type and are considered essential for the development of HSK (7, 8). An outcome of massive neutrophil influx is the development of scarring, opacity and angiogenesis (hem and lymph) in corneal tissue, which affect the visual axis and ultimately cause the loss of vision (9, 10).
Neutrophils in an inflamed mucosal tissue has recently been shown to shape the development of inflammatory hypoxia (11, 12). Once developed, hypoxia results in the stabilization of hypoxia inducible factor (HIF) isoforms named HIF-1α and HIF-2α (13). In a hypoxic microenvironment, HIF isoforms get complexed with HIF-1β protein to form a heterodimer. The latter migrates to the nucleus to induce the expression of a battery of genes, which regulate glycolytic metabolism, cell survival, cell differentiation, and angiogenesis (14, 15).
In this study, we investigated the development of hypoxia, expression of hypoxia associated genes in HSV-1 infected corneas, and the outcome of blocking HIF dimerization to the severity of HSK. Our results showed an intense staining of pimonidazole hydrochloride, a chemical hypoxia marker, in the corneas with HSK. The magnitude of hypoxia positively correlated with the extent of neutrophil influx and the severity of HSK in infected corneas. Hypoxia in HSK developing corneas was associated with nuclear localization of HIF-1 and HIF-2 protein, and an elevated expression of genes regulating glycolysis and the glucose/lactate transporters. Interestingly, use of acriflavine drug to block the nuclear translocation of HIF molecules caused an increased influx of neutrophils, but decreased frequency of CD4 T cells and non-granulocytic myeloid cells in infected corneas. This resulted in the development of reduced corneal hemangiogenesis, but an increased corneal opacity. Altogether, these findings suggest potential contribution of hypoxia associated genes in regulating the pathogenesis of HSK.
Materials and Methods:
Mice and corneal herpes simplex virus-1 infection
Eight-twelve weeks old female C57BL/6J (B6, Stock No: 000664) mice from The Jackson laboratory (Bar Harbor, ME) were used in all experiments. All experimental procedures were reviewed and approved by the Institutional Animal Care and Use Committee of the Wayne State University. Mice were anesthetized by 200μl (20g body weight) of intra-peritoneal injection of ketamine HCl (100mg/ml), xylazine HCl (AnaSed 20mg/ml) solution prior to corneal HSV-1 infection. Development of HSK in C57BL/6J mice was studied with HSV-1 (McKrae) strain and 1×10⁵ plaques forming unit (p.f.u) of virus was applied only to the right cornea in 3μl of 1x PBS. To prevent any bacterial superinfection, all mice were housed in microisolator cages with cage top and were always handled under class II, Type A2 biosafety cabinet.
Intra-peritoneal injection of Hypoxyprobe-1
Intra-peritoneal injection of pimonidazole hydrochloride (Hypoxyprobe-1™ kit, Burlington, MA) was given to uninfected, and HSV-1 infected mice on 4, 10, and 15-day post-infection. Mice received pimonidazole drug at the concentration of 1.2mg/20g mouse body weight. The drug was dissolved in 0.9% of normal saline. Ninety minutes after injection, mice were euthanized. The eyeballs were enucleated, submerged in OCT compound and snap frozen in the liquid nitrogen.
Depletion of Neutrophils
To deplete neutrophils, HSV-1 infected mice received intraperitoneal injection (i.p.) of anti-Ly6G (clone 1A8, BioXCell) monoclonal antibody. First injection of antibody was given at the dose of 500 μg/day/mouse. Subsequently, 250 μg of anti-Ly6G antibody was given once a day to treated group of infected mice. Isotype match antibody was administered to control group of infected mice. A total of five injections were given starting from 7-day through 11-day post-corneal infection. On 12-day post-infection, mice received i.p. injection of pimonidazole hydrochloride and were euthanized to collect corneas and spleen tissue to enumerate the frequency of neutrophils between both groups of infected mice by flow cytometry.
Immunofluorescence staining
Immunofluorescent staining to detect pimonidazole adducts, HIF-1α, HIF-2α, GLUT-1, GLUT-3 and MCT4 protein was carried out on 8μm thick frozen corneal sections. The frozen sections were fixed in 2% paraformaldehyde for 30 min at room temperature prior to staining for pimonidazole, and GLUT-1, 3 and MCT4 protein. HIF staining was carried out on frozen sections that were fixed in ice-cold acetone for 20 minutes at −200C. Immunofluorescence staining procedure was carried out as described previously (16). The source of antibodies and the dilution used for staining are provided in supplementary table I. Images were acquired using a Leica TCS SP8 confocal microscope.
Cell surface and intracellular staining by flow cytometry
The infected eyes were enucleated and collected in the ice-cold RPMI 1640 medium with antibiotics. Under a dissecting microscope, the corneas were separated from the underlying lens, iris, ciliary body, and scleral tissue using curved fine forceps (Miltex York, PA). The individual cornea was digested with Liberase TL (2.5 mg/ml) to prepare a single-cell suspension for flow cytometry as described earlier (17). The cell surface staining for CD4, CD45, CD11b, F4/80 and Ly6G molecule was carried out on individual corneal samples, whereas cells were fixed and permeabilized prior to MCT4 staining. The BD biosciences staining buffer set (Cat # 554714) was used for intracellular pimonidazole staining, whereas the ebioscience transcription factor staining buffer set (cat # 005523–00) was used for HIF-1α staining. Both staining was carried out on non-leukocytes and the leukocytes in infected corneal samples. Neutrophil depletion was enumerated by preparing single cell suspension of spleen tissues from control and anti-Ly6G treated group of infected mice at 12-day post-infection. Cell surface staining of CD11b and Gr1 was performed and individual samples were acquired on LSRFortessa flow cytometer, and the data was analyzed using the FlowJo software. Source and dilution of antibody, and their isotype controls are provided in supplementary table I.
Hypoxia signaling pathway RT2 profiler PCR array and RT-qPCR assay
Individual Corneal samples dissected from naïve and HSV-1 infected eyes (5 and 10-day post-infection) were transferred into RLT buffer (RNeasy microkit, Qiagen) and total RNA was extracted as per manufacturer’s instruction. Purified RNA was quantitated using NanoDrop ND-1000 Spectrophotometer (Thermo Fisher Scientific, Waltham, MA,). 1.0 μg of RNA was reverse transcribed using RT2 first strand kit (Qiagen) to generate the cDNA template for qPCR assay. The 96-well plate RT2 profiler PCR array for hypoxia signaling pathway and individual primer sets for glycolytic genes (Slc2a1, Slc2a3, Slc16a3, HK2, PFKP, and PFKFB3), TCA cycle genes (Pdk1, CS, and Idh2), and PPP genes (G6Pd, Pgls, and Pgd) were purchased from SABiosciences Corporation, Frederick, MD. Optimal conditions for PCR amplification of cDNA were set as per the recommendations of SABiosciences Corporation. RT-qPCR was carried out using CFX connect Real-Time PCR Detection System; Bio-Rad. The fold differences in gene expression were calculated after normalization with house-keeping β-actin gene and represented as the relative gene expression ± the standard error of mean by using 2-ΔΔCT method of calculation (where ΔΔCT is equal to ΔCT(experiment)- ΔCT(control).
Lactate colorimetric assay
L (+)-Lactate concentration was measured in uninfected corneas and HSV-1 infected corneas obtained at 10-day post-infection, using lactate colorimetric assay kit as per manufacturer’s protocol (MAK064, Sigma Aldrich). Briefly, the individual corneal samples from both groups of mice were collected in 150μl of lactate assay buffer. The samples were homogenized using hand held homogenizers (Radnoti # 440613) and centrifuged at 13,000 x g for 10min at 4°C to remove any insoluble material. The supernatant was passed through 10KDa spin columns (ab93349, Abcam) to deproteinize and remove any lactate dehydrogenase remaining in the sample. Lactate concentration in elute collected from the columns (50μl) was measured as per the kit’s protocol. Sample absorbance was measured at 570nm (A570) on a microplate reader, and the results are expressed as ng/μl.
Acriflavine (ACF) treatment and clinical scoring of HSK lesions
HSV-1 infected mice received either intraperitoneal injection of vehicle or 8 mg/kg ACF in PBS. Injections were given twice a day, and a total of eight or twelve injections were given from 6-day to 9-day or 6-day to 11-day post-infection, respectively. The eyes were examined at 10-day post-infection, while using a hand-held slit lamp biomicroscope (Kowa, Nagoya, Japan), to determine the extent of corneal opacity and hemangiogenesis. A standard scale for corneal opacity and hemangiogenesis was used as previously described (17). To enumerate the frequency of immune cell subsets in HSK developing corneas from both groups, mice were euthanized on 12-day post-infection and flow cytometry was carried out individual corneal samples.
Statistical Analysis
Statistical analysis was conducted using the GraphPad prism software (San Diego, CA). Minimal number of mice for each experimental group was five. Experiments were repeated a minimum of two times. Significance was determined by unpaired two-tailed parametric t test or non-parametric Mann-Whitney test. One-way analysis of variance (ANOVA) was used to determine statistical significant difference when comparing the results of more than two independent groups. *p≤0.05, **p≤ 0.01, ***p≤0.001 and ****p≤ 0.0001 were considered statistically significant.
Results
Development of inflammatory hypoxia in HSK lesions
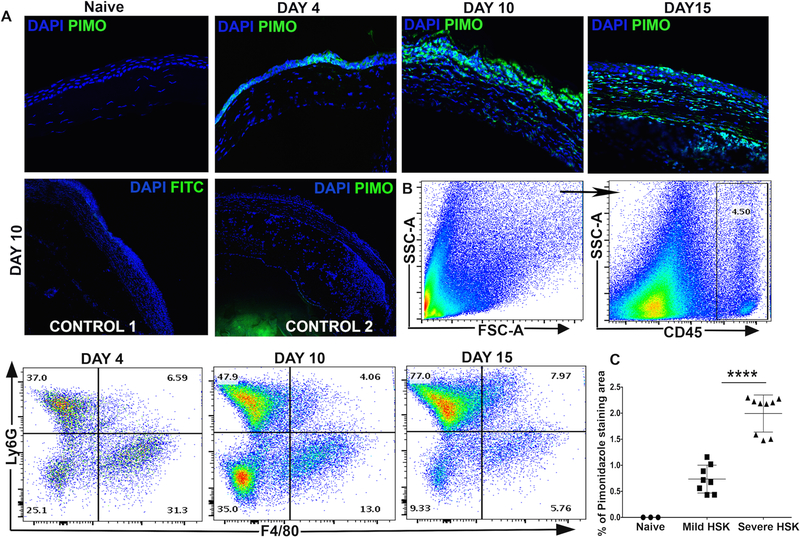
Inflamed lesions often become hypoxic (12, 13). In the mouse model of HSK, the onset of clinical disease begins from 7-day post-corneal infection, and it relates to the influx of neutrophils in infected corneas (8). To determine if there is a development of hypoxia in HSK lesions, HSV-1 infected mice received intraperitoneal injection of pimonidazole hydrochloride, a chemical hypoxia marker, during pre-clinical (4-day post-infection) and clinical (10- and 15-day post-infection) disease period of HSK. Pimonidazole is a 2-nitroimidazole, which gets reductively activated in hypoxic cells in vivo and form stable adducts with thiol groups in proteins, peptides and amino acids (18). Imaging technique with this compound is advantageous as it only allows imaging of viable tissue, and the compound is not active within apoptotic and necrotic regions (19). Our results showed weak pimonidazole staining at 4-day post-infection (p.i.), but an intense pimonidazole staining at 10- and 15-day p.i., in HSV-1 infected corneas (Fig. 1A). No pimonidazole staining was detected in naive cornea. Additional controls shown in Fig. 1A depict no pimonidazole staining in infected corneas at 10-day post-ocular infection (POI). Our results also showed a progressive increase in the frequency of neutrophils in infected corneas during the clinical disease period (Fig. 1B). An increased influx of neutrophils also correlated with the extent of pimonidazole staining in infected corneas. Furthermore, the corneas with severe HSK lesions showed a significant increase in pimonidazole stained areas in comparison to the corneas with mild HSK (Fig. 1C).
Figure 1.
Development of inflammatory hypoxia relates with the influx of neutrophils in HSV-1 infected corneas. (A) Representative frozen corneal sections show pimonidazole (PIMO) staining in uninfected (naive) cornea and HSV-1 infected cornea at 4-, 10-, and 15-day post ocular infection (POI). Prominent pimonidazole adduct staining (in green) is detected in infected corneas during the clinical disease period (10-day and 15-day POI). DAPI nuclear staining is shown in blue. The images shown were acquired with the 40x objective. Control 1 shows FITC-conjugated mouse IgG isotype staining in the frozen corneal section of an eye enucleated at 10-day POI. Control 2 shows staining with anti-pimonidazole antibody in the corneal section of an eye enucleated from infected mouse, which was not injected with pimonidazole drug. Control 1 and control 2 images were acquired with the 10x objective. Pimonidazole staining shown are representative of two independent experiments (n=5–6 corneas or mice per group). (B) Representative FACS plots show a progressive increase in the frequency of neutrophils (Ly6G+ cells), but a decrease in the frequency of macrophages (F4/80+ cells) in infected corneas during the clinical disease period. FACS plots are derived from total CD45+ cells in the infected cornea. Data shown is representative of two similar experiments. N= 4 mice at each time-point. (C) Scatter plot shows the magnitude of hypoxic regions in naive and the infected corneas with severe or mild HSK at 10-day POI, (n=3 naive corneas, n=8 corneas with mild HSK, and n=9 corneas for severe HSK). Data shown is representative of two similar experiments and was analyzed using nonparametric Mann-Whitney test (*p=0.0159).
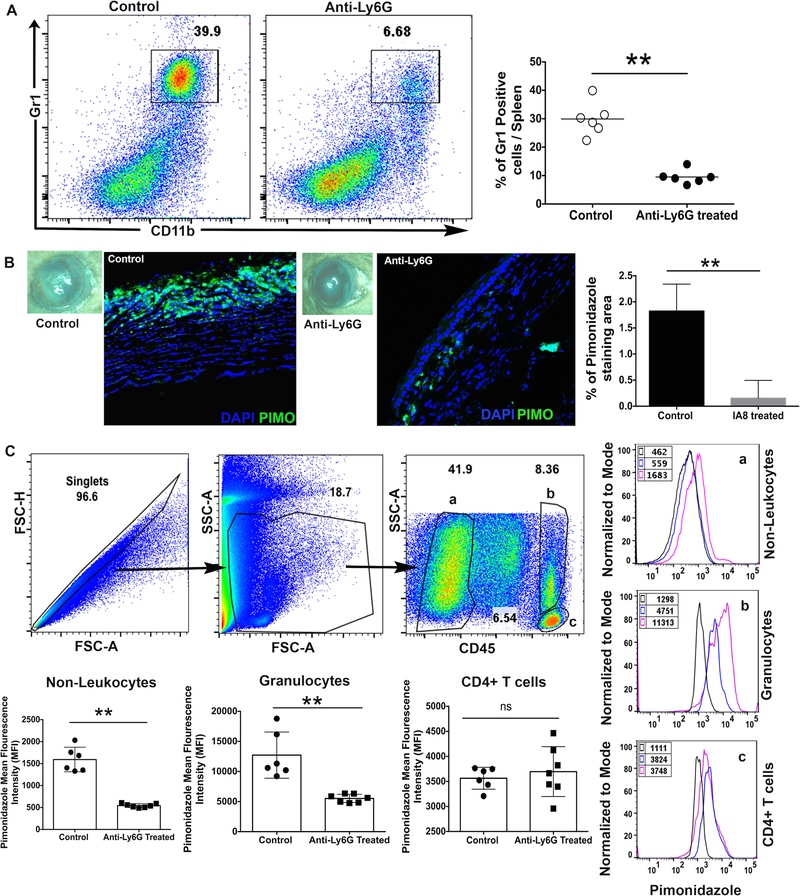
To determine if neutrophil influx in HSV-1 infected cornea contributes to the development of hypoxia, HSV-1 infected mice were depleted of neutrophils using anti-Ly6g (clone 1A8) monoclonal antibody, as described in methods. Depletion of neutrophils was confirmed by detecting the reduced frequency of Gr1high cells in spleen of 1A8 treated group of infected mice at 12-day p.i. (Figure 2A). As shown in Figure 2B, neutrophil depletion carried out in HSV-1 infected mice resulted in a significant decrease in the extent of pimonidazole stained area in infected corneal tissue. A recent study has shown the quantitation of pimonidazole staining in immune cell types using flow cytometry (20). Our results also showed that mice receiving 1A8 clone antibody treatment showed a significant decrease in cytosolic staining of pimonidazole adducts in non-leukocytes and granulocytes, but not in CD4 T cells, from HSV-1 infected corneas (Figure 2C). Together, our result confirmed the involvement of infiltrating neutrophils in causing the development of hypoxia in progressing HSK lesions.
Figure 2.
Neutrophil depletion significantly reduced the development of hypoxia in HSV-1 infected cornea. (A) Representative FACS plots denote the frequency of Gr1+CD11b+ cell population in the splenocytes obtained from isotype control and anti-Ly6G antibody treated groups of infected mice on day 12 post-infection. FACS plots were derived from singlets and live gated cells. Scatter plot denotes the frequency of CD11b+GR1+ cells in individual spleen samples from both groups of infected mice. Each circle represents an individual spleen sample. Data shown is derived from two experiments and n=6 mice in each group. (B) Representative eye-image from control and anti-Ly6G treated group of mice demonstrate the severity of HSK and pimonidazole staining in respective corneal section at day 12 post-infection. Bar graph denotes the percentage of pimonidazole stained area in infected corneas from both groups of mice. Quantification was carried out using NIH imageJ software. Pimonidazole staining shown are representative of two independent experiments (n=5 corneas or mice per group). DAPI nuclear staining is in blue and pimonidazole adduct staining is shown in green. Magnification x400. (C) Representative FACS plots denote the gating strategy of singlets and live gated cells in infected corneal samples from both groups of mice at 12-day post-infection. Three different cell population in FACS plot is gated as non-leukocytes (a), granulocytes (b), and CD4 T cells (c). Representative histogram FACS plots demonstrate mean fluorescence intensity (MFI) of pimonidazole adduct staining in control (___line) and anti-Ly6G treated (___line) groups. Isotype control is shown as black line in histogram FACS plot. Scatter plots denote pimonidazole MFI in three different cell population from both groups. Data derived is shown from two similar experiments with n= 6–7 corneas or mice/per group. p values were calculated using unpaired non-parametric t-test. **p<0.01
Increased expression of hypoxia associated glycolytic genes in HSK developing corneas
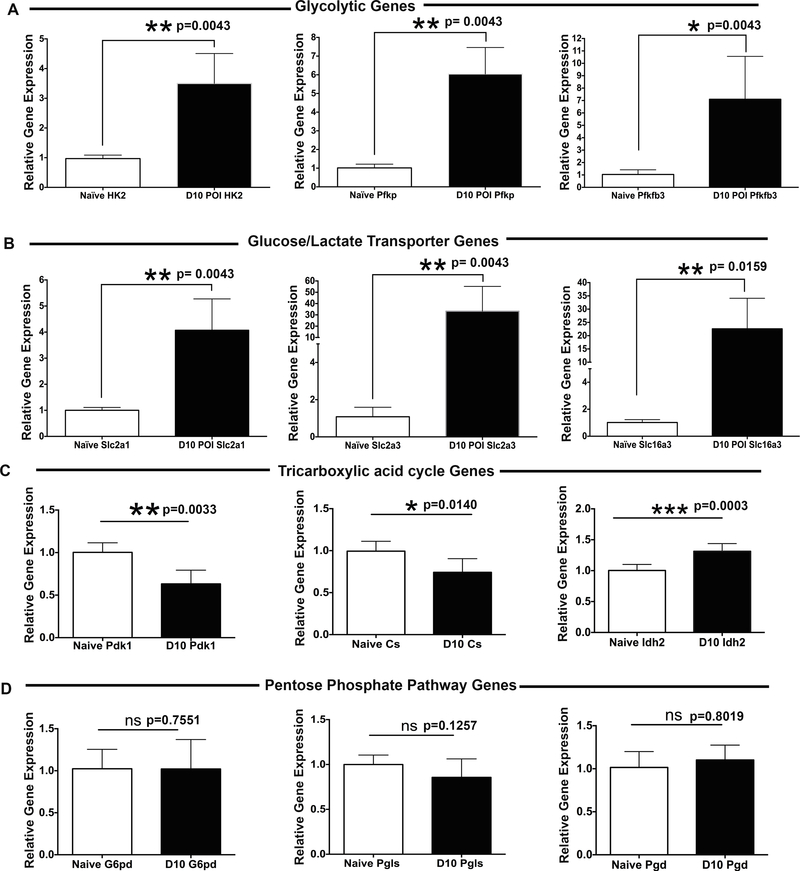
Development of hypoxia is not a bystander event, but can alter oxygen-dependent gene expression profile in inflamed tissue. To determine the expression of genes involved in hypoxia associated signaling, the hypoxia signaling pathway PCR Array was carried out on naive, 5-day and 10-day post-infection cornea samples. As shown in Table I, an elevated expression of the genes encoding glycolytic enzymes, glucose, and lactate transporters were detected in the corneas with progressing HSK lesions at 10-day post-infection. Quantitative RT-PCR analysis confirmed the results of PCR Array, as shown by a significant increase in the mRNA level of key glycolytic enzymes hexokinase 2 (HK2; average 3.49-fold increase), phosphofructokinase platelet (PFKP; average 6.06-fold increase), and 6-phosphofructo-2-kinase/fructose-2,6-bisphosphatase 3 enzyme (PFKFB3; average 7.1-fold increase) in the corneas with developing HSK lesions (Figure 3A). Similarly, an increased expression of glucose transporters Slc2a1 (GLUT-1; 4.0-fold increase) and Slc2a3 (GLUT-3; 33.25-fold increase), and the lactate transporter Slc16a3 (MCT-4; 22.58-fold increase) were also detected in the corneas with progressing HSK lesions (Figure 3B). We also ascertained the mRNA level of genes regulating other oxygen-dependent metabolic pathways (pentose phosphate pathway and tricarboxylic acid pathway) in HSV-1 infected corneas at 10-day post-infection. Our results showed no significant increase in mRNA expression profile of key genes involved in regulating oxidative phase of pentose phosphate pathway (PPP) (Figure 3D). On the other hand, an average 40% decrease (p=0.003) in mRNA level of pyruvate dehydrogenase kinase 1 (PDK1) was measured in infected than naive corneas at 10-day post-infection (Figure 3C). Pyruvate dehydrogenase complex (PDH), which converts pyruvate to acetyl CoA, is deactivated when phosphorylated by PDK1. Down-regulation of PDK1 expression is likely to cause the enhancement of PDH activity in HSK developing corneas. Interestingly, an average 25% decrease (p=0.0140) in the mRNA level of citrate synthase gene, which is required to convert acetyl CoA into citrate, was determined in HSK developing than naive corneas. Together, these results suggest that in addition to glycolysis, TCA cycle might also be operative although not predominantly in HSK developing corneas at 10-day post-corneal HSV-1 infection.
Table I.
Shows fold change in mRNA levels of glycolytic genes in infected corneas at 5-day and 10-day POI in comparison to uninfected cornea sample. Data is obtained from hypoxia signaling pathway RT2 Profiler PCR array.
| FOLD CHANGE | |||
|---|---|---|---|
| Gene ID | Gene Name | D5 POI | D10 POI |
| NM_007438 | Aldoa | 1.15 | 3.23 |
| NM_023119 | Eno1 | 0.91 | 3.76 |
| NM_013820 | Hk2 | 1.83 | 3.94 |
| NM_133232 | Pfkfb3 | 0.81 | 3.20 |
| NM_173019 | Pfkfb4 | 0.74 | 0.33 |
| NM_008826 | PfkI | 0.55 | 2.83 |
| NM_019703 | Pfkp | 1.73 | 4.92 |
| NM_023418 | Pgam1 | 0.77 | 2.39 |
| NM_008828 | Pgk1 | 0.86 | 1.53 |
| NM_030696 | Slc16a3 | 2.27 | 33.59 |
| NM_011400 | Slc2a1 | 1.07 | 3.39 |
| NM_011401 | Slc2a3 | 0.53 | 13.36 |
Figure 3.
Enhanced expression of glycolytic genes in the corneas with HSK. RT-qPCR was carried out on individual uninfected (naive) and HSV-1 infected cornea samples. Bar graphs document the fold change in the level of expression of (A) glycolytic genes (HK2, PFKP, and PFKFB3); (B) glucose/lactate transporters (Slc2a1, Slc2a3, and Slc16a3); (C) tricarboxylic acid cycle genes (PdK1, CS, and Idh2); and (D) pentose phosphate pathway genes (G6Pd, Pgls, Pgd) in infected individual corneas at 10-day post ocular infection (POI) in comparison to naive corneas. Data shown is representative of two similar experiments (n=5 corneal or mice samples per group). Statistical significance was calculated using parametric two-tailed student’s t-test.
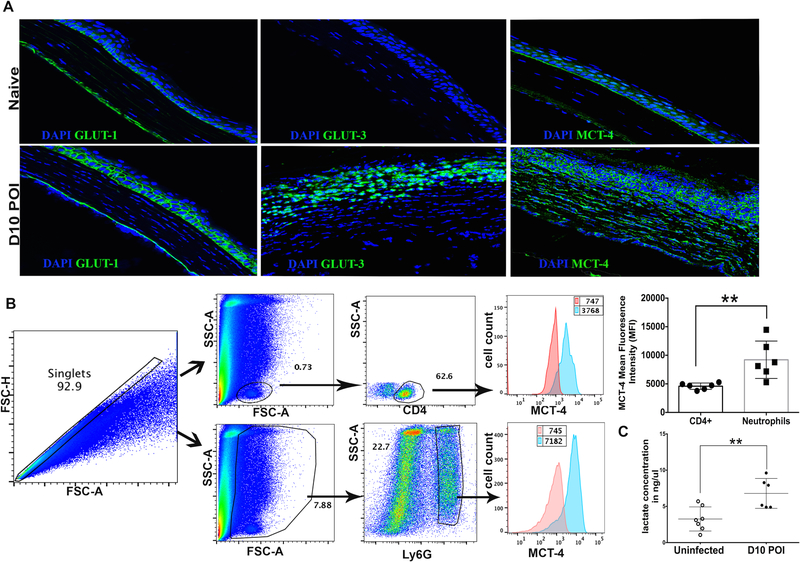
GLUTs and MCTs are transporter proteins associated with the cell membrane. Our results showed a dramatic upregulation in the expression of GLUT1, GLUT3, and MCT4 molecules in infected corneas (Figure 3B). Considering the importance of GLUT1/3 and MCT4 transporters in glucose import and lactate export, respectively, we next visualized their localization in frozen section of uninfected corneas, and the corneas with HSK lesions, using confocal microscopy. Our results showed weak membrane staining of GLUT1 in basal layer of the naive corneal epithelium. In stark contrast, an intense membrane staining of GLUT1 was seen in basal and wing cell layers of the corneal epithelium with HSK lesions at 10-day post-infection (Fig. 4A). However, to our surprise, no GLUT1 staining was evident in the corneal stroma, which is heavily infiltrated with neutrophils and CD4 T cells in HSK lesions (Fig. 4A). In agreement with our mRNA results for GLUT3 expression in HSK lesions, GLUT3 protein staining was clearly evident in stromal cells of the corneas with HSK (Fig. 4A), suggesting that GLUT3 could be the predominant glucose transporter for stromal cells in HSK lesions.
Figure 4.
Prevalence of glycolytic metabolism in the corneas with progressing HSK lesions. (A) Representative images of frozen corneal section document weak GLUT-1 and MCT-4, but no GLUT-3 staining in the corneal epithelium of naive corneas (top row). Intense membrane bound GLUT-1 staining is evident in the corneal epithelium of infected eyes, whereas GLUT-3 and MCT4 staining was seen in the epithelial and stromal region of infected corneas at 10-day POI (bottom row). GLUT-1, GLUT-3 and MCT-4 staining is shown in green and DAPI nuclear staining is shown in blue color. Image magnification is at 400X. Immunofluorescence images shown are representative of two independent experiments (n= 4–6 corneas or mice per group). (B) Representative histogram FACS plots are denoting the level of MCT4 protein in CD4 T cells and Ly6G+ neutrophils in HSK corneas at 10-day POI. Bar graph shows the MFI of MCT4 protein in CD4 T cells and neutrophils in individual corneas at 10-day POI. Results shown are representative of two independent experiments. (n= 6 corneas/mice in each group). ** p=0.0065 was calculated with two-tailed student’s t-test. (C) Scatter plot shows the amount of L (+)-Lactate in individual uninfected corneas and HSV-1 infected corneas at 10-day POI, as measured with a lactate colorimetric assay kit. Results shown are representative of three independent experiments. N= 6–7 corneas or mice in each group). ** p= 0.0058 was calculated by unpaired parametric t test.
As the availability of molecular oxygen is limited and fluctuating in inflamed tissue, the cells in HSK lesions may undergo anaerobic as well as aerobic (Warburg effect) glycolysis. Lactate is the end-product of glycolysis in both conditions, and can be exported/imported by different isoforms of MCTs (21). MCT4 isoform is known to express at higher level in hypoxic tissues with enhanced glycolysis in order to export the intracellular lactate generated during the glycolytic metabolism (22). In support of our mRNA data documenting an average of 33.25±9.82-fold increase in MCT4 expression in HSK lesions, an intense membrane staining of MCT4 in epithelial and stromal cells was detected in the corneas at 10-day post-infection (Fig. 4A). Additionally, flow cytometry data showed a significantly higher level of MCT4 protein in neutrophils than CD4 T cells in the corneas with HSK lesions (Fig. 4B). Since MCT4 is involved in exporting the intracellular lactate, we next ascertained the level of lactate in HSK lesions. Our results showed that the corneas with HSK lesions at 10-day post-infection had a significantly higher level of L-lactate in comparison to uninfected corneas (Fig. 4C). Overall, our data suggest the prevalence of glycolytic metabolism in progressing HSK lesions.
Stabilization and nuclear localization of HIF-1α and HIF-2α protein in progressing HSK lesion
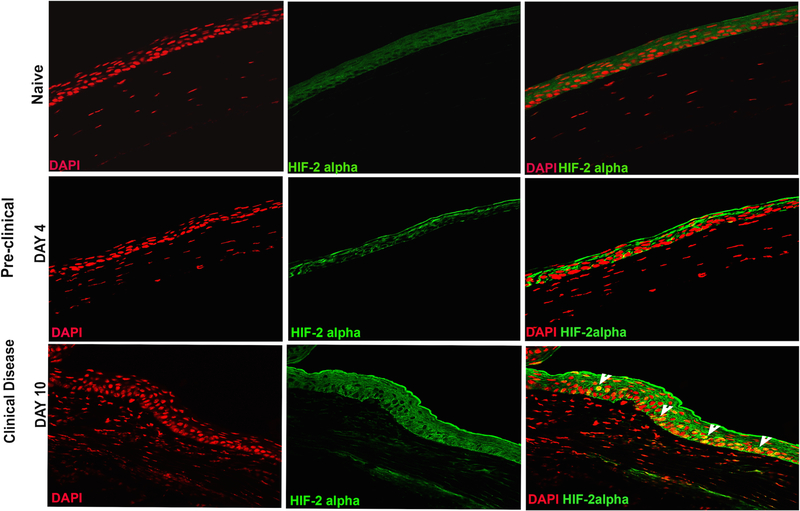
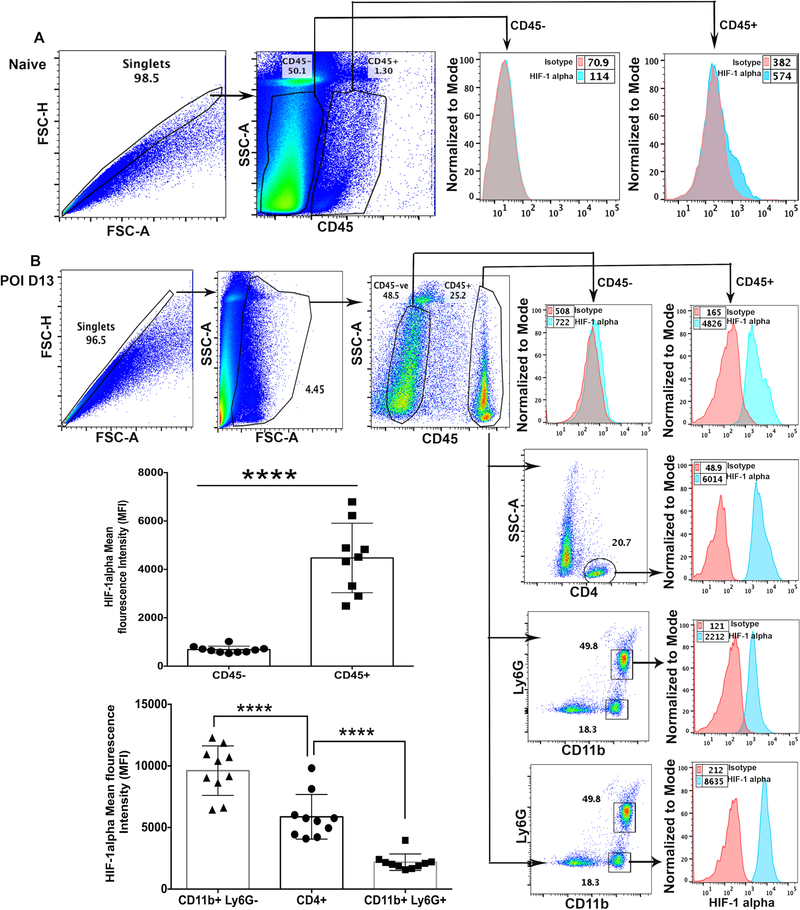
Stabilization of two primary isoforms of HIF (HIF-1α and HIF-2α) is the hallmark of hypoxia (23). Once stabilized, HIF-α proteins form a heterodimeric complex with constitutively expressed HIF-1β subunit also known as the aryl hydrocarbon receptor nuclear translocator (ARNT). Upon dimerization, HIFα/ARNT complex translocate to the nucleus. In the nucleus, HIF binds to hypoxia responsive elements (HRE) in the promoter region of the target genes, and initiates the transcription of a battery of genes, including those that are involved in glycolytic metabolism (15). HIF signaling is primarily regulated by nuclear translocation of HIF-α protein complex. Therefore, we next examined the nuclear localization of HIF-1α and HIF-2α protein in HSV-1 infected corneas using flow cytometry and confocal microscopy, respectively. As shown in Fig. 5, nuclear localization of HIF-2α protein was clearly evident in epithelial cells of the infected cornea during the clinical disease period (10-day post-infection). No nuclear localization of HIF-2α protein was evident in naive and 4-day post-infection cornea (Figure 5). HIF-2α expression pattern is more restricted than the expression of HIF-1α protein, which is known to regulate the function of immune cells. Since corneal stroma of infected eyes, during the clinical disease period, is heavily infiltrated with neutrophils and CD4 T cells, we carried out intracellular flow cytometric analysis to ascertain the nuclear level of HIF-1α protein in infiltrating immunocytes in infected corneas, as described in methods. Our results showed significantly higher level of HIF-1α protein in leukocytic than non-leukocytic cells obtained from infected corneas, during clinical disease period (Fig. 6B). Furthermore, a differential level of HIF-1α protein in the order of non-granulocytic myeloid cells > CD4 T cells> neutrophils was quantitated in progressing HSK lesions (Fig. 6B). On the other hand, marginal level of HIF-1α protein was detected in resident leukocytic cells in naive corneas of B6 mice (Fig. 6A). Together, our results show stabilization of HIF-1α and HIF-2α protein, albeit in different cell types, in infected corneas during the clinical disease period.
Figure 5.
Nuclear localization of hypoxia inducible factor-2α (HIF-2α) in epithelial cells of infected corneas during clinical disease period. Representative immunofluorescence images of frozen corneal sections show HIF-2α staining in naive cornea (top panel) and HSK developing cornea during pre-clinical (middle panel, 4-day POI) and clinical phase (bottom panel, 10-day POI) of disease. The top and bottom panel from left to right, show nuclear staining with DAPI (in red), HIF-2α staining (in green), and the merged images with nuclear localization of HIF-2α (in yellow). Arrowheads in the bottom row indicate the epithelial cells with nuclear localization of HIF-2α in yellow. Image magnification is at 400X. Immunofluorescence images shown are representative of five corneas at each time-point. Data is derived from two independent experiments.
Figure 6.
Hypoxia inducible factor-1α (HIF-1α) protein accumulation in immune cell subsets in HSK developing corneas. (A) Representative pseudocolor FACS plot of five pooled naive corneas denote the gating strategy employed for CD45- non-leukocytes and CD45+ leukocytes. Representative histogram FACS plot (right) shows isotype control and the level of intracellular HIF-1α protein in CD45- and CD45+ cell populations, respectively. Data shown is derived from two independent experiments. (B) Representative FACS plots showing HSV-1 infected corneas at 13-day POI demonstrate gating strategy employed for CD45- non-leukocytes, CD45+ leukocytes, CD4 T cells, CD11b+Ly6G+ neutrophils, and CD11b+Ly6G- non-granulocytic myeloid cells. Representative histogram FACS plots (from top to bottom) show isotype control and an intracellular level of HIF-1α protein in non-leukocytes, leukocytes, CD4 T cells, neutrophils, and myeloid cells in infected cornea. Scatter plot/bar graph demonstrates the MFI of HIF-1α protein in non-leukocytes vs leukocytes and in three different leukocyte cell subsets in individual infected corneas at 13-day POI. Data shown is derived from two similar experiments with n= 5 mice /group in each experiment. Statistical significance was calculated using unpaired non-parametric t-test and one-way ANOVA test. **** p<0.0001.
Acriflavine treatment to HSV-1 infected mice exacerbated the opacity, but decreased the hemangiogenesis in infected cornea
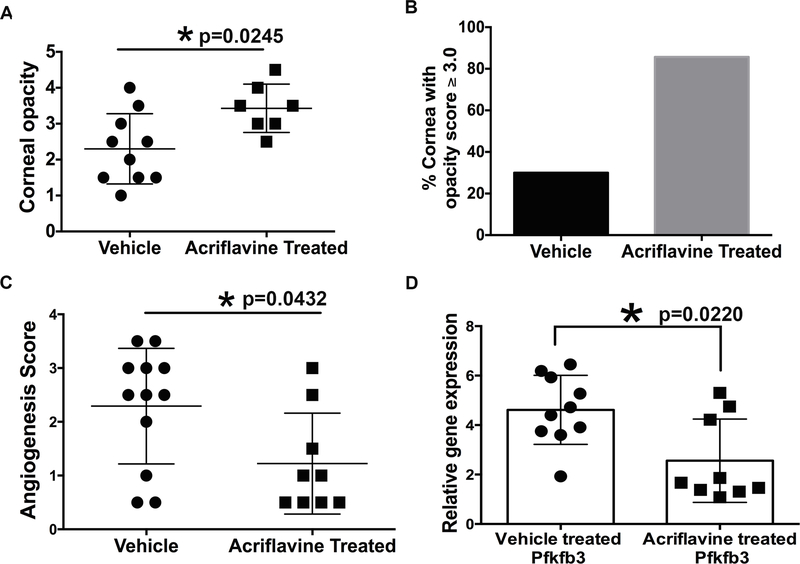
Acriflavine is a drug, which binds directly to PAS domain of HIF-1α and HIF-2α protein resulting in the blocking of HIF-α protein dimerization with HIF-1β protein, and thereby inhibits the transcriptional activity of HIF (24). Since our results showed stabilization of HIF-1α (in immune cell types) and HIF-2α (in corneal epithelial cells) in progressing HSK lesions, we chose to use the acriflavine drug to inhibit HIF signaling in HSV-1 infected mice, and measured the drug treatment effect on severity of HSK and immune cell influx in infected corneas. Systemic administration of acriflavine or vehicle was given to infected mice as described in methods, and the scoring of corneal opacity and hemangiogenesis was carried out on both groups of mice at 10-day post-infection. Unexpectedly, as shown in Fig. 7, we found a significant increase (p=0.0245) in the corneal opacity, but a significant decrease (p=0.0432) in hemangiogenesis in infected corneas at 10-day post-infection (Fig. 7A and 7C). Acriflavine treated group also exhibited an increased incidence of eyes with opacity score ≥3.0 (Fig. 7B). In support of our hemangiogenesis result, acriflavine treated group of mice showed a significant decrease (p=0.022) in mRNA levels of PFKFB3 in infected corneas when compared to the vehicle treated group of infected mice (Fig. 7D). Together, our results showed that acriflavine treatment is effective in reducing hemangiogenesis, but not the corneal opacity in HSV-1 infected corneas.
Figure 7.
Acriflavine treatment exacerbates the opacity, but significantly reduces hemangiogenesis in the corneas with HSK. (A) Scatter plot is showing the opacity score of individual corneas from the vehicle treated, and acriflavine treated groups of HSV-1 infected mice at 10-day POI. Eyes with a score of zero are excluded from both the groups of infected mice. (B) Bar diagram is showing the incidence of eyes with HSK score ≥3.0 between both groups of infected mice. C. Scatter plot shows hemangiogenesis score of individual corneas from both groups of infected mice at 10-day POI. D. Scatter plot/bar graph shows the expression of PFKFB3 gene in individual corneas from vehicle, and acriflavine treated groups of infected mice at 10-day POI. Data shown is derived from two similar experiments. N= 5–6 infected mice/group in each experiment. Statistical significance was calculated using nonparametric Mann-Whitney test.
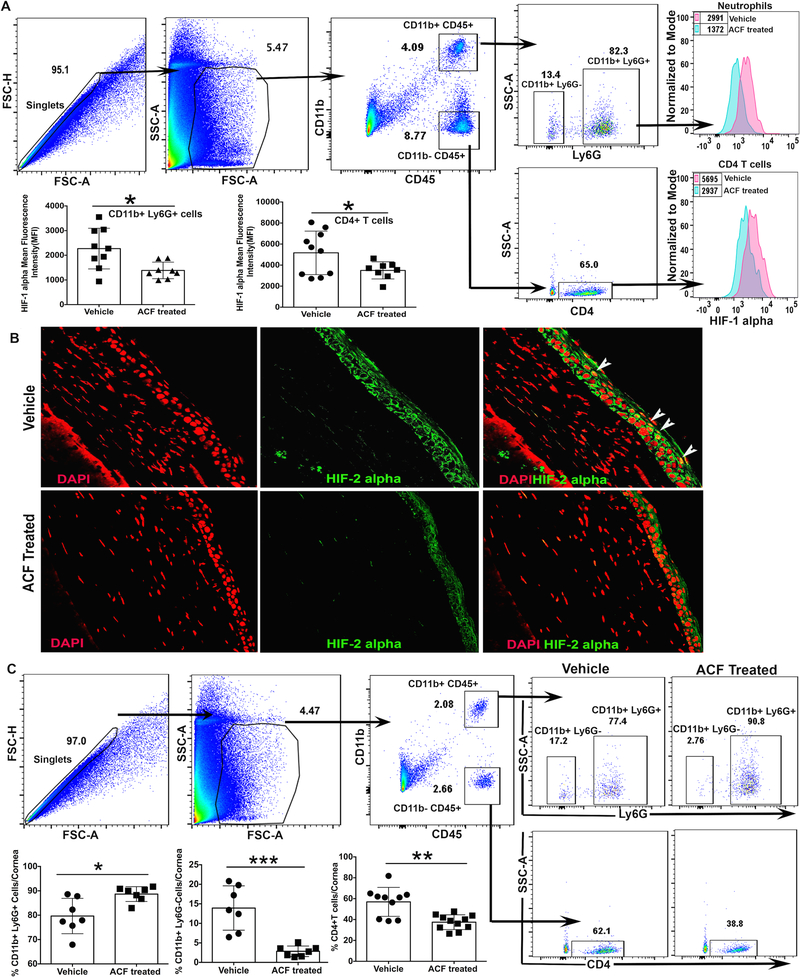
To determine the efficacy of acriflavine treatment in reducing the nuclear localization of HIF-1α and HIF-2α protein non-immune and immune cell subsets in HSV-1 infected corneas, we carried out intracellular flow cytometric analysis and confocal microscopy on HSV-1 infected corneal samples. Our results, as shown in Fig. 8A, demonstrate that in comparison to vehicle treated group, acriflavine treatment resulted in a significant decrease in the level of HIF-1α protein in neutrophils and CD4 T cells present in HSK lesions at 12-day post-infection. Similarly, HSK developing eyes obtained from acriflavine treated group of infected mice did not document nuclear localization of HIF-2α protein in epithelial cells of frozen corneal sections (Fig. 8B). Acriflavine treatment also resulted in the decreased frequency of non-granulocytic myeloid cells and CD4 T cells, but an increased frequency of neutrophils in HSK developing corneas at 12-day post-infection. Together, these results document the efficacy of acriflavine treatment in modulating HIF accumulation in non-immune and immune cell subsets in HSK lesions and their outcome in regulating the frequency of leukocyte subsets in HSK developing corneas.
Figure 8.
Acriflavine treatment to HSV-1 infected mice reduce HIF accumulation in non-immune and immune cell subsets in HSK developing cornea. (A) Representative FACS plots demonstrate gating strategy employed on single cell corneal samples obtained from HSV-1 infected mice at 12-day post-infection. HIF-1α protein levels in neutrophils (Ly6g+) and CD4 T cells in HSK developing corneas from vehicle and acriflavine treated group of mice are shown as histogram plots. Scatter plots denote the level of HIF-1α protein in neutrophils and CD4 T cells in individual corneas from both groups of mice at 12-day post-infection. Data shown is pooled from two similar experiments. N= 5 mice/group in each experiment. (B) Representative immunofluorescence images of frozen corneal sections from both groups of mice show nuclear accumulation of HIF-2α protein in corneal epithelial cells at 12-day post-infection. Top and bottom panel from left to right show nuclear staining with DAPI (in red), HIF-2α staining (in green), and the merged images with nuclear localization of HIF-2α (in yellow). Arrowheads indicate epithelial cells with nuclear localization of HIF-2α in yellow. Magnification x400. Images shown are representative of five infected corneas/mice from each group and are derived from two independent experiments. (C) Representative FACS plots denote gating strategy employed for singlets, leukocytes, neutrophils (CD11b+Ly6g+), non-granulocytic myeloid cells (CD11b+Ly6g-), and infiltrating CD4 T cells in HSK developing corneas from both groups of mice at 12-day post-infection. Scatter plot demonstrate frequency of three different leukocyte subsets in individual corneas from both groups of mice. Data shown is derived from two similar experiments and n= 5 mice/group in each experiment. p values were calculated using unpaired t-test. *p<0.05, **p<0.01, ***p<0.001.
Discussion:
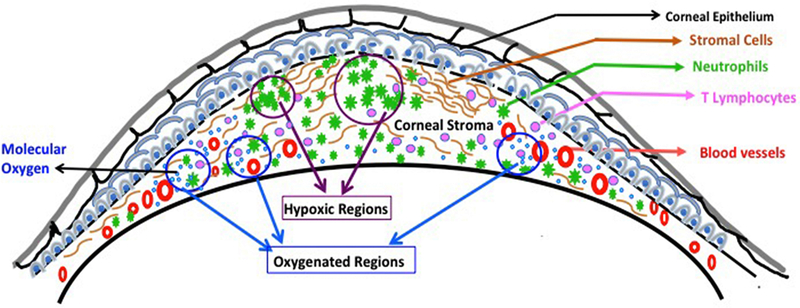
Inflamed lesions are well reported to become hypoxic (13). One possible cause of the development of hypoxia in inflamed tissue is an increased oxygen demand of metabolically active cells such as neutrophils. Neutrophils spend a large amount of energy while migrating from the peripheral blood to the inflamed tissue (25, 26). In inflamed tissue, neutrophils can shape the development of hypoxia as reported in the mouse model of inflammatory bowel disease (IBD) by carrying out the respiratory burst, which causes localized oxygen depletion, and the development of inflammatory hypoxia (11). In HSK lesions, neutrophils play an essential role in the development of disease (7), as the clinical disease severity correlates with the accumulation of neutrophils in infected eyes (8). It is likely that neutrophils in HSK developing corneas reduce molecular oxygen, supplied by newly formed blood vessels, via NADPH oxidase (NOX) activity. As a result, the pockets of hypoxia get created in progressing HSK lesions as depicted in the proposed model of hypoxia development in HSK lesions (Fig. 9).
Figure 9.
A proposed model to depict the development of inflammatory hypoxia in HSV-1 infected cornea with HSK lesion. The model shows the presence of both oxygenated and hypoxic regions in HSK lesions. Neovascularization of HSV-1 infected cornea will supply molecular oxygen, whereas the massive influx of neutrophils in HSK lesions could reduce the molecular oxygen into reactive oxygen species (ROS) and shape the development of inflammatory hypoxia.
Hypoxia is understood to favor the glycolytic metabolism to meet the energy demand of metabolically active cells (15). Our results showed several-fold upregulation in the expression of glycolytic genes in HSK corneas. An uptake of glucose is the first step of glycolysis. Glucose uptake is carried out by membrane-bound proteins named glucose transporters (GLUTs) (27). Among multiple glucose transporters, GLUT1 is reported as an essential glucose transporter for CD4 T cell activation and effector function (28). A recent study has shown that CD4 T cells in draining lymph node of HSV-1 infected mice express membrane-bound GLUT1 protein, and the systemic blocking of glucose uptake in HSV-1 infected mice could reduce the severity of HSK lesions (29). However, we detected the membrane-bound GLUT1 staining in corneal epithelial cells, but not in the corneal stroma which is heavily infiltrated with neutrophils and CD4 T cells in HSK lesions. Our results suggest that GLUT1 is not the glucose uptake receptor for immune cells in HSK lesions. In fact, our results showed intense GLUT3 staining in the corneal stroma of eyes with HSK, suggesting GLUT3 mediated glycolytic metabolism in HSK lesions. In support, the tissues with enhanced glycolytic activity are more dependent on GLUT3 than GLUT1 (30), as GLUT3 has higher affinity for glucose than GLUT1 (31).
Lactate is a major metabolite formed in the cytosol as a consequence of hypoxic or aerobic glycolysis (32, 33). Once formed, lactate can be exported outside the cell by lactate transporters that belong to monocarboxylate transporter (MCT) family (34, 35). Among the MCT family members, MCT4 is reported to get upregulated under hypoxic condition (22). MCT4 is also expressed at higher level in tissues where lactate efflux predominates. Our results showed higher expression of MCT4 along with an increased level of lactate in the corneas with progressing HSK lesions. Since the corneas with HSK are vascularized, HSK lesions are expected to have both hypoxic and oxygenated regions as depicted in Fig. 9. Lactate exported from the cells in the hypoxic region can be up taken by the cells in the oxygenated region via MCT1 transporter protein, as MCT1 is a known lactate importer (36). In fact, higher expression of MCT1 gene is detected in progressing HSK lesions (data not shown). Once imported, lactate can get converted into pyruvate, and the latter enters into mitochondrial respiration via acetyl CoA, suggesting that lactate may serve as an alternative metabolic fuel to promote oxidative metabolism in HSK lesions. In agreement, our results support the generation of acetyl CoA in progressing HSK lesions. Acetyl CoA generated in HSK lesions could either participate in fatty acid biosynthesis or get consumed by mitochondrial respiration. Furthermore, reduced expression of citrate synthase gene detected in HSK lesions, could cause epithelial to mesenchymal transition (EMT) as reported in a tumor model (37). A recent study has demonstrated the occurrence of partial EMT in HSV-1 infected corneas in a mouse model (38), suggesting a possible involvement of metabolism in regulating EMT process in HSK lesions. Additionally, lactate from HSK lesions may also get diffused into the blood stream and traffic to the liver where it gets converted into the glucose through Cori cycle (39). This may provide an explanation for an increased blood-glucose level noted recently during clinical phase of HSK (29).
Stabilization of the α-isoforms of hypoxia inducible factor (HIF) protein is the hallmark of hypoxia. The α subunits can be of two primary forms, HIF-1α or HIF-2α. When faced with hypoxia, HIF-α subunits get stabilized and form a heterodimeric complex with constitutive HIF-1β subunit protein. Upon dimerization, the complex gets translocated to the nucleus where it binds to hypoxia responsive elements (HRE) of target genes and initiate the transcription of a battery of genes, including those involved in regulating cellular metabolism. Although HIF-1α and HIF-2α protein has 48% amino acid sequence identity, they are reported to regulate the transcription of distinct target genes (40). HIF-1α, but not HIF-2α, is reported to directly stimulate the expression of genes encoding glycolytic enzymes, glucose and lactate transporters, implicating HIF-1α as an important contributor to the glycolytic metabolism (15, 41). Even though HIF-2α does not directly regulate the expression of glycolytic genes, it may achieve similar effects indirectly by enhancing the activity of c-Myc or other factors that promote glycolysis (42). Since our results showed stabilization of both HIF-1α and HIF-2α protein in HSK lesions, it is possible that enhanced expression of glycolytic genes measured in HSK lesions is regulated by HIF-α transcription factor.
HIF transcription factors are considered as key regulators of inflammation (43, 44). HIF-1α is widely expressed in innate and adaptive immune cell populations (45–47), whereas HIF-2α is expressed in a range of cell types, including endothelial cells, epithelial cells, and certain immune cell types such as macrophages and CD8 T cells (48–50). Considering the role of HIF transcription factors in promoting inflammation, blocking of HIF transcriptional activity is expected to reduce an ongoing inflammation. Acriflavine is a drug that binds directly to HIF-1α and HIF-2α protein and prevents their dimerization with HIF-1β protein resulting in the inhibition of HIF transcriptional activity (24, 51). In tumor model, acriflavine treatment has been shown to inhibit tumor vascularization (24). As expected, acriflavine treatment given to infected mice resulted in a significant reduction in the vascularization of HSV-1 infected corneas. This was associated with a significant reduction in mRNA level of PFKFB3, a glycolytic enzyme. PFKFB3 expression is enhanced by HIF transcriptional activity and inhibition of PFKFB3 activity is reported to reduce the pathological angiogenesis (52). Unexpectedly, the acriflavine treatment exacerbated the corneal opacity, suggesting that blocking of HIF transcription activity alone is not an effective approach to reduce the severity of HSK lesions. HIF signaling is known to play an important role in regulating the oxidative stress (53). In fact, blocking of HIF-1α is shown to increase the intratumoral level of reactive oxygen species (ROS) (54). Similarly, mice lacking HIF-2α display an enhanced generation of ROS due to reduced expression of genes encoding primary antioxidant enzymes (55). An increased influx of neutrophils noted in HSK lesions of acriflavine treated group of mice could contribute to the generation of ROS and an excessive level of ROS can promote inflammation and cause tissue damage (56). We hypothesize that acriflavine treatment to HSV-1 infected mice may increase the level of ROS in HSK lesions, and thereby exacerbate the corneal opacity.
Our study for the first time demonstrates the development of inflammatory hypoxia, stabilization of HIF protein, and the prevalence of glycolytic metabolism in HSV-1 infected corneas during the early stages of clinical disease period. Our results also suggest that use of pharmacological inhibitors of HIF alone might not be an effective approach to reduce both opacity and hemangiogenesis in HSV-1 infected corneas. Further studies are warranted to understand the role of infiltrating neutrophils in shaping the development of hypoxia in HSV-1 infected cornea, and the significance of hypoxia associated key glycolytic molecules in pathogenesis of HSK.
Supplementary Material
Acknowledgments
Supported by National Eye Institute Grant EY022417 awarded to Dr. Suvas
Footnotes
Disclosure: P. Rao, None; S. Suvas, None.
References:
- 1.Rowe AM, St Leger AJ, Jeon S, Dhaliwal DK, Knickelbein JE, and Hendricks RL 2013. Herpes keratitis. Prog Retin Eye Res 32: 88–101. [DOI] [PMC free article] [PubMed] [Google Scholar]
- 2.Biswas PS, and Rouse BT 2005. Early events in HSV keratitis--setting the stage for a blinding disease. Microbes Infect 7: 799–810. [DOI] [PubMed] [Google Scholar]
- 3.Royer DJ, and Carr DJ 2016. A STING-dependent innate-sensing pathway mediates resistance to corneal HSV-1 infection via upregulation of the antiviral effector tetherin. Mucosal Immunol 9: 1065–1075. [DOI] [PMC free article] [PubMed] [Google Scholar]
- 4.Leib DA, Harrison TE, Laslo KM, Machalek MA, Moorman NJ, and Virgin HW 1999. Interferons regulate the phenotype of wild-type and mutant herpes simplex viruses in vivo. J Exp Med 189: 663–672. [DOI] [PMC free article] [PubMed] [Google Scholar]
- 5.Conrady CD, Zheng M, Mandal NA, van Rooijen N, and Carr DJ 2013. IFN-alpha-driven CCL2 production recruits inflammatory monocytes to infection site in mice. Mucosal Immunol 6: 45–55. [DOI] [PMC free article] [PubMed] [Google Scholar]
- 6.Frank GM, Buela KA, Maker DM, Harvey SA, and Hendricks RL 2012. Early responding dendritic cells direct the local NK response to control herpes simplex virus 1 infection within the cornea. J Immunol 188: 1350–1359. [DOI] [PMC free article] [PubMed] [Google Scholar]
- 7.Thomas J, Gangappa S, Kanangat S, and Rouse BT 1997. On the essential involvement of neutrophils in the immunopathologic disease: herpetic stromal keratitis. J Immunol 158: 1383–1391. [PubMed] [Google Scholar]
- 8.Divito SJ, and Hendricks RL 2008. Activated inflammatory infiltrate in HSV-1-infected corneas without herpes stromal keratitis. Invest Ophthalmol Vis Sci 49: 1488–1495. [DOI] [PMC free article] [PubMed] [Google Scholar]
- 9.Gimenez F, Suryawanshi A, and Rouse BT 2013. Pathogenesis of herpes stromal keratitis--a focus on corneal neovascularization. Prog Retin Eye Res 33: 1–9. [DOI] [PMC free article] [PubMed] [Google Scholar]
- 10.Bryant-Hudson K, Conrady CD, and Carr DJ 2013. Type I interferon and lymphangiogenesis in the HSV-1 infected cornea - are they beneficial to the host? Prog Retin Eye Res 36: 281–291. [DOI] [PMC free article] [PubMed] [Google Scholar]
- 11.Campbell EL, Bruyninckx WJ, Kelly CJ, Glover LE, McNamee EN, Bowers BE, Bayless AJ, Scully M, Saeedi BJ, Golden-Mason L, Ehrentraut SF, Curtis VF, Burgess A, Garvey JF, Sorensen A, Nemenoff R, Jedlicka P, Taylor CT, Kominsky DJ, and Colgan SP 2014. Transmigrating neutrophils shape the mucosal microenvironment through localized oxygen depletion to influence resolution of inflammation. Immunity 40: 66–77. [DOI] [PMC free article] [PubMed] [Google Scholar]
- 12.Colgan SP, and Taylor CT 2010. Hypoxia: an alarm signal during intestinal inflammation. Nat Rev Gastroenterol Hepatol 7: 281–287. [DOI] [PMC free article] [PubMed] [Google Scholar]
- 13.Eltzschig HK, and Carmeliet P 2011. Hypoxia and inflammation. N Engl J Med 364: 656–665. [DOI] [PMC free article] [PubMed] [Google Scholar]
- 14.Majmundar AJ, Wong WJ, and Simon MC 2010. Hypoxia-inducible factors and the response to hypoxic stress. Mol Cell 40: 294–309. [DOI] [PMC free article] [PubMed] [Google Scholar]
- 15.Corcoran SE, and O’Neill LA 2016. HIF1alpha and metabolic reprogramming in inflammation. J Clin Invest 126: 3699–3707. [DOI] [PMC free article] [PubMed] [Google Scholar]
- 16.Twardy BS, Channappanavar R, and Suvas S 2011. Substance P in the corneal stroma regulates the severity of herpetic stromal keratitis lesions. Invest Ophthalmol Vis Sci 52: 8604–8613. [DOI] [PMC free article] [PubMed] [Google Scholar]
- 17.Gaddipati S, Estrada K, Rao P, Jerome AD, and Suvas S 2015. IL-2/anti-IL-2 antibody complex treatment inhibits the development but not the progression of herpetic stromal keratitis. J Immunol 194: 273–282. [DOI] [PMC free article] [PubMed] [Google Scholar]
- 18.Aguilera KY, and Brekken RA 2014. Hypoxia Studies with Pimonidazole in vivo. Bio Protoc 4: e1254. [DOI] [PMC free article] [PubMed] [Google Scholar]
- 19.Kizaka-Kondoh S, and Konse-Nagasawa H 2009. Significance of nitroimidazole compounds and hypoxia-inducible factor-1 for imaging tumor hypoxia. Cancer Sci 100: 1366–1373. [DOI] [PMC free article] [PubMed] [Google Scholar]
- 20.Ohta A, Diwanji R, Kini R, Subramanian M, Ohta A, and Sitkovsky M 2011. In vivo T cell activation in lymphoid tissues is inhibited in the oxygen-poor microenvironment. Front Immunol 2: 27. [DOI] [PMC free article] [PubMed] [Google Scholar]
- 21.Halestrap AP, and Wilson MC 2012. The monocarboxylate transporter family--role and regulation. IUBMB Life 64: 109–119. [DOI] [PubMed] [Google Scholar]
- 22.Ullah MS, Davies AJ, and Halestrap AP 2006. The plasma membrane lactate transporter MCT4, but not MCT1, is up-regulated by hypoxia through a HIF-1alpha-dependent mechanism. J Biol Chem 281: 9030–9037. [DOI] [PubMed] [Google Scholar]
- 23.Semenza GL 2012. Hypoxia-inducible factors in physiology and medicine. Cell 148: 399–408. [DOI] [PMC free article] [PubMed] [Google Scholar]
- 24.Lee K, Zhang H, Qian DZ, Rey S, Liu JO, and Semenza GL 2009. Acriflavine inhibits HIF-1 dimerization, tumor growth, and vascularization. Proc Natl Acad Sci U S A 106: 17910–17915. [DOI] [PMC free article] [PubMed] [Google Scholar] [Retracted]
- 25.Borregaard N, and Herlin T 1982. Energy metabolism of human neutrophils during phagocytosis. J Clin Invest 70: 550–557. [DOI] [PMC free article] [PubMed] [Google Scholar]
- 26.Pollard TD, and Borisy GG 2003. Cellular motility driven by assembly and disassembly of actin filaments. Cell 112: 453–465. [DOI] [PubMed] [Google Scholar]
- 27.Thorens B, and Mueckler M 2010. Glucose transporters in the 21st Century. Am J Physiol Endocrinol Metab 298: E141–145. [DOI] [PMC free article] [PubMed] [Google Scholar]
- 28.Macintyre AN, Gerriets VA, Nichols AG, Michalek RD, Rudolph MC, Deoliveira D, Anderson SM, Abel ED, Chen BJ, Hale LP, and Rathmell JC 2014. The glucose transporter Glut1 is selectively essential for CD4 T cell activation and effector function. Cell Metab 20: 61–72. [DOI] [PMC free article] [PubMed] [Google Scholar]
- 29.Varanasi SK, Donohoe D, Jaggi U, and Rouse BT 2017. Manipulating Glucose Metabolism during Different Stages of Viral Pathogenesis Can Have either Detrimental or Beneficial Effects. J Immunol 199: 1748–1761. [DOI] [PMC free article] [PubMed] [Google Scholar]
- 30.Leino RL, Gerhart DZ, van Bueren AM, McCall AL, and Drewes LR 1997. Ultrastructural localization of GLUT 1 and GLUT 3 glucose transporters in rat brain. J Neurosci Res 49: 617–626. [DOI] [PubMed] [Google Scholar]
- 31.Simpson IA, Dwyer D, Malide D, Moley KH, Travis A, and Vannucci SJ 2008. The facilitative glucose transporter GLUT3: 20 years of distinction. Am J Physiol Endocrinol Metab 295: E242–253. [DOI] [PMC free article] [PubMed] [Google Scholar]
- 32.Pucino V, Bombardieri M, Pitzalis C, and Mauro C 2017. Lactate at the crossroads of metabolism, inflammation, and autoimmunity. Eur J Immunol 47: 14–21. [DOI] [PubMed] [Google Scholar]
- 33.Haas R, Cucchi D, Smith J, Pucino V, Macdougall CE, and Mauro C 2016. Intermediates of Metabolism: From Bystanders to Signalling Molecules. Trends Biochem Sci 41: 460–471. [DOI] [PubMed] [Google Scholar]
- 34.Halestrap AP 2012. The monocarboxylate transporter family--Structure and functional characterization. IUBMB Life 64: 1–9. [DOI] [PubMed] [Google Scholar]
- 35.Halestrap AP, and Price NT 1999. The proton-linked monocarboxylate transporter (MCT) family: structure, function and regulation. Biochem J 343 Pt 2: 281–299. [PMC free article] [PubMed] [Google Scholar]
- 36.Benton CR, Yoshida Y, Lally J, Han XX, Hatta H, and Bonen A 2008. PGC-1alpha increases skeletal muscle lactate uptake by increasing the expression of MCT1 but not MCT2 or MCT4. Physiol Genomics 35: 45–54. [DOI] [PubMed] [Google Scholar]
- 37.Lin CC, Cheng TL, Tsai WH, Tsai HJ, Hu KH, Chang HC, Yeh CW, Chen YC, Liao CC, and Chang WT 2012. Loss of the respiratory enzyme citrate synthase directly links the Warburg effect to tumor malignancy. Sci Rep 2: 785. [DOI] [PMC free article] [PubMed] [Google Scholar]
- 38.Royer DJ, Elliott MH, Le YZ, and Carr DJJ 2018. Corneal Epithelial Cells Exhibit Myeloid Characteristics and Present Antigen via MHC Class II. Invest Ophthalmol Vis Sci 59: 1512–1522. [DOI] [PMC free article] [PubMed] [Google Scholar]
- 39.Young A 2005. Effects on plasma glucose and lactate. Adv Pharmacol 52: 193–208. [DOI] [PubMed] [Google Scholar]
- 40.Hu CJ, Wang LY, Chodosh LA, Keith B, and Simon MC 2003. Differential roles of hypoxia-inducible factor 1alpha (HIF-1alpha) and HIF-2alpha in hypoxic gene regulation. Mol Cell Biol 23: 9361–9374. [DOI] [PMC free article] [PubMed] [Google Scholar]
- 41.Semenza GL, Jiang BH, Leung SW, Passantino R, Concordet JP, Maire P, and Giallongo A 1996. Hypoxia response elements in the aldolase A, enolase 1, and lactate dehydrogenase A gene promoters contain essential binding sites for hypoxia-inducible factor 1. J Biol Chem 271: 32529–32537. [DOI] [PubMed] [Google Scholar]
- 42.Gordan JD, Thompson CB, and Simon MC 2007. HIF and c-Myc: sibling rivals for control of cancer cell metabolism and proliferation. Cancer Cell 12: 108–113. [DOI] [PMC free article] [PubMed] [Google Scholar]
- 43.Imtiyaz HZ, and Simon MC 2010. Hypoxia-inducible factors as essential regulators of inflammation. Curr Top Microbiol Immunol 345: 105–120. [DOI] [PMC free article] [PubMed] [Google Scholar]
- 44.Lin N, and Simon MC 2016. Hypoxia-inducible factors: key regulators of myeloid cells during inflammation. J Clin Invest 126: 3661–3671. [DOI] [PMC free article] [PubMed] [Google Scholar]
- 45.Cramer T, Yamanishi Y, Clausen BE, Forster I, Pawlinski R, Mackman N, Haase VH, Jaenisch R, Corr M, Nizet V, Firestein GS, Gerber HP, Ferrara N, and Johnson RS 2003. HIF-1alpha is essential for myeloid cell-mediated inflammation. Cell 112: 645–657. [DOI] [PMC free article] [PubMed] [Google Scholar]
- 46.Walmsley SR, Print C, Farahi N, Peyssonnaux C, Johnson RS, Cramer T, Sobolewski A, Condliffe AM, Cowburn AS, Johnson N, and Chilvers ER 2005. Hypoxia-induced neutrophil survival is mediated by HIF-1alpha-dependent NF-kappaB activity. J Exp Med 201: 105–115. [DOI] [PMC free article] [PubMed] [Google Scholar]
- 47.McNamee EN, Korns Johnson D, Homann D, and Clambey ET 2013. Hypoxia and hypoxia-inducible factors as regulators of T cell development, differentiation, and function. Immunol Res 55: 58–70. [DOI] [PMC free article] [PubMed] [Google Scholar]
- 48.Imtiyaz HZ, Williams EP, Hickey MM, Patel SA, Durham AC, Yuan LJ, Hammond R, Gimotty PA, Keith B, and Simon MC 2010. Hypoxia-inducible factor 2alpha regulates macrophage function in mouse models of acute and tumor inflammation. J Clin Invest 120: 2699–2714. [DOI] [PMC free article] [PubMed] [Google Scholar]
- 49.Uchida T, Rossignol F, Matthay MA, Mounier R, Couette S, Clottes E, and Clerici C 2004. Prolonged hypoxia differentially regulates hypoxia-inducible factor (HIF)-1alpha and HIF-2alpha expression in lung epithelial cells: implication of natural antisense HIF-1alpha. J Biol Chem 279: 14871–14878. [DOI] [PubMed] [Google Scholar]
- 50.Doedens AL, Phan AT, Stradner MH, Fujimoto JK, Nguyen JV, Yang E, Johnson RS, and Goldrath AW 2013. Hypoxia-inducible factors enhance the effector responses of CD8(+) T cells to persistent antigen. Nat Immunol 14: 1173–1182. [DOI] [PMC free article] [PubMed] [Google Scholar]
- 51.Wu D, Potluri N, Lu J, Kim Y, and Rastinejad F 2015. Structural integration in hypoxia-inducible factors. Nature 524: 303–308. [DOI] [PubMed] [Google Scholar]
- 52.Schoors S, De Bock K, Cantelmo AR, Georgiadou M, Ghesquiere B, Cauwenberghs S, Kuchnio A, Wong BW, Quaegebeur A, Goveia J, Bifari F, Wang X, Blanco R, Tembuyser B, Cornelissen I, Bouche A, Vinckier S, Diaz-Moralli S, Gerhardt H, Telang S, Cascante M, Chesney J, Dewerchin M, and Carmeliet P 2014. Partial and transient reduction of glycolysis by PFKFB3 blockade reduces pathological angiogenesis. Cell Metab 19: 37–48. [DOI] [PubMed] [Google Scholar]
- 53.Kojima I, Tanaka T, Inagi R, Kato H, Yamashita T, Sakiyama A, Ohneda O, Takeda N, Sata M, Miyata T, Fujita T, and Nangaku M 2007. Protective role of hypoxia-inducible factor-2alpha against ischemic damage and oxidative stress in the kidney. J Am Soc Nephrol 18: 1218–1226. [DOI] [PubMed] [Google Scholar]
- 54.Zhao T, Zhu Y, Morinibu A, Kobayashi M, Shinomiya K, Itasaka S, Yoshimura M, Guo G, Hiraoka M, and Harada H 2014. HIF-1-mediated metabolic reprogramming reduces ROS levels and facilitates the metastatic colonization of cancers in lungs. Sci Rep 4: 3793. [DOI] [PMC free article] [PubMed] [Google Scholar]
- 55.Scortegagna M, Ding K, Oktay Y, Gaur A, Thurmond F, Yan LJ, Marck BT, Matsumoto AM, Shelton JM, Richardson JA, Bennett MJ, and Garcia JA 2003. Multiple organ pathology, metabolic abnormalities and impaired homeostasis of reactive oxygen species in Epas1−/− mice. Nat Genet 35: 331–340. [DOI] [PubMed] [Google Scholar]
- 56.Mittal M, Siddiqui MR, Tran K, Reddy SP, and Malik AB 2014. Reactive oxygen species in inflammation and tissue injury. Antioxid Redox Signal 20: 1126–1167. [DOI] [PMC free article] [PubMed] [Google Scholar]
Associated Data
This section collects any data citations, data availability statements, or supplementary materials included in this article.


