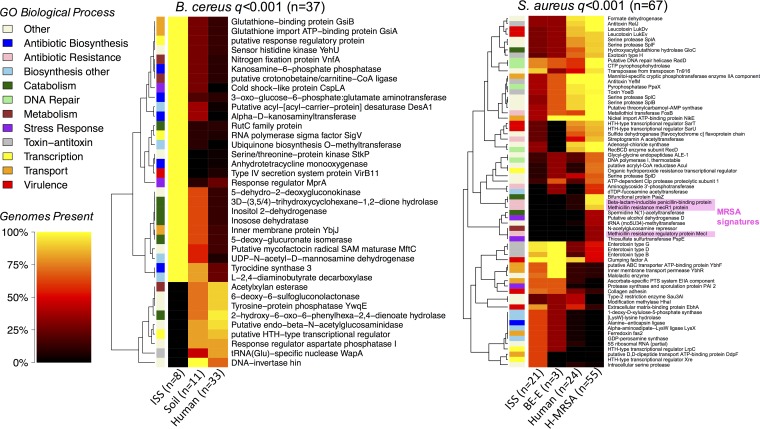
FIG 4.
Strain origin-enriched gene products. The heat map displays all function enrichments with FDR q < 0.001 for B. cereus (left) and S. aureus (right). Heat color corresponds to percentage of genomes per origin type containing at least 1 gene encoding the listed product. Row colors indicate the biological process group for gene products. On the S. aureus panel, the functions associated with the staphylococcal cassette chromosome mec (IWG-SCC 2009) are shaded.

