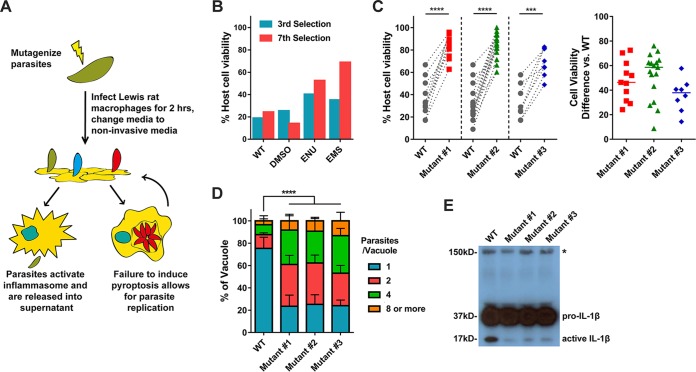
FIG 3.
Isolation of Toxoplasma mutants that do not induce Lewis rat macrophage cell death. (A) Schematic of mutagenesis screen. DS, dextran sulfate; BMDMs, bone marrow-derived macrophages. (B) Lewis rat BMDMs were infected with indicated mutagenized parasites (MOI = 1) for 24 h. Macrophage viability was measured via MTS assay. Data are displayed in columns (n = 1). (C) Lewis rat BMDMs were infected with WT parasites or independent mutant strains isolated from the pool of mutagenized parasites (Mutant #1, Mutant #2, and Mutant #3) (MOI = 1) for 24 h. Macrophage viability was measured via MTS assay. Data are displayed as paired scatterplots (left; n ≥ 8 for WT, n = 11 for mutant 1, n = 17 for mutant 2, n = 8 for mutant 3; ***, P < 0.001; ****, P < 0.0001 [Student's t test]). The right scatterplots show the cell viability difference between the indicated mutant strains and WT parasites in each paired experiment. Horizontal bars represent the median cell viability difference. (D) Lewis rat BMDMs were infected with the strains used as described for panel C (MOI = 0.5) for 24 h. The number of parasites per vacuole was quantified by microscopy. A total of 100 to 120 vacuoles were counted per experiment. Data are displayed as average values (n = 4; error bars, + standard deviations [SD]; ****, P < 0.0001 [two-way analysis of variance {ANOVA} comparing mutants to WT]). (E) Western blot probing for IL-1β on concentrated (20×) supernatants of LPS-primed (100 ng/ml, 2 h) Lewis rat BMDMs infected with the strains used as described for panel C (MOI = 1) for 24 h. The image is representative of results from two experiments; pro-IL-1β is 37 kDa; active IL-1β is 17 kDa; the aspecific band is represented by an asterisk and indicates similar levels of loading of samples.

