

Abstract
Sensory perception depends on neocortical computations that contextually adjust sensory signals in different internal and environmental contexts. Neocortical layer 1 (L1) is the main target of cortical and subcortical inputs that provide “top-down” information for context-dependent sensory processing. Although L1 is devoid of excitatory cells, it contains the distal “tuft” dendrites of pyramidal cells (PCs) located in deeper layers. L1 also contains a poorly characterized population of GABAergic interneurons (INs), which regulate the impact that different top-down inputs have on PCs. A poor comprehension of L1 IN subtypes and how they affect PC activity has hampered our understanding of the mechanisms that underlie contextual modulation of sensory processing. We used novel genetic strategies in male and female mice combined with electrophysiological and morphological methods to help resolve differences that were unclear when using only electrophysiological and/or morphological approaches. We discovered that L1 contains four distinct populations of INs, each with a unique molecular profile, morphology, and electrophysiology, including a previously overlooked IN population (named here “canopy cells”) representing 40% of L1 INs. In contrast to what is observed in other layers, most L1 neurons appear to be unique to the layer, highlighting the specialized character of the signal processing that takes place in L1. This new understanding of INs in L1, as well as the application of genetic methods based on the markers described here, will enable investigation of the cellular and circuit mechanisms of top-down processing in L1 with unprecedented detail.
SIGNIFICANCE STATEMENT Neocortical layer 1 (L1) is the main target of corticocortical and subcortical projections that mediate top-down or context-dependent sensory perception. However, this unique layer is often referred to as “enigmatic” because its neuronal composition has been difficult to determine. Using a combination of genetic, electrophysiological, and morphological approaches that helped to resolve differences that were unclear when using a single approach, we were able to decipher the neuronal composition of L1. We identified markers that distinguish L1 neurons and found that the layer contains four populations of GABAergic interneurons, each with unique molecular profiles, morphologies, and electrophysiological properties. These findings provide a new framework for studying the circuit mechanisms underlying the processing of top-down inputs in neocortical L1.
Keywords: barrel cortex, interneurons, layer 1, neocortex, top-down modulation
Introduction
Neocortical layer 1 (L1), the most superficial layer of the cerebral cortex, is the main target of top-down information conveyed by extensive projections from cortical and subcortical structures. This cortical layer is thought to mediate the integration of contextual and cross-modal information with incoming information specific to a given area, enabling flexible and state-dependent processing of feedforward sensory input arriving deeper in the cortical column (Cauller, 1995; Gilbert and Li, 2013; Larkum, 2013; Garcia-Munoz and Arbuthnott, 2015; D'Souza and Burkhalter, 2017).
An outstanding anatomical feature of L1 is its high density of horizontal fibers (Vogt, 1991), a feature described by Cajal more than 100 years ago (Ramon and Cajal, 1995). These fibers represent axons from a variety of sources and include corticocortical axons, axons from higher-order thalamic nuclei, and axons from subcortical neuromodulatory populations such as cholinergic neurons in the basal forebrain, the projections of which are enriched in L1 (Mechawar et al., 2000; Binzegger et al., 2004; Rubio-Garrido et al., 2009; Sherman and Guillery, 2011; Roth et al., 2016; D'Souza and Burkhalter, 2017). L1 is the only cortical layer that lacks excitatory cells; however, it contains the apical “tuft” dendrites of supragranular and infragranular pyramidal cells (PCs), the output neurons of the cortex. These dendrites are targets of the varied long-range projections arriving in L1 and mediate the integration of contextual information provided by these projections with feedforward sensory input arriving at the basal dendrites of the PCs (Cauller, 1995; Gilbert and Li, 2013; Larkum, 2013; Garcia-Munoz and Arbuthnott, 2015; D'Souza and Burkhalter, 2017).
L1 also contains the axons of Martinotti cells, a prominent subtype of GABAergic interneurons (INs), in supragranular and infragranular layers that expresses the neuropeptide somatostatin (SST). Martinotti cells innervate the tuft dendrites of PCs, gating the access of incoming information in L1 onto these dendrites (Wang et al., 2004; Murayama et al., 2009; Larkum, 2013; Tremblay et al., 2016). The activity of SST INs changes with behavioral states (Gentet et al., 2012; Lee et al., 2013; Muñoz et al., 2017), thereby regulating the impact of long-range axons on PCs in a behavioral-state-dependent fashion. Last, L1 contains a resident population of GABAergic interneurons (L1 INs), the composition and properties of which have not been well characterized to date (see Fig. 1A).
Figure 1.
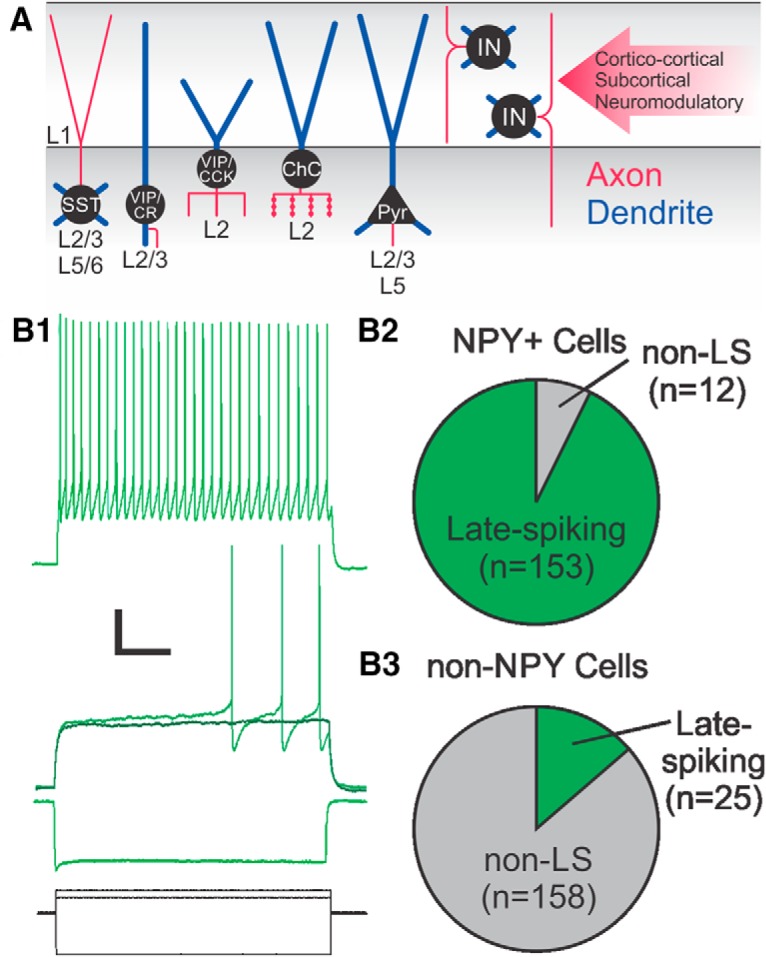
Enrichment of LS L1 labeled INs in NPY-hrGFP mice. A, Schematic of the circuit components of L1. Cell bodies are shown in black, axons in red, and dendrites in blue. Red arrow on the right shows long-range inputs arriving at L1. B1, Recording of a L1 LS NPY IN (green) in response to hyperpolarizing, just subthreshold, near-threshold, and suprathreshold current injections (current steps are shown in black at the bottom). Note the long delay to first spike during the threshold depolarization. This delay is absent in non-LS cells, which have onset spike(s) at threshold. Scale bars, 20 mV or 400 pA, 200 ms. B2, Pie chart showing the number of LS cells recorded in NPY+ L1 INs in green; non-LS cells in gray. B3, Pie chart showing the number of LS cells recorded in non-NPY L1 INs in green; non-LS cells in gray. Pyr, pyramidal cell; ChC, chandelier cell; CR, calretinin; CCK, cholecystokinin.
By gating the flow of information in L1, these INs control the strength and timing of long-range inputs onto PC apical dendrites. Without IN processing, the diversity of modulations of PC activity that distinct top-down inputs could produce would be much more limited. Although the precise composition of L1 INs has been difficult to establish (Table 1), there is evidence that they are direct targets of L1 projections and are important for processing long-range inputs (Letzkus et al., 2011; Cruikshank et al., 2012; Palmer et al., 2012; Ibrahim et al., 2016). However, without knowing the identity of L1 INs and lacking the tools to manipulate them, it has been difficult to study the mechanisms by which they mediate the impact of contextual input on PC activity. The mechanisms by which inputs to L1 affect the function of the cortical network must be different from those in other layers given the lack of excitatory neurons and are poorly understood. As a result, L1 is often referred to as “enigmatic” or a “crowning mystery” (Hubel, 1982; Marín-Padilla, 1992; Zhou and Hablitz, 1996a; Gilbert and Sigman, 2007; Palmer et al., 2012).
Table 1.
Interneurons of L1 in juvenile and adult rat and mouse
| Referencea | Cell types |
|---|---|
| Classification based on electrophysiological and morphological criteria | |
| A |
|
| B |
|
| C, D, E |
|
| F |
|
| Classification based mainly on morphological criteria | |
| G |
|
| H |
|
| I |
|
| Classification based mainly on electrophysiological criteria | |
| J |
|
| K |
|
aA: Hestrin and Armstrong, 1996; B: Wozny and Williams, 2011; C: Jiang et al., 2013; D: Jiang et al., 2015; E: Zhu and Zhu, 2004; F: Muralidhar et al., 2014; G: Zhou and Hablitz, 1996b; H: Kubota et al., 2011; I: Christophe et al., 2002; J: Lee et al., 2010; K: Cruikshank et al., 2012.
bLS was not evaluated in this study. A later study from this group (Chu et al., 2003) showed that LS L1 INs had NGFC morphology.
Previous studies of L1 INs agree that an important component of this population is neurogliaform cells (NGFCs), INs that mediate long-lasting GABAA and GABAB inhibition of PCs and have a late-spiking (LS) firing pattern when depolarized to near threshold membrane potentials (Chu et al., 2003; Tamás et al., 2003; Overstreet-Wadiche and McBain, 2015; Tremblay et al., 2016). However, whereas most studies agree that there is one or more additional IN subtypes, there is no agreement on the identity of these cells nor on their morphological or functional properties. Furthermore, several studies have included a substantial proportion of unclassified cells (Table 1).
The use of genetic methods to access IN groups based on specific molecular markers is largely responsible for advances in understanding IN diversity in other cortical layers during the last 10 years (for review, see Tremblay et al., 2016). These IN subtype-specific markers have facilitated distinguishing the electrophysiological and morphological properties of specific cell types from the variability within a group. We have pursued a similar strategy to decipher the IN diversity of L1. We identified markers that distinguish L1 INs and found that L1 contains four IN populations, each with unique molecular profiles, morphologies, and electrophysiological properties. These findings provide a new framework for studying the circuit mechanisms underlying the processing of top-down inputs in neocortical L1.
Materials and Methods
Animals.
All mice were maintained in accordance with protocols approved by the Institutional Animal Care and Use Committee at the NYU School of Medicine. Mouse strains used in this study are as follows: neuropeptide Y (NPY)-hrGFP [Jax stock #006417; van den Pol et al., 2009), GAD67-GFP (Riken BRC stock #RBRC03674; Tamamaki et al., 2003), vasoactive intestinal peptide (VIP)-EGFP (MMRRC stock #031009-UCD; The Gene Expression Nervous System Atlas (GENSAT) Project, NINDS Contract # N01NS02331 to The Rockefeller University, VIP-ires-Cre (Jax stock #010908; Taniguchi et al., 2011), CCK-ires-Cre (Jax stock #012706; Taniguchi et al., 2011), Rosa26LSL-tdTomato (Ai9; Madisen et al., 2010), Rosa26FSF-LSL-tdTomato (Ai65(RCFL-tdT)-D; Madisen et al., 2015), and Rosa26FSF-tdTomato (Ai65F)]. The neuron-derived neurotrophic factor (NDNF)-ires-Cre and Htr3a-ires-Flpo driver lines were generated by the Molecular and Transgenic (P01NS074972) and Rodent Genetic Engineering Cores at the NYU School of Medicine, following a similar workflow as outlined previously (Taniguchi et al., 2011). Briefly, embryonic stem (ES) cells (B4; C57BL/6) were electroporated with vectors targeting ires-Cre-bGHpA (NDNF) or ires-Flpo-bGHpA (Htr3a) cassettes for insertion into the 3′-UTR immediately following the stop codon. Properly targeted ES cell clones were selected by long range PCR screening (Phusion; Thermo Fisher Scientific) in combination with restriction mapping and then used to generate embryos by tetraploid complementation (Eakin and Hadjantonakis, 2006). Founder mice were bred to Flp (for NDNF-ires-Cre: ROSA26::Flpe; Jax stock #009086) or Cre (for Htr3a-ires-Flpo: CMV-Cre; Jax stock #006054) deleter lines to remove the respective neo cassettes before the establishment of homozygous breeder colonies. The NDNF-ires-Cre allele was genotyped by PCR on tail genomic DNA using the following primers: 5′-GCTGGAAGATGGCGATTGAAG-3′ (corresponds to Cre-pA sequence) and 5′-CAATGGTCAAAGCAAGGGGT-3′ (corresponds to NDNF 3′-UTR sequence); PCR product size: 1112 bp. The Htr3a-ires-Flpo allele was genotyped using the following primers: 5′-GGTGGGCTCTATGGCTTCTG-3′ (corresponds to bGH pA-residual vector sequence) and 5′-CACAGGTGAGCTGAAGAGGG-3′ (corresponds to Htr3a 3′ UTR sequence); PCR product size: 507 bp. Both lines have been submitted to Jackson Laboratories for wider distribution.
Our approach to labeling NDNF cells differs from that described in Tasic et al. (2016) in several key respects. In that study, the investigators developed an NDNF-ires-dgCre line (Jax stock #028536) in which a destabilized cre/EGFP fusion gene was inserted into the 3′-UTR of the NDNF gene immediately downstream of the stop codon. Although this fusion protein was designed to be stabilized upon administration of trimethoprim (TMP), the investigators reported that there was no difference in labeling in the presence or absence of TMP. They labeled NDNF cells by crossing the NDNF-dgCre driver with a cre-dependent reporter line (e.g., Ai14) and reported that the resulting cumulative recombination pattern was generally consistent with the endogenous NDNF expression pattern. In contrast, our NDNF-ires-Cre line (not destabilized) produced very broad cumulative recombination patterns when paired with Ai14, likely as a result of widespread low-level expression of NDNF during development, so we opted for the viral labeling strategy described below to achieve specific labeling of adult NDNF-expressing cells.
Slice preparation.
Adult transgenic mice of either gender [postnatal day 21 (P21) to P53; mean age ± SEM = P30.3 ± 0.3] were killed using pentobarbital sodium and phenytoin sodium. Once unresponsive, mice were perfused with ice-cold sucrose-ACSF containing the following (in mm): 87 NaCl, 75 sucrose, 2.5 KCl, 26 NaHCO3, 1.25 NaH2PO4, 10 glucose, 1.0 CaCl2, 2.0 MgCl2, 0 or 2.0 Na-pyruvate, and 0 or 0.4 Na-ascorbate saturated with 95% O2/5% CO2. The mice were then decapitated and the brains extracted. The brain was glued to a stage, placed into a chamber filled with bubbled ice-cold sucrose ACSF, and sliced into 300 μm-thick coronal sections using a Leica VT1200S vibratome. The slices were incubated at 35°C for 30 min in ACSF containing the following (in mm): 125 NaCl, 2.5 KCl, 26 NaHCO3, 1.25 NaH2PO4, 10 glucose, 2.0 CaCl2, and 1.0 MgCl2. Slices were then stored in ACSF for at least 30 min at room temperature before recording.
Electrophysiology recordings.
During recording sessions, slices were held in a chamber atop an air table and visualized using an upright microscope (Olympus BX51WI) either via infrared differential interference contrast or fluorescence illumination. Slices were perfused with ACSF saturated with 95% O2/5% CO2 during all recordings and the recording chamber bath was kept at 29–32°C. For some experiments, the bath solution contained the NMDA receptor blocker d-AP5 (25 μm; Abcam), the AMPA receptor blocker CNQX (10 μm; Tocris Bioscience), the GABAA receptor blocker GABAzine (10 μm; Abcam), and/or the GABAB receptor blocker CGP-35348 (60 μm; Tocris Bioscience).
All cells were recorded in the barrel field of the primary somatosensory cortex. The boundary between L1 and L2 was visualized using infrared differential interference contrast as the sharp increase in soma density 100–150 μm from the pia. The molecular identity of L1 interneurons was visualized using fluorescence illumination for GFP or tdTomato (see section on transgenic mice). All recordings were performed in current-clamp conditions using the whole-cell configuration in brain slices and the liquid junction potential was not corrected. Pipettes with resistances of 2–6 MΩ were made (Sutter Instrument) using borosilicate glass and were filled with potassium gluconate intracellular solution containing the following (in mm): 130 K-gluconate, 10 KCl, 10 HEPES, 0.2 EGTA, 4 Mg-ATP, and 0.3 Na-GTP, and typically 0.3–0.5% biocytin, adjusted to a pH of 7.3 with KOH. Before gaining whole-cell access, a gigaseal was obtained and the pipette capacitance was compensated. Access resistances were monitored throughout recordings and were completely compensated. The intrinsic properties of cells with access resistances >35 MΩ were not analyzed. All data were collected using a Multiclamp 700B amplifier (Molecular Devices), a Digidata 1322A digitizer (Molecular Devices), and Clampex version 10.3 software (Molecular Devices); data were sampled at 20 kHz and low-pass filtered at 10 kHz. In paired recordings, the somas of patched cells were <100 μm from each other.
Electrophysiology analysis.
All intrinsic properties were measured in current-clamp conditions and calculated from 1-s-long current injections unless noted otherwise. The resting membrane potential (in millivolts) was measured with 0 pA current injection soon after gaining whole-cell access; all other properties were measured at a holding potential of ∼−70 mV. The input resistance (in megaohms) was calculated using Ohm's law from averaged traces of 150 ms long negative current injections of typically −20 pA. The amplitude of voltage sags (%) were measured using hyperpolarizations to −100 mV and calculated as 100 × (Vsag minimum − Vsteady-state)/(Vsag minimum − Vholding). The time to voltage sag minimum (in milliseconds) was calculated as the time from negative current injection onset to sag minimum. The depolarizing hump amplitude (in millivolts) was calculated as the difference in potential between the threshold of the first spike observed using small increments of positive current injections (1–10 pA) and the potential 300 ms after the start of the current injection. LS cells have a delayed spike, so the depolarizing hump analysis for these cells was calculated as the difference in the maximum potential in the first 300 ms and the potential at 300 ms after the start of the current injection. The action potential (AP) threshold was calculated as the potential when the change in voltage over time was 20 mV/ms using the first observed spike and small increments of positive current injection (1–20 pA). The AP amplitude (in millivolts) was calculated as the difference in potential from the spike peak to the spike threshold. The AP half-width (in milliseconds) was calculated as the difference in time between the ascending and descending phases of a spike at the voltage midpoint between spike peak and spike threshold. The maximum spike slope (in millivolts/millisecond) was calculated as the maximum change in potential over time for the first observed spike. The adaption index was calculated as the ratio of the number of spikes in the last 500 ms over the number of spikes in the first 500 ms of a positive current injection that elicited ∼20–30 Hz firing. The time to first spike (in milliseconds) was calculated as the difference in time between the peak of the first AP and the start of the positive current injection. The afterdepolarization amplitude (ADP, in millivolts) was calculated as the difference in potential from the ADP peak to the afterhyperpolarization (AHP) minimum after the first spike; if there was no local ADP maximum, then ADP amplitude was calculated as the difference in potential 3 ms after the AHP from the AHP minimum. A single spike for some VIP cells could not be isolated, so the last spike in a burst near rheobase was used.
Synaptic strengths and probability of connection were analyzed using paired recordings in slice between either two L1 interneurons or a L1 interneuron and a L2 pyramidal cell. All cells were recorded in current clamp using K-gluconate intracellular solution (see above). IPSPs were recorded at a holding potential of ∼-55 mV; firing patterns were recorded at holding potentials of ∼-70 mV using 10–25 pA current injection steps. L1 interneurons were identified by their molecular markers and firing patterns as described above; L2 pyramidal cells were identified by their large soma and the firing patterns elicited by 1 s current injection steps of 25–100 pA. IPSP strengths were measured using the average of 15–80 trials and calculated as the difference in potential from baseline to IPSP peak. In each 20 s trial, a single spike was generated by a 1 ms current injection in the L1 IN. When testing the connectivity between NDNF cells (NGFCs and canopy cells), a spike was generated in one L1 IN and then in the second L1 IN 3.2 s later; therefore, the connectivity in both directions could be tested within every trial. In experiments to determine the GABAB-receptor mediated component of IPSPs, the paired recording protocol was repeated after CGP-35348 (60 μm) was washed into the bath solution for 5 min.
Morphological analysis.
Recorded cells were labeled using an intracellular solution containing 0.3–0.5% biocytin; in some cases, cells were labeled juxtacellularly using HEPES-buffered ACSF containing the following (in mm): 150 NaCl, 2.5 KCl, 1.25 NaH2PO4, 10 HEPES, 2 CaCl2, and 1.0 MgSO4, adjusted to pH 7.2 with NaOH and ∼3% biocytin. After labeling, slices were moved to cold 4% PFA for 3–12 h and then stored in 30% sucrose with 0.1 m PB. Slices were thoroughly washed with 0.1 m PB and then moved to CUBIC #1 tissue clearing solution (Susaki et al., 2014, 2015) for 2 d. After washing again, slices were treated with a 1:500 dilution of streptavidin conjugated to a fluorophore and 0.1 m PB. After another round of washing, slices were treated with CUBIC #2 solution for >15 min and mounted on glass slides in CUBIC #2 solution (24/30 reconstructions came from slices that were CUBIC treated; 6/30 were not treated with either CUBIC solution and were instead mounted in Vectashield medium with DAPI (Vector Laboratories). Because α-bungarotoxin (α-btx) staining requires resectioning recorded slices into 20-μm-thick sections, cells could either be used for reconstructions or α-btx staining, but not both. Cell morphologies were imaged using a confocal microscope (Zeiss) and a 63× oil-immersion objective; the molecular identity was also confirmed via confocal microscopy. The morphology of recorded cells was reconstructed using Neurolucida. Putative boutons were identified as swellings along the axon of well labeled cells and bound to reconstructed axon; the lengths of all reconstructed axonal segments are known and could be used to calculate the average interbouton interval. Axonal density was calculated using Amira software (Thermo Fisher Scientific) and custom-written MATLAB software (The MathWorks). Axons were binned into cubes (25 μm × 25 μm × 25 μm) and the total length of axon within each cube was counted. Then the density of axon in cubes was added vertically to produce the horizontal distribution of axonal density (in square micrometers); the average of these values for NGFCs and canopy cells was then plotted with SEM.
Histology.
Immunofluorescence and FISH were performed essentially as described previously (Lee et al., 2010). In brief, brain tissue was dissected from experimental animals following transcardial perfusion with 4% paraformaldehyde/PBS, with overnight postperfusion fixation in the same solution (except for immunofluorescence using the anti-VIP antibody, for which no postperfusion fixation was performed due to fixation sensitivity), after which brains were equilibrated in 30% sucrose/PBS before being frozen in blocks of embedding medium (optimal cutting temperature compound; Tissue-Tek) on crushed dry ice. Coronal brain tissue sections (20 μm) were prepared using a cryostat (Leica CM3050S), collected on slides (Colorfrost Plus; Thermo Fisher Scientific), and dried overnight at room temperature before storage at −80°C. DNA templates to generate digoxigenin or fluorescein-labeled antisense in situ hybridization probes for GAD67, NDNF, VIP, and Chrna7 were prepared by PCR using the respective probe sequences described by the Allen Brain Institute (http://mouse.brain-map.org), with a T7 promoter containing sequence (5′-TCACATTAATACGACTCACTATAGG-3′) added to the 3′ (reverse) primer. The rabbit anti-VIP antibody (Immunostar 20077) was used. Fluorescent labeling of α7-nicotinic acetylcholine receptors (α7-nAChRs) was performed by incubating tissue sections in Alexa Fluor 647 conjugated α-btx (Thermo Fisher Scientific; B35450, diluted to 1 μg/ml in PBS) for 1 h at room temperature following overnight permeabilization and blocking in PBS/0.1% Triton X-100/1% normal donkey serum. Fluorescent images were acquired using a Zeiss AxioImager.A1 microscope using MetaMorph software or by confocal microscopy, with channel levels and contrast adjustments performed in Adobe Photoshop.
For GABA staining, mice were first transcardially perfused with ice-cold PBS and then with 4% PFA in 0.1 m PB. After 1 h of postfixation in the same fixative solution, the brain was stored in PBS at 4°C. Coronal brain sections 70 μm thick were made in cold PBS using a vibratome (Leica); slices were then immunostained or stored in PBS with 0.05% sodium azide, sealed with Parafilm, and kept at 4°C. When ready for immunostaining, sections were washed with PBS and then treated with 1% Triton X-100 in PBS (PBT) for 1 h at room temperature. Sections were treated with a blocking solution (10% normal goat serum, 1% bovine serum albumin, 0.2% gelatin, 0.5% Triton X-100, dissolved in PBS) for 1 h at room temperature and then incubated with a 1:500 solution of rabbit anti-GABA antibodies (Sigma-Aldrich A2052) in blocking solution for 2 d at 4°C. Sections were then washed with 0.2% PBT for at least 1.5 h before being treated with goat anti-rabbit IgG conjugated to Alexa Fluor 488 (Life Technologies A11008; diluted 1:1000 in blocking solution) overnight at 4°C. Sections were again washed with 0.2% PBT for ∼15 min and then PBS for ∼15 min before being mounted on glass slides and imaged at 20× with confocal microscopy.
For some histology experiments, no immunostaining was necessary. In these instances, mice were perfused with ice-cold PBS and then 4% PFA; brains were extracted and stored overnight in 4% PFA at 4°C and then kept in PBS at 4°C until sectioning. Sections (50–90 μm thick) were made in cold-PBS or PB and then dried and mounted in Vectashield medium with or without DAPI (Vector Laboratories). For cell counting, sections were prepared in this manner or in a similar manner to sections used for electrophysiology recordings (see above) and then mounted on glass slides, imaged at 20× with confocal microscopy, and uploaded to Neurolucida. Labeled cell bodies were marked according to their identity and the proportions of overlapping markers were calculated.
Viral injections.
Mice were anesthetized with 2% isoflurane (Isothesia; Henry Schein Animal Health) vaporized in pure oxygen (air flow of 1.0 L/min). Once unresponsive, the mice were head fixed in a stereotactic frame, where body temperature was maintained at ∼37°C (DC Temperature Control System; FHC) for the duration of the surgery. A small hole was drilled in the skull (Volvere Vmax; NSK) above the barrel field (1.2–1.5 mm posterior; 3.0–3.5 mm lateral). A glass injection pipette (opening diameter 30–45 μm) was then inserted ∼0.5 mm into the brain and 200 nl of virus (AAV1.CAG.Flex.tdTomato.WPRE.bGH; Allen Institute 864; 1:1 dilution with PBS) was injected at 40 nl/min (Micro4; World Precision Instruments); this procedure was repeated for both sides of the brain. Mice were allowed to recover for at least 3 d after surgery and recordings were typically performed 3–7 d after virus injections.
Experimental design and statistical analysis.
All electrophysiology data were analyzed using Clampfit 10.3 and 10.7 (Molecular Devices), Excel (Microsoft), and custom-written MATLAB software (MathWorks). All morphological properties were analyzed using Neurolucida Explorer (MBF Bioscience) or Amira (Thermo Fisher Scientific) and custom-written MATLAB software. All statistical analysis was performed using MATLAB.
Results
Four molecular IN populations in L1
In addition to the axonal projections carrying contextual information and the distal tuft dendrites of pyramidal cells, L1 contains several sources of GABAergic influence. These include the axons of L2/3 and L5/6 Martinotti cells and a diverse population of INs with cell bodies in L1 (L1 INs). In addition, the dendrites of several L2/3 IN subtypes (including L2/3 VIP cells and L2 chandelier cells) have a considerable portion of their dendritic arborization in L1 (Woodruff et al., 2009, 2011; Taniguchi et al., 2013; Miyamae et al., 2017), where they can receive long-range inputs (Fig. 1A). The goal of this study was to elucidate the diversity of L1 INs.
We first sought to find molecular markers that could help to determine the diversity of L1 neurons. INs expressing SST or the Ca2+-binding protein parvalbumin (PV), two prominent IN groups in L2–L6, are rarely seen in L1 (Lee et al., 2010; Tremblay et al., 2016). Essentially, all L1 INs belong to a third group of neocortical INs characterized by the expression of GFP in a mouse line expressing this reporter under control of the promoter for the ionotropic serotonin receptor 5HT3a (Lee et al., 2010). Located in all cortical layers, 5HT3aR INs consist of two subgroups based on whether they express the neuropeptide VIP (Lee et al., 2010; Rudy et al., 2011; Tremblay et al., 2016). VIP INs are the major population of L2/3 INs, accounting for 35% of the INs in these layers (Tremblay et al., 2016), but are infrequent in L1 (Lee et al., 2010). Therefore, most L1 INs are non-VIP 5HT3aR cells, a heterogeneous interneuron population with a poorly characterized diversity (Lee et al., 2010).
To find markers that could help the segregation of L1 INs, we mined data from our own studies, as well as from the Allen Institute in situ hybridization (ISH) gene expression databases (Lein et al., 2007). For example, based on the observation that expression of the c-Kit gene is highly enriched in L1 neurons, we recorded from neurons expressing this gene in a mouse line expressing GFP under control of the c-Kit promoter (c-Kit-eGFP; Jax stock #025122; kind gift from Dr. Michael Kotlikoff, Cornell University). c-Kit eGFP expression in this mouse line did not overlap with Satb2, a marker of pyramidal cells, or with PV, SST, or VIP (Kruglikov et al., 2014). In addition, based on the observation that some L1 neurons express the neuropeptide CCK (Lee et al., 2010), we examined the 5HT3aR/CCK population by using intersectional genetics. We crossed CCK-Cre (CCK-ires-Cre; Jax stock #012706) with a newly generated 5HT3aR-Flpo driver line (see Materials and Methods) and a Cre+Flp-dependent tdTomato reporter mouse line (Ai65; Madisen et al., 2015). However, neither of these gene-targeting strategies proved useful in segregating L1 IN subtypes because electrophysiological recordings of labeled L1 cells using the c-Kit eGFP or 5HT3aR/CCK mouse lines yielded firing pattern diversities comparable to those seen in blind L1 cell recordings (data not shown).
Our first success was with a transgenic mouse line expressing GFP under control of the NPY gene promoter (NPY-hrGFP; Jax stock #006417). NGFCs in the hippocampus and the neocortex are known to express NPY (Kubota et al., 2011; Overstreet-Wadiche and McBain, 2015), but it is unclear whether it is also expressed by L1 NGFCs (Gonchar et al., 2007; Kubota et al., 2011). The NPY-hrGFP mouse line has been used to record from NGFCs in other cortical layers, but not in L1 (Chittajallu et al., 2013; Neske et al., 2015). We found that >90% of the GFP-positive cells in L1 (n = 153/165 recorded NPY+ cells; Fig. 1B) had the LS firing pattern characteristic of NGFCs. Conversely, LS cells were rarely observed among GFP-negative INs (n = 25/183 recorded NPY- cells; Fig. 1B). These data suggested that NPY expression as reported by this mouse line was a good marker to target L1 NGFCs, with a similar specificity and efficiency as the extensively used PV, SST, and GAD67 driver lines (Taniguchi et al., 2011; Muñoz et al., 2014).
Observation of the firing patterns of non-LS neurons suggested heterogeneity within this group. We therefore sought to find markers that could distinguish subtypes among non-LS neurons. We focused on NDNF, a marker identified as being largely restricted to L1 INs in the adult (Boyle et al., 2011). Using ISH, we confirmed that cortical NDNF expression is highly enriched in L1 INs (Fig. 2), having no overlap with the other major IN classes (PV, SST, and VIP). We then generated an NDNF-ires-Cre knock-in driver line (3′-UTR) and labeled NDNF-expressing INs via injection of a td-Tomato Cre reporter virus (AAV1.CAG.Flex.tdTomato.WPRE.bGH; Allen Institute 864) in the cortex. This approach is distinct from that used by Tasic et al. (2016), where an NDNF-dgCre (destabilized cre) line was crossed with the td-Tomato reporter line Ai14 to label NDNF cells (see Materials and Methods for details). We found that ∼70% of L1 INs were labeled using our strategy (mean ± SEM = 66.8 ± 1.3%, n = 4 mice). By incorporating the NPY-hrGFP reporter into this approach, we found that the NPY population comprised a subset of L1 INs within the NDNF population such that NDNF cells could be divided into NPY-positive and NPY-negative groups (Fig. 2F). NDNF/NPY INs account for ∼40% of the NDNF population (mean ± SEM = 40.8 ± 0.7%, n = 4 mice and thus ∼30% of L1) and the NDNF/non-NPY population for 60% (and thus ∼40% of L1). The remaining INs in L1 (∼30%) did not express NDNF. After exploring several potential markers, we found that the non-NDNF population could be divided in two groups: Approximately 30% of non-NDNF INs (and thus 10% of L1) were VIP cells, a marker that did not overlap with NDNF (Fig. 2C), whereas the remaining 70% of the non-NDNF population was composed of neurons found to strongly express α7 nAChRs, as determined by ISH, immunohistochemistry, and labeling with fluorophore-conjugated α-btx (Fig. 2D,E). Remarkably, although sparse, cells strongly labeled for α7 nAChRs (hereafter called α7 cells) were almost exclusively restricted to L1 (Fig. 2). Therefore, the molecular analysis defined four distinct L1 IN populations: NDNF/NPY, NDNF/non-NPY, α7, and VIP (Fig. 2G).
Figure 2.

Molecular markers distinguish four IN populations in L1. A, FISH for NDNF (red) with DAPI staining (blue). B, FISH for NDNF (red) and GAD67 (green) with DAPI staining (blue). C, FISH for NDNF (red) and VIP (green). D, FISH for NDNF (red) and α7 nAChR (green). E, Immunohistochemistry for VIP (green) with strongly α7 nAChR-expressing cells labeled with fluorophore-conjugated α-btx (red). F, NDNF cells labeled by AAV-flex-tdTomato injection in an NDNF-Cre;NPY-hrGFP mouse showing NPY (yellow) and non-NPY (red) NDNF populations. α7 cells (white) were labeled with fluorophore-conjugated α-btx. G, Model for L1 interneuron populations. Scale bars, 100 μm.
PV, SST, and VIP are useful IN markers because they identify IN groups that have common electrophysiological and morphological properties (Tremblay et al., 2016). Therefore, we next investigated whether the molecular groups we defined in L1 consist of cells with specific electrophysiological and morphological properties. We performed whole-cell current clamp recordings in coronal slices of barrel cortex to characterize the intrinsic electrophysiological properties of each L1 population (mice aged P21–P53; mean age ± SEM = P30.3 ± 0.3). All recorded cells were filled with biocytin for post hoc morphological reconstruction and analysis. In addition, the set of morphologies was supplemented by INs labeled juxtacellularly using higher concentrations of biocytin (see Materials and Methods).
The four molecularly defined L1 IN populations have characteristic electrophysiological properties
Current-clamp recording from L1 neurons in barrel cortex was used to characterize the firing properties of L1 INs. The same intracellular recording solution and holding potential (−70 mV) was used for all cells. The dataset used for this analysis consisted of 108 neurons. Most of the neurons were recorded in virally injected NDNF-Cre;NPY-hrGFP mice (see Materials and Methods; Fig. 2F). These mice enable the online distinction between NDNF and non-NDNF populations, as well as between the two NDNF-expressing groups. In addition, some of the cells used in this dataset were recorded in NPY-hrGFP mice, Htr3a-flpo;Ai65F mice, VIP-Cre;Ai9 mice, or VIP-GFP mice (see Materials and Methods).
We distinguished four distinct firing patterns and found that these correlated well with the molecularly defined groups (see Table 2 for a summary of the electrophysiological and morphological properties of each L1 molecular group). Most NDNF/NPY cells (92% in the present dataset) had a LS firing pattern near threshold and non-adapting or even accelerating repetitive firing; the other three populations showed non-LS “regular firing” patterns with an onset spike at the start of the threshold depolarization and repetitive firing with various degrees of spike frequency adaptation during suprathreshold step depolarizations depending on subtype (Fig. 3, Table 3). VIP cells in L1 have very high input resistances and adapt the most (input resistance: 351.1 MΩ ± 21.1 compared with 141.9 ± 6.6 and 141.6 ± 10.8 for the NDNF/non-NPY and α7 populations, respectively; adaptation index: 0.44 ± 0.05 compared with 0.83 ± 0.02 and 0.60 ± 0.03 for the NDNF/non-NPY and α7 populations respectively; for statistics, see Table 3), resembling the “fast-adapting” VIP INs previously described in layers 1–3 (Lee et al., 2010; Miyoshi et al., 2010; Prönneke et al., 2015). NDNF/non-NPY and α7 cells could be easily distinguished by the presence of an active depolarizing hump at near-threshold membrane potentials in α7 cells but not in NDNF/non-NPY cells (Fig. 3). This active depolarization resembles the Ca2+ spike observed in thalamic relay neurons (Llinás and Jahnsen, 1982; Jahnsen and Llinás, 1984; McCormick and Huguenard, 1992) and is likely mediated by a similar Ca2+ conductance because it is blocked by the T-channel blocker TTA-P2 (3 μm; data not shown). In NDNF/non-NPY cells, threshold spikes arose directly from the passive depolarization of the membrane, whereas in α7 cells, threshold spikes arose from the depolarizing hump (Fig. 3). α7 cells have a firing frequency adaptation between the NDNF/non-NPY and VIP cells and show a larger Ih-mediated hyperpolarizing sag, resembling the non-LS cells described by Cruikshank et al. (2012) (Table 3).
Table 2.
Summary of molecular, electrophysiological, and morphological properties of L1 interneurons
| Cell type | Molecular profile | Electrophysiological properties | Morphological properties |
|---|---|---|---|
| Neurogliaform cells (NGFCs) | NDNF+NPY+ | Late spiking (LS): non-adapting spike trains | Dense elongated axonal arbor confined to L1 |
| Canopy cells | NDNF+NPY- | Non-LS: onset spike(s) at the start of threshold depolarizations; spike trains with moderate spike frequency adaptation; lack near threshold active depolarizing hump as in α7 cells | Elongated axonal arbor largely confined to the upper half of L1; axonal arbor less dense than in NGFCs |
| α7 cells | NDNF- α7 nAChR+ | Non-LS: onset spike(s) at the start of threshold depolarizations; spike trains with moderate spike frequency adaptation; prominent near threshold active depolarizing hump; large Ih-mediated hyperpolarizing sag | Somas in lower half of L1; axon collaterals descending to L5A; largest soma size of all L1 cells; multipolar dendrite |
| VIP cells | NDNF- VIP+ | Non-LS: fast-adapting; onset spike(s) at the start of threshold depolarizations; spike trains with strong spike frequency adaptation; high input resistance | Somas in lower half of L1; axon collaterals descending to L6, branching in L5A; smallest soma size of all L1 cells; bipolar dendrite |
Figure 3.

Electrophysiological properties of the four L1 IN populations. A, Recording of a representative NDNF/NPY (green), NDNF/non-NPY (orange), α7 (purple), and VIP (blue) L1 IN in response to hyperpolarizing, just subthreshold, near-threshold, and suprathreshold current injections. Shown in black at bottom are the current steps. Scale bars, 20 mV or 400 pA and 200 ms. Insets show a magnification of the area near the first spike for the NDNF/non-NPY and α7 INs, showing the active depolarizing hump near threshold for α7 INs; scale bars: 15 mV and 40 ms. B, α7 nAChR expression in the non-NDNF L1 IN the firing pattern of which is shown in A. C, 3D plot of the time to first spike at threshold, initial depolarizing hump amplitude (see Materials and Methods), and input resistance for 99 L1 INs. The color of each data point indicates molecular identity. Data points with a white fill indicate NPY-negative cells for which no other molecular information is available. For these cells, the color of the circle around the data point indicates the molecular type typically associated with the observed firing pattern. Two black data points indicate non-NDNF cells with firing patterns typical of NDNF/non-NPY cells. NDNF/NPY, n = 21; NDNF/non-NPY, n = 24; α7, n = 20; VIP, n = 19; cells lacking molecular information, n = 13. α7 INs were identified based on the observation that non-NDNF INs are either VIP or strongly α7 nAChR expressing. This was confirmed by post hoc labeling with fluorophore-conjugated α-btx for four of the non-NDNF cells in the dataset, including the cell illustrated in A. Three additional non-NDNF cells were also confirmed as α7 nAChR-expressing, but only partial electrophysiological data were collected from these cells and they were therefore not included in this analysis. D, Dendrogram of unsupervised cluster analysis using Ward's method showing four distinct electrophysiological cell groups. We used 11 electrophysiological parameters: resting membrane potential, input resistance, sag amplitude, time to sag minimum, amplitude of depolarizing hump near threshold, spike amplitude, spike half-width, maximum spike slope, adaptation index, time to first spike, and ADP amplitude. Analysis is based on 82 of the cells shown in C for which all these parameters were available (NDNF/NPY, n = 17; NDNF/non-NPY, n = 20; α7, n = 17; VIP, n = 15; cells lacking molecular information, n = 13). The color of data points represents the same molecular information as in C, but black circles indicate NPY-negative cells and two non-NDNF cells with firing patterns typical of NDNF/non-NPY cells; asterisks indicate morphologically identified cells. Shown in gray on the pie charts are the percentage of adjacent dendrogram branches with the indicated firing pattern.
Table 3.
Intrinsic electrophysiological properties of L1 IN subtypes
| Electrophysiological property | NDNF/NPY |
NDNF/non-NPY |
α7 |
VIP |
|---|---|---|---|---|
| NGFC (n ≥ 22) | CANOPY (n ≥ 31) | (n ≥ 19) | (n ≥ 19) | |
| Resting Vm (mV) | −67.2 ± 0.8 | −63.9 ± 0.6 | −60.1 ± 0.9 | −60.2 ± 1.4 |
| Input resistance (MΩ) | 172.9 ± 10.3 | 141.9 ± 6.6 | 141.6 ± 10.8 | 351.1 ± 21.1 |
| Sag amplitude (%) | 8.0 ± 0.6 | 15.4 ± 1.3 | 21.5 ± 1.6 | 11.3 ± 1.3 |
| Time to sag min (ms) | 23.3 ± 2.7 | 22.5 ± 1.9 | 36.6 ± 4.6 | 72.7 ± 8.8 |
| Depolar hump amp (mV) | 1.8 ± 0.4 | 7.9 ± 0.5 | 17.3 ± 0.5 | 14.3 ± 0.6 |
| AP threshold (mV) | −32.3 ± 0.4 | −36.4 ± 0.4 | −35.9 ± 0.5 | −39.3 ± 0.7 |
| AP amplitude (mV) | 68.0 ± 1.0 | 74.3 ± 1.0 | 82.3 ± 1.1 | 95.0 ± 1.4 |
| AP half-width (ms) | 0.73 ± 0.03 | 0.45 ± 0.01 | 0.42 ± 0.02 | 0.44 ± 0.01 |
| Max spike slope (mV/ms) | 426.0 ± 17.6 | 500.5 ± 13.9 | 610.0 ± 20.2 | 805.3 ± 39.0 |
| Adaptation index | 1.01 ± 0.02 | 0.83 ± 0.02 | 0.60 ± 0.03 | 0.44 ± 0.05 |
| Time to first spike (ms) | 750.1 ± 28.6 | 31.2 ± 3.1 | 46.4 ± 4.5 | 116.1 ± 10.5 |
| ADP amplitude (mV) | 0.64 ± 0.04 | 1.74 ± 0.24 | 4.07 ± 0.65 | 5.74 ± 0.75 |
Values are shown as mean ± SEM. All cells were part of our database of 108 L1 INs. For some cells, complete analysis of their properties was not available, so n values are the minimum number of cells used to calculate any given parameter. See Materials and Methods for a description of how each parameter was computed. Cells were grouped by their firing pattern and named according to the molecular profile typically associated with that firing pattern (see Table 2). The Kruskal–Wallis test was used to determine the significance of differences in each electrophysiological parameter and subsequent pairwise comparisons were performed using Dunn's test with a Šidák correction. The results of Kruskal–Wallis tests for each parameter are as follows: resting Vm, p = 4.6e-7; input R, p = 8.0e-11; sag amplitude, p = 1.3e-7; time to sag min, p = 5.2e-9; depolarizing hump amplitude, p = 1.1e-18; AP threshold, p = 4.7e-11; AP amplitude, p = 4.1e-16; AP half-width, p = 1.4e-11; max spike slope, p = 3.1e-13; adaptation index, p = 1.8e-15; time to first spike, p = 2.1e-18; ADP amplitude, p = 8.2e-11. The results of each statistically significant pairwise comparison are as follows: resting Vm, NGFC-canopy (p = 0.033), NGFC-α7 (p = 2.5e-6), NGFC-VIP (p = 5.0e-5), canopy-α7 (p = 0.046); input R, NGFC-VIP (p = 5.6e-5), canopy-VIP (p = 1.1e-9), α7-VIP (p = 5.5e-9); sag amplitude, NGFC-canopy (p = 6.7e-4), NGFC-α7 (p = 1.1e-7), α7-VIP (p = 1.2e-3); time to sag min, NGFC-α7 (p = 0.040), NGFC-VIP (p = 2.5e-6), canopy-α7 (p = 7.5e-3), canopy-VIP (p = 4.0e-8); depolarizing hump amplitude, NGFC-canopy (p = 1.2e-3), NGFC-α7 (p = 0.0), NGFC-VIP (p = 1.7e-10), canopy-α7 (p = 2.6e-7), canopy-VIP (p = 2.8e-3); AP threshold, NGFC-canopy (p = 5.4e-6), NGFC-α7 (p = 1.4e-3), NGFC-VIP (p = 1.9e-11), canopy-VIP (p = 0.041), α7-VIP (p = 0.013); AP amplitude, NGFC-α7 (p = 1.4e-6), NGFC-VIP (p = 4.0e-15), canopy-α7 (p = 0.014), canopy-VIP (p = 6.3e-9), α7-VIP (p = 0.041); AP half-width, NGFC-canopy (p = 5.1e-8), NGFC-α7 (p = 1.1e-9), NGFC-VIP (p = 1.7e-7); max spike slope, NGFC-α7 (p = 1.3e-5), NGFC-VIP (p = 2.3e-12), canopy-α7 (p = 0.022), canopy-VIP (p = 1.7e-7); adaptation index, NGFC-canopy (p = 8.8e-3), NGFC-α7 (p = 2.0e-9), NGFC-VIP (p = 2.3e-13), canopy-α7 (p = 1.6e-3), canopy-VIP (p = 4.9e-6); time to first spike, NGFC-canopy (p = 0.0), NGFC-α7 (p = 1.6e-9), NGFC-VIP (p = 0.015), canopy-VIP (p = 2.9e-6), α7-VIP (p = 0.013); ADP amplitude, NGFC-canopy (p = 0.044), NGFC-α7 (p = 3.3e-6), NGFC-VIP (p = 6.2e-10), canopy-α7 (p = 0.032), canopy-VIP (p = 1.0e-4).
We performed unsupervised cluster analysis (using Ward's method) on a subset (n = 82) of cells for which a full electrophysiological analysis was performed to independently classify the recorded neurons. We used 11 electrophysiological parameters: resting membrane potential, input resistance, sag amplitude, time to sag minimum, amplitude of the near-threshold depolarizing hump, spike amplitude, spike half-width, maximum spike slope, adaptation index, time to first spike, and ADP amplitude. Unsupervised cluster analysis confirmed the presence of four electrophysiological cell groups that closely matched the molecularly defined groups (Fig. 3D). The experimental observer could distinguish cell types with a high degree of certainty using a few key properties that distinguished among cells: the long delay to first spike and lack of adaptation at threshold of NDNF/NPY cells, the active depolarizing hump at threshold for the α7 cells, the presence of onset spikes at threshold without an active depolarizing hump for the NDNF/non-NPY cells, and a high input resistance and strong adaptation for the VIP cells. However, the cluster analysis suggests that more subtle differences in many electrophysiological parameters also correlate with cell type.
L1 IN populations have characteristic morphologies
Previous studies have distinguished two types of morphologies among L1 INs: neurons with an axonal arborization largely confined to L1 and neurons that have one or more axonal collaterals descending to deeper layers (Table 1). Whether these morphological differences correlate with differences in intrinsic electrophysiological properties or whether they reflect variations within similar functional groups is not clear because studies have given different weights to these differences (Table 1). In some studies, this morphological difference is central to their classification (Hestrin and Armstrong, 1996; Zhou and Hablitz, 1996b; Christophe et al., 2002; Kubota et al., 2011; Jiang et al., 2013, 2015; Muralidhar et al., 2014), whereas others have given it less weight (Lee et al., 2010; Wozny and Williams, 2011).
We found that neurons in each molecularly defined L1 group had a characteristic morphology (Figs. 4, 5). Neurons in the two NDNF groups, NDNF/NPY and NDNF/non-NPY, had axonal arborizations largely confined to L1. Conversely, the two non-NDNF populations showed the characteristic axonal collaterals vertically descending to deeper cortical layers previously reported among some L1 INs. Although some NDNF-expressing cells, and in particular in the NDNF/non-NPY group, had few descending axonal branches, these were mostly short and branched less than those of the non-NDNF populations (Fig. 5).
Figure 4.

Morphology of the four L1 IN populations. A, Representative reconstructions of each of the four L1 IN populations. Soma is shown in black, axon in red, dendrites in blue, and L1 borders in gray. Inset shows the magnified somatodendritic profile of the α7 and VIP cells showing that the α7 cell is multipolar and the VIP cell is bipolar. B1, Bar plot showing a greater number of primary dendrites for α7 cells compared with VIP cells (p = 0.0047, Mann–Whitney U test). B2, Bar plot showing larger soma size of α7 cells compared with VIP cells (p = 0.0012, Mann–Whitney U test). C1, Bar plot showing greater proportion of the axon in L1a of canopy cells compared with NGFCs (p = 0.00033, Mann–Whitney U test). C2, Bar plot showing smaller proportion of axon in L1b of canopy cells compared with NGFCs (p = 0.00058, Mann–Whitney U test). Note that NGFCs have approximately the same proportion of their axon in L1a and L1b. D, Normalized distribution of axon for NGFCs (green) and canopy cells (orange) across L1a (pia to L1 midline), L1b (L1 midline to L1/2 border), and L2. Line indicates mean and shaded area indicates SEM. All bar plots show the mean value with SEM indicated by black bar; open circles show individual values. All morphological analysis was performed on reconstructed cells; n = 8 for NGFCs, n = 9 for canopy cells, n = 7 for α7 cells, and n = 6 for VIP cells. ** p < 0.01. *** p < 0.001.
Figure 5.
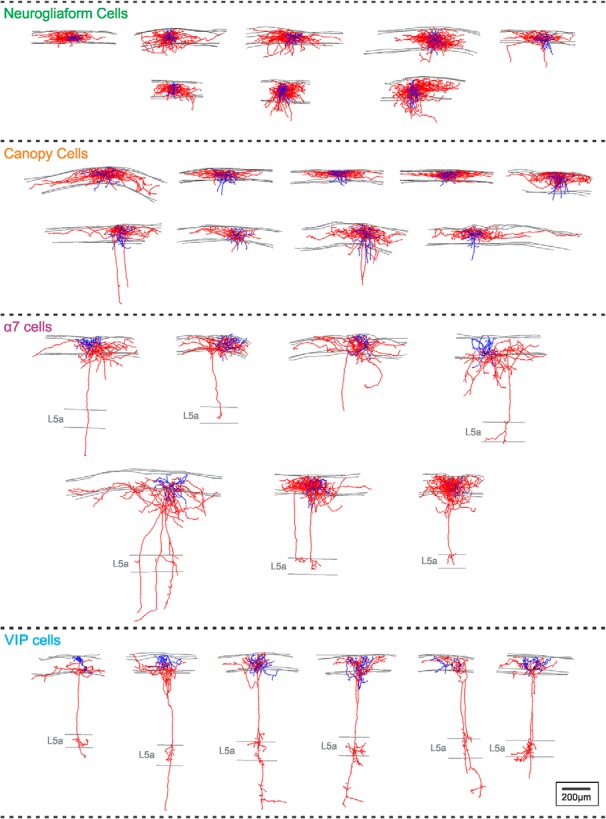
Morphology of all reconstructed L1 INs used in this study. Shown are reconstructed L1 NGFCs (n = 8), canopy cells (n = 9), α7 cells (n = 7), and VIP cells (n = 6). Somas are shown in black, axon in red, dendrites in blue, and gray lines indicate boundaries of L1 or L5a when noted. Scale bar, 200 μm for all cells.
NDNF/NPY cells (hereafter called NGFCs) had a NGFC morphology with short dendrites and a wider dense axonal arbor, which differs from NGFCs in other layers by often extending horizontally across several columns, as described previously (Hestrin and Armstrong, 1996; Zhou and Hablitz, 1996b; Kubota et al., 2011; Jiang et al., 2013, 2015; Tremblay et al., 2016). The NDNF/non-NPY cells (hereafter called canopy cells, as explained below) resemble NGFCs in having an elongated horizontal axonal arbor largely confined to L1; however, they show several significant morphological differences from NGFCs. The dendritic arbor of the canopy cells is wider than that of NGFCs (Fig. 6A; p = 0.0023; Mann–Whitney U test) and branches less (Fig. 6B; p = 0.0072, respectively; Mann–Whitney U test). The axon of the canopy cells extends further from the soma (Fig. 6D; p = 0.021; Mann–Whitney U test) and is less tortuous than the axon of NGFCs (Fig. 6E; p = 0.0024; Mann–Whitney U test). Furthermore, peak axonal density is ∼65% larger (Fig. 6G; p = 0.0152; Mann–Whitney U test) and the interbouton distance is smaller (Fig. 6F; p = 0.0016; Mann–Whitney U test) for NGFCs, resulting in a twofold difference in bouton density for the two cell types. This is particularly interesting because a high bouton density is a feature of NGFCs (Oláh et al., 2009; Overstreet-Wadiche and McBain, 2015).
Figure 6.

Morphological differences between canopy cells and NGFCs. A, Bar plot showing larger dendritic extent as max Euclidean distance from the soma for canopy cells compared with NGFCs (p = 0.0023, Mann–Whitney U test). B, Bar plot showing more dendritic branch nodes for NGFCs compared with canopy cells (p = 0.0072, Mann–Whitney U test). C, Bar plot showing no significant difference (NS) in total dendritic length for NGFCs and canopy cells (p = 0.3704, Mann–Whitney U test). D, Bar plot showing larger axonal extent as max Euclidean distance from the soma for canopy cells compared with NGFCs (p = 0.0206, Mann–Whitney U test). E, Bar plot showing greater tortuosity for NGFC axons compared with canopy cell axons (p = 0.0024, Mann–Whitney U test); minimal possible value for tortuosity is 1. F, Bar plot showing lower interbouton distance (larger bouton density) for NGFC axons compared with canopy cell axons (p = 0.0016, Mann–Whitney U test). G, Plot showing the average horizontal distribution of axonal density for NGFCs (green) and canopy cells (orange) centered on peak axonal density (vertical bars indicate SEM). NGFCs have a greater axonal density at their peak compared with canopy cells (p = 0.0152, Mann–Whitney U test). All bar plots show the mean value with SEM indicated by black bar; open circles show individual values (n = 8 for NGFCs, n = 9 for canopy cells). All morphological analysis was performed on reconstructed cells. * p < 0.05. ** p < 0.01.
Interestingly, we also found that the axonal arbor of the two NDNF populations had a different distribution within L1: whereas the axon of NGFCs tends to occupy the whole layer, the axon of the canopy cells is strongly biased toward the upper half of L1, and is rarely found in L2 (Fig. 4C,D; L1a: p = 3.3e-4; L1b: p = 5.8e-4; Mann–Whitney U test). The extended axon of the NDNF/non-NPY cells makes a layer of inhibitory axons in the top surface of layer 1, so we propose naming these neurons “canopy cells.”
L1 VIP cells resemble the bipolar VIP INs in L2/3, with a descending axon that projects through the cortical column (Lee et al., 2010; Prönneke et al., 2015). However, their bipolar dendrite has a more horizontal orientation (Fig. 4A, inset). The descending axonal collaterals of L1 VIP cells branch in L5A, a cortical sublayer that often receives projections from similar sources as L1 and then continue into L5B, often reaching layer 6 (Figs. 4, 5). α7 cells have multipolar dendrites unlike the bipolar dendritic arbor of VIP cells (Fig. 4A,B1, inset; p = 0.0047; Mann–Whitney U test). Like VIP cells, α7 cells have one or more vertically descending axonal collaterals that go deep into the column. They usually branch in L5A, but often terminate there, in contrast to VIP cells (Figs. 4A, 5). The two non-NDNF populations also differ significantly in the size of their somata (Fig. 4B2; p = 0.0012; Mann–Whitney U test).
The two NDNF populations have similar morphologies but very distinct electrophysiological properties. Conversely, canopy cells and α7 neurons resemble each other electrophysiologically (Fig. 3) but are distinguishable morphologically. Therefore, morphology and electrophysiology together allow conclusive segregation of cell types in L1. In addition, we find that the four IN populations differ in their distribution within the layer (Fig. 7). The combined molecular, electrophysiological, and morphological analysis strongly indicates that L1 INs consist of four distinct neuronal populations. Table 2 summarizes the molecular, electrophysiological, and morphological differences among the four neuronal populations described in this study.
Figure 7.

Distribution of L1 IN subtype somas within L1. Shown is a plot of the normalized distances of soma position from pia (0%) to the L1/2 border (100%) of recorded L1 INs, demonstrating the sublaminar distribution of L1 IN subtypes. Included are all the cells in our database of recorded L1 interneurons used in Figure 3 for which soma position information was available. Diamonds indicate mean soma position for each L1 IN population; bars indicate SEM. The Kruskal–Wallis test was used to determine the significance of soma position differences (p = 1.0e-5) and subsequent pairwise comparisons were performed using Dunn's test with a Šidák correction; results are as follows: canopy cells and NGFCs, p = 0.24; canopy cells and α7 cells, p = 0.0027; canopy cells and VIP cells, p = 1.0e-5; NGFCs and α7 cells, p = 0.61; NGFCs and VIP cells, p = 0.039; α7 cells and VIP cells, p = 0.75. NS, Not significant at p < 0.05. NGFCs, n = 20; canopy cells, n = 24; α7 cells, n = 19; VIP cells, n = 18. * p < 0.05. ** p < 0.01. *** p < 0.0001.
NGFC and canopy cells differ in connectivity
The two NDNF populations, NGFCs and canopy cells, also differ in their connectivity to L2 PCs and each other, supporting the notion that they represent distinct IN subtypes (Figs. 8, 9). The probability of detecting connections (usually called “connection probability”) between NGFCs and L2 PCs was very high (Fig. 8C; 72%, n = 13/18 connections tested), similar to what has been reported for NGFCs in L2/3 (Szabadics et al., 2007), as well as for those in L1 in some studies (Lee et al., 2015). Conversely, the probability of detecting connections between canopy cells and L2 PCs was significantly lower (Fig. 8C; 18%, n = 8/45 connections tested; p = 7.2e-5; Fisher's exact test). This low connection probability is unlikely due to cut PC dendrites given the high probability of connection that we observed with NGFCs and that the axonal arbor of both NDNF cell types is in the same plane. Furthermore, the unitary synaptic strength of NGFCs to L2 PCs was much greater than that of the connections made by canopy cells (Fig. 8B,D; p = 7.6e-4; Mann–Whitney U test). There were also significant differences in the synapses that the two NDNF INs made with each other. NGFCs and canopy cells were reciprocally connected and the probability of detecting connections was high in both directions (Fig. 9A). However, the unitary strength of connections made by NGFCs onto canopy cells was significantly greater than the connections made by canopy cells onto NGFCs (Fig. 9B; p = 0.012; Mann–Whitney U test). Canopy cells have a larger proportion of their axon in the superficial half of L1 compared with NGFCs (Figs. 4C,D, 5). Inputs from canopy cells on PCs may thus be more subject to dendritic filtering and this may contribute at least in part to the apparent difference in synaptic strength recorded at the PC soma.
Figure 8.

Differential connectivity of NGFCs and canopy cells with L2 PCs. A, Schematic of paired recording experiments; a L2 PC and either a L1 NGFC or a L1 canopy cell were simultaneously patched. B, Example of the IPSP generated on a L2 PC by a single AP in an NGFC (top traces) or a canopy cell (bottom traces). Shown are the IPSPs obtained before (black traces) and after (gray traces) bath application of the GABAB receptor blocker CGP-35348 (60 μm), showing a prominent GABAB component elicited by NGFCs, but not canopy cells. Shown are averages of at least 20 sweeps. Scale bars, 0.6 mV and 100 ms. Postsynaptic PCs were held in current clamp at ∼−55 mV. IPSPs shown were low-pass filtered at 1 kHz to remove high-frequency noise. C, Pie charts showing probability of connection between NGFCs (top) or canopy cells (bottom) and L2 PCs; NGFCs were more likely than canopy cells to elicit an IPSP in L2 PCs (p = 7.2e-5; Fisher's exact test; NGFCs, n = 13/18 tested connections; canopy cells, n = 8/45 tested connections). D, Bar plot showing mean IPSP amplitude in L2 PCs elicited by an AP in NGFCs or canopy cells; black bar indicates SEM. NGFCs elicited significantly larger IPSPs in L2 PCs compared with the IPSPs elicited by canopy cells (p = 0.00076, Mann–Whitney U test). E, Plot showing area under the curve of IPSPs elicited by NGFCs (left, green) and canopy cells (right, orange) before and after CGP-35348 application; lines connect the responses of individual PCs. Only IPSPs elicited by NGFCs had a significant GABAB component (p = 0.031, Wilcoxon signed-rank test). NS, Not significant at p < 0.05. * p < 0.05. *** p < 0.001.
Figure 9.

Differential interconnectivity between NGFC and canopy cells. A, Schematic of the connectivity between NGFCs and canopy cells and the probability of connection in each direction. Dendrites are shown in black and axons in gray. B, Bar plot showing the mean IPSP in canopy cells elicited by an AP in NGFCs (orange) and the mean IPSP in NGFCs elicited by an AP in canopy cells (green); black bar indicates SEM. The IPSPs in canopy cells were significantly greater than the IPSPs in NGFCs (p = 0.012, Mann–Whitney U test). C, Example IPSP in a canopy cell elicited by an AP in a connected NGFC (orange trace) and an example IPSP in an NGFC elicited by an AP in a connected canopy cell (green trace); these responses are from a reciprocally connected pair. Scale bars, 1 mV and 25 ms. IPSPs shown were low-pass filtered at 1 kHz to remove high-frequency noise. All cells were held in current clamp at ∼−55 mV. NGFC to canopy cell pairs, n = 9/9 tested connections; canopy cell to NGFC pairs, n = 6/8 tested connections. * p < 0.05.
NGFCs have unique synaptic properties that distinguish them from other GABAergic interneurons. It has been suggested that NGFCs release GABA to the extracellular space via volume transmission (Oláh et al., 2009), allowing GABA to bind receptors along the entire dendritic arbor of PCs and other INs. Indeed, this phenomenon may explain their high connection probability to most cell types (Szabadics et al., 2007). NGFCs stand out among GABAergic INs for their ability to produce GABAB responses in connected postsynaptic targets (Hestrin and Armstrong, 1996; Wozny and Williams, 2011; Cruikshank et al., 2012; Jiang et al., 2013). GABAB receptors display high affinity for GABA, slow G-protein-coupled mediated signaling, and a predominantly extrasynaptic localization (Gonzalez-Burgos, 2010). The concerted firing of several INs or high-frequency firing of a single interneuron are thought to release enough GABA to activate extrasynaptic receptors (Mody et al., 1994; Thomson et al., 1996; Kim et al., 1997; Thomson and Destexhe, 1999; Scanziani, 2000). For example, a single FS IN in auditory cortex can produce GABAB responses on connected PCs when stimulated at 80 Hz (Oswald et al., 2009). Likewise, repetitive firing of SST INs has been shown to produce GABAB responses as well (Urban-Ciecko et al., 2015). However, NGFCs are the only INs that have been shown so far to elicit robust unitary GABAB responses in response to a single AP (Tamás et al., 2003; Price et al., 2005, 2008; Wozny and Williams, 2011). Consistent with observations in other studies, we find robust unitary GABAB responses in L1 NGFC connections with L2 PCs, representing a significant proportion of the PSP elicited by NGFC stimulation (Fig. 8B,E; p = 0.031; Wilcoxon signed-rank test). Conversely, the PSP from canopy cells contains no significant GABAB component (Fig. 8B,E; NS, not significant at p < 0.05, Wilcoxon signed-rank test).
Discussion
In this study, we describe evidence based on a combined molecular, electrophysiological, and morphological analysis for the presence of four interneuron populations in L1 of the mouse barrel cortex: NGFCs, canopy cells, α7 cells, and VIP cells. The molecularly defined groups correlated with electrophysiological and morphological groups, providing confidence for the proposed classification. Two of the four L1 IN populations, the canopy and α7 cells, are almost exclusively present in L1. NGFCs and VIP INs are present in other layers, but have unique properties in L1 of potential physiological significance. L1 NGFCs have an extended axonal arbor that spans more than one column. Called “elongated NGFCs” by some investigators, they can inhibit PCs in neighboring columns (Jiang et al., 2013, 2015) compared with the small spherical morphology of NGFCs in other layers. Conversely, although L1 VIP cells resemble bipolar VIP cells in L2-6, their bipolar dendrite is oriented horizontally (Fig. 4), whereas the dendritic trees of bipolar VIP INs in other layers are narrow and oriented vertically, crossing several layers in either direction (Lee et al., 2013; Prönneke et al., 2015). They are able to sample inputs in several layers, but are restricted horizontally and thus are capable of producing topographically organized disinhibition (Zhang et al., 2014). Therefore, L1 appears to have several specialized IN populations that participate in its unique circuitry.
Although further studies may reveal additional diversity within the groups described here, the evidence suggests that we have identified the major interneuron populations within L1. Comparative histological analysis indicates that the same populations are present in L1 across different cortical areas (data not shown), so our findings likely reflect general principles of L1 organization throughout the neocortex. Consistent with this idea, a recent comparative analysis of IN single-cell transcriptomes reported broad conservation of molecularly defined IN subtypes across visual and premotor (ALM) cortices (Tasic et al., 2018). This study expanded upon earlier work (Tasic et al., 2016) that delineated two primary NDNF populations, NDNF/Car4 and NDNF/Cxcl14, that may correspond to our L1 NGFC and canopy cell types, respectively. However, closer examination of these data indicated that a substantial fraction of cells clustered within the NDNF/Cxcl14 category were actually non-NDNF expressing and likely included the α7 cells reported here. This heterogeneity within the original NDNF/Cxcl14 cluster has now been reanalyzed at much higher resolution in a more recent study (Tasic et al., 2018), which outlines four Lamp5 clusters (Egln3 and Pax6 subcategories) putatively spanning our canopy and α7 types and a fifth (Lamp5/Pdlim5) that likely corresponds to our L1 NGFC type. An important caveat to this interpretation is that it is not yet clear how the genome-wide transcriptomic variations that drive cell-type clustering correspond to specific cell properties (e.g., axonal morphology) that confer cell-type identity at a functional level.
Some L2/3 INs also have significant dendritic processes in L1. Chandelier cells are enriched in L2 and contain a dendritic arborization mostly in L1, often reaching the cortical surface (Woodruff et al., 2011; Miyamae et al., 2017). The ascending dendrite of L2/3 bipolar VIP INs extends throughout L1 (Lee et al., 2013; Prönneke et al., 2015) and VIP-CCK cells, concentrated at the L1–2 border, also have a significant proportion of their dendrites in L1 (He et al., 2016). Therefore, these neurons can also be targets of L1 inputs and should be considered part of the L1 circuitry (Fig. 1A). Together with the four IN populations in L1, these cells can gate information flow to the tuft dendrites of PCs and provide “context” to the “content” of the sensory input arriving at their basal dendrites (Larkum, 2013). Our elucidation of the IN subtypes residing in L1 provides a new framework to study the mechanisms by which top-down information is integrated.
Relationship to previous efforts to elucidate L1 IN diversity
The discovery of molecular markers that correlate with IN morphological and electrophysiological properties has greatly facilitated the resolution of L1 IN subtypes. L1 INs can be divided into two major electrophysiological groups: cells that fire at threshold following a delay and show little spike frequency adaptation (LS), as in NGFCs, and cells that have onset spike(s) and adapting spike trains (non-LS), as in the canopy, α7, and VIP cells. Although most studies of L1 INs (Table 1) agree on the presence of these two types of firing patterns, the challenge has been dissecting the adapting populations, resulting in a lack of agreement among different studies and a confusing picture. The expression of NDNF, NPY, α7 nAChRs, and VIP facilitated the discovery of differences that helped distinguish the three non-LS subtypes. Similarly, most studies that used morphology to determine L1 INs agree on the presence of cells that have an axonal arborization largely confined to L1 (as in NGFCs and canopy cells) and cells that have vertically descending axon collaterals that project deep into the column (as in the α7 and VIP cells), a feature noticed in the earliest studies of the anatomy of L1 cells (Hestrin and Armstrong, 1996; Zhou and Hablitz, 1996b), as well as studies by Ramon y Cajal and Schaffer (cited in Ramon and Cajal et al., 1988). NPY expression and the presence or absence of delayed spiking facilitated the discovery of subtler morphological differences between the two cell types with axon confined to L1. Likewise, the expression of VIP or α7 nAChRs and the differences in firing pattern between these cells facilitated the discovery of dendritic and axonal differences between the two cell types with descending axonal collaterals.
Using morphological criteria, Jiang and colleagues (Zhu and Zhu, 2004; Jiang et al., 2013; Jiang et al., 2015) classified L1 neurons into elongated NGFCs and single-bouquet cells (SBCs), which were characterized by having vertically descending axon collaterals. SBCs received their name because they resembled, in the view of the investigators, double bouquet cells, which have a descending “horsetail” axonal bundle and have been described in human and primate neocortex (Yáñez et al., 2005). Jiang et al. (2013, 2015), distinguished two types of firing patterns: LS with no firing frequency adaptation and non-LS adapting. The majority of the elongated NGFCs (∼90%) were LS non-adapting, whereas the majority (∼95%) of the SBCs were non-LS adapting. SBCs likely include both the VIP and α7 cells because both have vertically descending axon collaterals and non-LS adapting firing patterns. Furthermore, it is likely that their SBC group also includes canopy cells, which we sometimes observe have short vertically descending collaterals (Fig. 5). Some canopy cells might have also been included in the elongated NGFC group and might be responsible for the 10% that had a non-LS adapting firing pattern. Similarly, a study by Hestrin and Armstrong (1996) described two types of L1 INs: NGFCs with horizontally extended axons confined to L1 with a non-adapting firing pattern and cells with descending axons and stronger adaptation. The investigators suggested that this population might be VIP INs, but it also likely includes other adapting cell types, such as the α7 and canopy cells. Furthermore, it is possible that canopy cells were also among the 30% of L1 INs that were left uncharacterized in this study.
A large study by Wozny and Williams (2011) used a combined morphological and electrophysiological characterization of L1 INs in the rat somatosensory cortex. That study described two major populations: non-adapting NGFCs and classical-accommodating (c-AC) cells, together accounting for ∼80% of L1 cells. The c-AC population of Wozny and Williams (2011), the largest population in their study (52% of L1), likely included canopy and α7 cells, both of which have adapting or “classical accommodating” firing patterns (Gupta et al., 2000). In support of this hypothesis, Wozny and Williams (2011) report that 62% of the c-AC cells had an axonal arbor confined to L1 (as in canopy cells), whereas 38% had collaterals descending to deeper layers (as in α7 cells). Furthermore, the c-AC cell illustrated in their supplementary Figure 2B resembles our α7 cells (as well as a cell illustrated on the cover of the issue containing the paper). Conversely, a c-AC cell shown in a follow-up paper by this group strongly resembles our canopy cells (Fig. 1B in Brombas et al., 2014). Wozny and Williams (2011) also described two minor populations of L1 INs: strongly adapting bursting cells (13%), which likely correspond to VIP neurons, and fast-spiking interneurons that were mostly chandelier cells, accounting for 9% of L1 INs. In the mouse, chandelier cells are highly enriched in the upper part of L2, near the border with L1 (Woodruff et al., 2009; Woodruff et al., 2011; Taniguchi et al., 2013), but are rarely seen in L1 proper (of the 409 cells that we recorded in L1, we only observed two fast-spiking cells; data not shown). However, it is possible that some somas of chandelier cells are actually present in L1 in the rat neocortex. Interestingly, in a later study by this group, Brombas et al. (2014) found that NGFCs and c-AC cells differ in cholinergic neuromodulation, with NGFCs, but not c-AC cells, displaying powerful muscarinic receptor mediated inhibition. If, as we suggest, canopy cells are a major component of the c-AC cells, then NGFCs and canopy cells may also differ in their response to ACh.
Cruikshank et al., 2012 used electrophysiology to characterize L1 INs in the mouse prefrontal cortex. They classified L1 INs into three groups: LS, non-LS, and “other.” The “other” group consisted of non-LS neurons that differed in a number of properties from non-LS cells and were therefore grouped separately. Non-LS cells likely correspond mostly to our α7 neurons. Non-LS cells resembled α7 neurons in their adaptation, voltage sag, onset spiking, and soma position toward the bottom half of L1. It is possible that canopy cells were mostly in the “other” group of Cruikshank et al. (2012).
Sublaminar structure of layer 1
Although L1 is a thin cortical layer, previous anatomical studies have suggested that it might consist of specialized sublayers (Jones and Powell, 1970; Vogt, 1991; Cruikshank et al., 2012; Roth et al., 2016). Our analysis of the laminar organization of L1 INs supports this view. The sublaminar organization of L1 INs is particularly clear when considering the location of their axons (Figs. 4, 5). Although the axons of NGFCs are distributed throughout the layer, the axons of the canopy cells are concentrated in the upper half (Figs. 4C1,C2,D, 5). Recent studies suggest that the axons of Martinotti cells also exhibit sublaminar specificity within L1. Muñoz et al. (2017) recently described two types of Martinotti cells in L5 that differed in the morphology of their ascending axon, specifically its distribution within L1. The ascending axon of “fanning-out” Martinotti cells branches extensively in L2/3 and the lower part of L1, whereas the axon of “T-shape” Martinotti cells ascends with little branching toward the pia and branches horizontally in the upper half of L1 (Muñoz et al., 2017). Similarly, although some long-range excitatory projections occupy the full extent of L1, many of them tend to be concentrated in either the upper or lower half of the layer. For instance, the projections of paralaminar and midline thalamic nuclei to medial prefrontal cortex are concentrated in the upper half of L1, whereas corticocortical axons tend to be concentrated in the lower half (see Fig. 5 in Cruikshank et al., 2012). These data suggest that excitatory and inhibitory axons in L1 target specific subtypes of pyramidal cells that have tuft dendrites distributed in different parts of the layer (see supplemental Fig. S3 in Narayanan et al., 2015) and/or target different compartments (distal vs proximal) of the pyramidal cell tuft dendrite.
Our results demonstrate that L1 contains four unique interneuron populations, each with a distinct molecular, morphological, and electrophysiological profile. Differences in connectivity and axonal localization among L1 INs strongly indicate that a division of labor exists for how they process contextual input. With axons that span horizontally across multiple cortical columns and axons that descend deep into the cortical column, the INs of L1 are privileged and may powerfully regulate the influence of contextual information on processing in nearby columns and lamina. Elucidating the distinct roles of each of these L1 circuit components and how they contribute to the integration of contextual information with feedforward sensory input will be critical to understanding sensory perception.
Footnotes
This work was supported by the National Institutes of Health (Grant P01NS074972 to B.R. and G.F. and Grant F31NS106793 to B.S.). We thank Robin Tremblay, Robert Egger, and members of the Rudy and Fishell laboratories for helpful discussions and advice.
The authors declare no competing financial interests.
References
- Binzegger T, Douglas RJ, Martin KA (2004) A quantitative map of the circuit of cat primary visual cortex. J Neurosci 24:8441–8453. 10.1523/JNEUROSCI.1400-04.2004 [DOI] [PMC free article] [PubMed] [Google Scholar]
- Boyle MP, Bernard A, Thompson CL, Ng L, Boe A, Mortrud M, Hawrylycz MJ, Jones AR, Hevner RF, Lein ES (2011) Cell-type-specific consequences of reelin deficiency in the mouse neocortex, hippocampus, and amygdala. J Comp Neurol 519:2061–2089. 10.1002/cne.22655 [DOI] [PubMed] [Google Scholar]
- Brombas A, Fletcher LN, Williams SR (2014) Activity-dependent modulation of layer 1 inhibitory neocortical circuits by acetylcholine. J Neurosci 34:1932–1941. 10.1523/jneurosci.4470-13.2014 [DOI] [PMC free article] [PubMed] [Google Scholar]
- Cauller L. (1995) Layer I of primary sensory neocortex: where top-down converges upon bottom-up. Behav Brain Res 71:163–170. 10.1016/0166-4328(95)00032-1 [DOI] [PubMed] [Google Scholar]
- Chittajallu R, Pelkey KA, McBain CJ (2013) Neurogliaform cells dynamically regulate somatosensory integration via synapse-specific modulation. Nat Neurosci 16:13–15. 10.1038/nn.3284 [DOI] [PMC free article] [PubMed] [Google Scholar]
- Christophe E, Roebuck A, Staiger JF, Lavery DJ, Charpak S, Audinat E (2002) Two types of nicotinic receptors mediate an excitation of neocortical layer I interneurons. J Neurophysiol 88:1318–1327. 10.1152/jn.2002.88.3.1318 [DOI] [PubMed] [Google Scholar]
- Chu Z1, Galarreta M, Hestrin S (2003) Synaptic interactions of late-spiking neocortical neurons in layer 1. J Neurosci 23:96–102. 10.1523/jneurosci.23-01-00096.2003 [DOI] [PMC free article] [PubMed] [Google Scholar]
- Cruikshank SJ, Ahmed OJ, Stevens TR, Patrick SL, Gonzalez AN, Elmaleh M, Connors BW (2012) Thalamic control of layer 1 circuits in prefrontal cortex. J Neurosci 32:17813–17823. 10.1523/JNEUROSCI.3231-12.2012 [DOI] [PMC free article] [PubMed] [Google Scholar]
- D'Souza RD, Burkhalter A (2017) A laminar organization for selective cortico-cortical communication. Front Neuroanat 11:71. 10.3389/fnana.2017.00071 [DOI] [PMC free article] [PubMed] [Google Scholar]
- Eakin GS, Hadjantonakis AK (2006) Production of chimeras by aggregation of embryonic stem cells with diploid or tetraploid mouse embryos. Nat Protoc 1:1145–1153. 10.1038/nprot.2006.173 [DOI] [PMC free article] [PubMed] [Google Scholar]
- Garcia-Munoz M, Arbuthnott GW (2015) Basal ganglia-thalamus and the “crowning enigma”. Front Neural Circuits 9:71. 10.3389/fncir.2015.00071 [DOI] [PMC free article] [PubMed] [Google Scholar]
- Gentet LJ, Kremer Y, Taniguchi H, Huang ZJ, Staiger JF, Petersen CC (2012) Unique functional properties of somatostatin-expressing GABAergic neurons in mouse barrel cortex. Nat Neurosci 15:607–612. 10.1038/nn.3051 [DOI] [PubMed] [Google Scholar]
- Gilbert CD, Li W (2013) Top-down influences on visual processing. Nat Rev Neurosci 14:350–363. 10.1038/nrn3476 [DOI] [PMC free article] [PubMed] [Google Scholar]
- Gilbert CD, Sigman M (2007) Brain states: top-down influences in sensory processing. Neuron 54:677–696. 10.1016/j.neuron.2007.05.019 [DOI] [PubMed] [Google Scholar]
- Gonchar Y, Wang Q, Burkhalter A (2007) Multiple distinct subtypes of GABAergic neurons in mouse visual cortex identified by triple immunostaining. Front Neuroanat 1:3. 10.3389/neuro.05.003.2007 [DOI] [PMC free article] [PubMed] [Google Scholar]
- Gonzalez-Burgos G. (2010) GABA transporter GAT1: a crucial determinant of GABAB receptor activation in cortical circuits? Adv Pharmacol 58:175–204. 10.1016/S1054-3589(10)58008-6 [DOI] [PubMed] [Google Scholar]
- Gupta A, Wang Y, Markram H (2000) Organizing principles for a diversity of GABAergic interneurons and synapses in the neocortex. Science 287:273–278. 10.1126/science.287.5451.273 [DOI] [PubMed] [Google Scholar]
- He M, Tucciarone J, Lee S, Nigro MJ, Kim Y, Levine JM, Kelly SM, Krugikov I, Wu P, Chen Y, Gong L, Hou Y, Osten P, Rudy B, Huang ZJ (2016) Strategies and tools for combinatorial targeting of GABAergic neurons in mouse cerebral cortex. Neuron 91:1228–1243. 10.1016/j.neuron.2016.08.021 [DOI] [PMC free article] [PubMed] [Google Scholar]
- Hestrin S, Armstrong WE (1996) Morphology and physiology of cortical neurons in layer I. J Neurosci 16:5290–5300. 10.1523/JNEUROSCI.16-17-05290.1996 [DOI] [PMC free article] [PubMed] [Google Scholar]
- Hubel DH. (1982) Cortical neurobiology: a slanted historical perspective. Annu Rev Neurosci 5:363–370. 10.1146/annurev.ne.05.030182.002051 [DOI] [PubMed] [Google Scholar]
- Ibrahim LA, Mesik L, Ji XY, Fang Q, Li HF, Li YT, Zingg B, Zhang LI, Tao HW (2016) Cross-modality sharpening of visual cortical processing through layer-1-mediated inhibition and disinhibition. Neuron 89:1031–1045. 10.1016/j.neuron.2016.01.027 [DOI] [PMC free article] [PubMed] [Google Scholar]
- Jahnsen H, Llinás R (1984) Electrophysiological properties of guinea-pig thalamic neurones: an in vitro study. J Physiol 349:205–226. 10.1113/jphysiol.1984.sp015153 [DOI] [PMC free article] [PubMed] [Google Scholar]
- Jiang X, Wang G, Lee AJ, Stornetta RL, Zhu JJ (2013) The organization of two new cortical interneuronal circuits. Nat Neurosci 16:210–218. 10.1038/nn.3305 [DOI] [PMC free article] [PubMed] [Google Scholar]
- Jiang X, Shen S, Cadwell CR, Berens P, Sinz F, Ecker AS, Patel S, Tolias AS (2015) Principles of connectivity among morphologically defined cell types in adult neocortex. Science 350:aac9462. 10.1126/science.aac9462 [DOI] [PMC free article] [PubMed] [Google Scholar]
- Jones EG, Powell TP (1970) Electron microscopy of the somatic sensory cortex of the cat. II. The fine structure of layers I and II. Philos Trans R Soc Lond B Biol Sci 257:13–21. 10.1098/rstb.1970.0004 [DOI] [PubMed] [Google Scholar]
- Kim U, Sanchez-Vives MV, McCormick DA (1997) Functional dynamics of GABAergic inhibition in the thalamus. Science 278:130–134. 10.1126/science.278.5335.130 [DOI] [PubMed] [Google Scholar]
- Kruglikov I, Talbot Z, Bayer L, Ahmed AZ, Machold R, Rudy B (2014) Tyrosine protein kinase kit (c-kit) protein as a marker for supragranular neurogliaform cells in the neocortex. Soc Neurosci Abstr 40:535.21/II27. [Google Scholar]
- Kubota Y, Shigematsu N, Karube F, Sekigawa A, Kato S, Yamaguchi N, Hirai Y, Morishima M, Kawaguchi Y (2011) Selective coexpression of multiple chemical markers defines discrete populations of neocortical GABAergic neurons. Cereb Cortex 21:1803–1817. 10.1093/cercor/bhq252 [DOI] [PubMed] [Google Scholar]
- Larkum M. (2013) A cellular mechanism for cortical associations: an organizing principle for the cerebral cortex. Trends Neurosci 36:141–151. 10.1016/j.tins.2012.11.006 [DOI] [PubMed] [Google Scholar]
- Lee AJ, Wang G, Jiang X, Johnson SM, Hoang ET, Lanté F, Stornetta RL, Beenhakker MP, Shen Y, Julius Zhu J (2015) Canonical organization of layer 1 neuron-led cortical inhibitory and disinhibitory interneuronal circuits. Cereb Cortex 25:2114–2126. 10.1093/cercor/bhu020 [DOI] [PMC free article] [PubMed] [Google Scholar]
- Lee S, Hjerling-Leffler J, Zagha E, Fishell G, Rudy B (2010) The largest group of superficial neocortical GABAergic interneurons expresses ionotropic serotonin receptors. J Neurosci 30:16796–16808. 10.1523/JNEUROSCI.1869-10.2010 [DOI] [PMC free article] [PubMed] [Google Scholar]
- Lee S, Kruglikov I, Huang ZJ, Fishell G, Rudy B (2013) A disinhibitory circuit mediates motor integration in the somatosensory cortex. Nat Neurosci 16:1662–1670. 10.1038/nn.3544 [DOI] [PMC free article] [PubMed] [Google Scholar]
- Lein ES, Hawrylycz MJ, Ao N, Ayres M, Bensinger A, Bernard A, Boe AF, Boguski MS, Brockway KS, Byrnes EJ, Chen L, Chen L, Chen TM, Chin MC, Chong J, Crook BE, Czaplinska A, Dang CN, Datta S, Dee NR, et al. (2007) Genome-wide atlas of gene expression in the adult mouse brain. Nature 445:168–176. 10.1038/nature05453 [DOI] [PubMed] [Google Scholar]
- Letzkus JJ, Wolff SB, Meyer EM, Tovote P, Courtin J, Herry C, Lüthi A (2011) A disinhibitory microcircuit for associative fear learning in the auditory cortex. Nature 480:331–335. 10.1038/nature10674 [DOI] [PubMed] [Google Scholar]
- Llinás R, Jahnsen H (1982) Electrophysiology of mammalian thalamic neurones in vitro. Nature 297:406–408. 10.1038/297406a0 [DOI] [PubMed] [Google Scholar]
- Madisen L, Garner AR, Shimaoka D, Chuong AS, Klapoetke NC, Li L, van der Bourg A, Niino Y, Egolf L, Monetti C, Gu H, Mills M, Cheng A, Tasic B, Nguyen TN, Sunkin SM, Benucci A, Nagy A, Miyawaki A, Helmchen F, et al. (2015) Transgenic mice for intersectional targeting of neural sensors and effectors with high specificity and performance. Neuron 85:942–958. 10.1016/j.neuron.2015.02.022 [DOI] [PMC free article] [PubMed] [Google Scholar]
- Madisen L, Zwingman TA, Sunkin SM, Oh SW, Zariwala HA, Gu H, Ng LL, Palmiter RD, Hawrylycz MJ, Jones AR, Lein ES, Zeng H (2010) A robust and high-throughput cre reporting and characterization system for the whole mouse brain. Nat Neurosci 13:133–140. 10.1038/nn.2467 [DOI] [PMC free article] [PubMed] [Google Scholar]
- Marín-Padilla M. (1992) Ontogenesis of the pyramidal cell of the mammalian neocortex and developmental cytoarchitectonics: a unifying theory. J Comp Neurol 321:223–240. 10.1002/cne.903210205 [DOI] [PubMed] [Google Scholar]
- McCormick DA, Huguenard JR (1992) A model of the electrophysiological properties of thalamocortical relay neurons. J Neurophysiol 68:1384–1400. 10.1152/jn.1992.68.4.1384 [DOI] [PubMed] [Google Scholar]
- Mechawar N, Cozzari C, Descarries L (2000) Cholinergic innervation in adult rat cerebral cortex: a quantitative immunocytochemical description. J Comp Neurol 428:305–318. [DOI] [PubMed] [Google Scholar]
- Miyamae T, Chen K, Lewis DA, Gonzalez-Burgos G (2017) Distinct physiological maturation of parvalbumin-positive neuron subtypes in mouse prefrontal cortex. J Neurosci 37:4883–4902. 10.1523/JNEUROSCI.3325-16.2017 [DOI] [PMC free article] [PubMed] [Google Scholar]
- Miyoshi G, Hjerling-Leffler J, Karayannis T, Sousa VH, Butt SJ, Battiste J, Johnson JE, Machold RP, Fishell G (2010) Genetic fate mapping reveals that the caudal ganglionic eminence produces a large and diverse population of superficial cortical interneurons. J Neurosci 30:1582–1594. 10.1523/JNEUROSCI.4515-09.2010 [DOI] [PMC free article] [PubMed] [Google Scholar]
- Mody I, De Koninck Y, Otis TS, Soltesz I (1994) Bridging the cleft at GABA synapses in the brain. Trends Neurosci 17:517–525. 10.1016/0166-2236(94)90155-4 [DOI] [PubMed] [Google Scholar]
- Muñoz W, Tremblay R, Rudy B (2014) Channelrhodopsin-assisted patching: in vivo recording of genetically and morphologically identified neurons throughout the brain. Cell Rep 9:2304–2316. 10.1016/j.celrep.2014.11.042 [DOI] [PMC free article] [PubMed] [Google Scholar]
- Muñoz W, Tremblay R, Levenstein D, Rudy B (2017) Layer-specific modulation of neocortical dendritic inhibition during active wakefulness. Science 355:954–959. 10.1126/science.aag2599 [DOI] [PubMed] [Google Scholar]
- Murayama M, Pérez-Garci E, Nevian T, Bock T, Senn W, Larkum ME (2009) Dendritic encoding of sensory stimuli controlled by deep cortical interneurons. Nature 457:1137–1141. 10.1038/nature07663 [DOI] [PubMed] [Google Scholar]
- Muralidhar S, Wang Y, Markram H (2014) Synaptic and cellular organization of layer 1 of the developing rat somatosensory cortex. Front Neuroanat 7:52. 10.3389/fnana.2013.00052 [DOI] [PMC free article] [PubMed] [Google Scholar]
- Narayanan RT, Egger R, Johnson AS, Mansvelder HD, Sakmann B, de Kock CP, Oberlaender M (2015) Beyond columnar organization: cell type- and target layer-specific principles of horizontal axon projection patterns in rat vibrissal cortex. Cereb Cortex 25:4450–4468. 10.1093/cercor/bhv053 [DOI] [PMC free article] [PubMed] [Google Scholar]
- Neske GT, Patrick SL, Connors BW (2015) Contributions of diverse excitatory and inhibitory neurons to recurrent network activity in cerebral cortex. J Neurosci 35:1089–1105. 10.1523/JNEUROSCI.2279-14.2015 [DOI] [PMC free article] [PubMed] [Google Scholar]
- Oláh S, Füle M, Komlósi G, Varga C, Báldi R, Barzó P, Tamás G (2009) Regulation of cortical microcircuits by unitary GABA-mediated volume transmission. Nature 461:1278–1281. 10.1038/nature08503 [DOI] [PMC free article] [PubMed] [Google Scholar]
- Oswald AM, Doiron B, Rinzel J, Reyes AD (2009) Spatial profile and differential recruitment of GABAB modulate oscillatory activity in auditory cortex. J Neurosci 29:10321–10334. 10.1523/JNEUROSCI.1703-09.2009 [DOI] [PMC free article] [PubMed] [Google Scholar]
- Overstreet-Wadiche L, McBain CJ (2015) Neurogliaform cells in cortical circuits. Nat Rev Neurosci 16:458–468. 10.1038/nrn3969 [DOI] [PMC free article] [PubMed] [Google Scholar]
- Palmer LM, Schulz JM, Murphy SC, Ledergerber D, Murayama M, Larkum ME (2012) The cellular basis of GABA(B)-mediated interhemispheric inhibition. Science 335:989–993. 10.1126/science.1217276 [DOI] [PubMed] [Google Scholar]
- Price CJ, Cauli B, Kovacs ER, Kulik A, Lambolez B, Shigemoto R, Capogna M (2005) Neurogliaform neurons form a novel inhibitory network in the hippocampal CA1 area. J Neurosci 25:6775–6786. 10.1523/JNEUROSCI.1135-05.2005 [DOI] [PMC free article] [PubMed] [Google Scholar]
- Price CJ, Scott R, Rusakov DA, Capogna M (2008) GABA(B) receptor modulation of feedforward inhibition through hippocampal neurogliaform cells. J Neurosci 28:6974–6982. 10.1523/JNEUROSCI.4673-07.2008 [DOI] [PMC free article] [PubMed] [Google Scholar]
- Prönneke A, Scheuer B, Wagener RJ, Möck M, Witte M, Staiger JF (2015) Characterizing VIP neurons in the barrel cortex of VIPcre/tdTomato mice reveals layer-specific differences. Cereb Cortex 25:4854–4868. 10.1093/cercor/bhv202 [DOI] [PMC free article] [PubMed] [Google Scholar]
- Ramon y Cajal S. (1995) Histology of the nervous system of man and vertebrates. New York: OUP. [Google Scholar]
- Ramon y Cajal S, DeFelipe J, Jones EG (1988) Cajal on the cerebral cortex: an annotated translation of the complete writings. New York: OUP. [Google Scholar]
- Roth MM, Dahmen JC, Muir DR, Imhof F, Martini FJ, Hofer SB (2016) Thalamic nuclei convey diverse contextual information to layer 1 of visual cortex. Nat Neurosci 19:299–307. 10.1038/nn.4197 [DOI] [PMC free article] [PubMed] [Google Scholar]
- Rubio-Garrido P, Pérez-de-Manzo F, Porrero C, Galazo MJ, Clasca F (2009) Thalamic input to distal apical dendrites in neocortical layer 1 is massive and highly convergent. Cereb Cortex 19:2380–2395. 10.1093/cercor/bhn259 [DOI] [PubMed] [Google Scholar]
- Rudy B, Fishell G, Lee S, Hjerling-Leffler J (2011) Three groups of interneurons account for nearly 100% of neocortical GABAergic neurons. Dev Neurobiol 71:45–61. 10.1002/dneu.20853 [DOI] [PMC free article] [PubMed] [Google Scholar]
- Scanziani M. (2000) GABA spillover activates postsynaptic GABA(B) receptors to control rhythmic hippocampal activity. Neuron 25:673–681. 10.1016/S0896-6273(00)81069-7 [DOI] [PubMed] [Google Scholar]
- Sherman SM, Guillery RW (2011) Distinct functions for direct and transthalamic corticocortical connections. J Neurophysiol 106:1068–1077. 10.1152/jn.00429.2011 [DOI] [PubMed] [Google Scholar]
- Susaki EA, Tainaka K, Perrin D, Kishino F, Tawara T, Watanabe TM, Yokoyama C, Onoe H, Eguchi M, Yamaguchi S, Abe T, Kiyonari H, Shimizu Y, Miyawaki A, Yokota H, Ueda HR (2014) Whole-brain imaging with single-cell resolution using chemical cocktails and computational analysis. Cell 157:726–739. 10.1016/j.cell.2014.03.042 [DOI] [PubMed] [Google Scholar]
- Susaki EA, Tainaka K, Perrin D, Yukinaga H, Kuno A, Ueda HR (2015) Advanced CUBIC protocols for whole-brain and whole-body clearing and imaging. Nat Protoc 10:1709–1727. 10.1038/nprot.2015.085 [DOI] [PubMed] [Google Scholar]
- Szabadics J, Tamás G, Soltesz I (2007) Different transmitter transients underlie presynaptic cell type specificity of GABAA,slow and GABAA,fast. Proc Natl Acad Sci U S A 104:14831–14836. 10.1073/pnas.0707204104 [DOI] [PMC free article] [PubMed] [Google Scholar]
- Tamamaki N, Yanagawa Y, Tomioka R, Miyazaki J, Obata K, Kaneko T (2003) Green fluorescent protein expression and colocalization with calretinin, parvalbumin, and somatostatin in the GAD67-GFP knock-in mouse. J Comp Neurol 467:60–79. 10.1002/cne.10905 [DOI] [PubMed] [Google Scholar]
- Tamás G, Lorincz A, Simon A, Szabadics J (2003) Identified sources and targets of slow inhibition in the neocortex. Science 299:1902–1905. 10.1126/science.1082053 [DOI] [PubMed] [Google Scholar]
- Taniguchi H, He M, Wu P, Kim S, Paik R, Sugino K, Kvitsiani D, Fu Y, Lu J, Lin Y, Miyoshi G, Shima Y, Fishell G, Nelson SB, Huang ZJ (2011) A resource of cre driver lines for genetic targeting of GABAergic neurons in cerebral cortex. Neuron 71:995–1013. 10.1016/j.neuron.2011.07.026 [DOI] [PMC free article] [PubMed] [Google Scholar]
- Taniguchi H, Lu J, Huang ZJ (2013) The spatial and temporal origin of chandelier cells in mouse neocortex. Science 339:70–74. 10.1126/science.1227622 [DOI] [PMC free article] [PubMed] [Google Scholar]
- Tasic B, Menon V, Nguyen TN, Kim TK, Jarsky T, Yao Z, Levi B, Gray LT, Sorensen SA, Dolbeare T, Bertagnolli D, Goldy J, Shapovalova N, Parry S, Lee c, Smith K, Bernard A, Madisen L, Sunkin SM, Hawrylycz M, et al. (2016) Adult mouse cortical cell taxonomy revealed by single cell transcriptomics. Nat Neurosci 19:335–346. 10.1038/nn.4216 [DOI] [PMC free article] [PubMed] [Google Scholar]
- Tasic B, Yao Z, Graybuck LT, Smith KA, Nguyen TN, Bertagnolli D, Goldy J, Garren E, Economo MN, Viswanathan S, Penn O, Bakken T, Menon V, Miller J, Fong O, Hirokawa KE, Lathia K, Rimorin C, Tieu M, Larsen R, et al. (2018) Shared and distinct transcriptomic cell types across neocortical areas. Nature 563:72–78. 10.1038/s41586-018-0654-5 [DOI] [PMC free article] [PubMed] [Google Scholar]
- Thomson AM, Destexhe A (1999) Dual intracellular recordings and computational models of slow inhibitory postsynaptic potentials in rat neocortical and hippocampal slices. Neuroscience 92:1193–1215. 10.1016/S0306-4522(99)00021-4 [DOI] [PubMed] [Google Scholar]
- Thomson AM, West DC, Hahn J, Deuchars J (1996) Single axon IPSPs elicited in pyramidal cells by three classes of interneurones in slices of rat neocortex. J Physiol 496:81–102. 10.1113/jphysiol.1996.sp021667 [DOI] [PMC free article] [PubMed] [Google Scholar]
- Tremblay R, Lee S, Rudy B (2016) GABAergic interneurons in the neocortex: from cellular properties to circuits. Neuron 91:260–292. 10.1016/j.neuron.2016.06.033 [DOI] [PMC free article] [PubMed] [Google Scholar]
- Urban-Ciecko J, Fanselow EE, Barth AL (2015) Neocortical somatostatin neurons reversibly silence excitatory transmission via GABAb receptors. Curr Biol 25:722–731. 10.1016/j.cub.2015.01.035 [DOI] [PMC free article] [PubMed] [Google Scholar]
- van den Pol AN, Yao Y, Fu LY, Foo K, Huang H, Coppari R, Lowell BB, Broberger C (2009) Neuromedin B and gastrin-releasing peptide excite arcuate nucleus neuropeptide Y neurons in a novel transgenic mouse expressing strong renilla green fluorescent protein in NPY neurons. J Neurosci 29:4622–4639. 10.1523/JNEUROSCI.3249-08.2009 [DOI] [PMC free article] [PubMed] [Google Scholar]
- Vogt BA. (1991) The role of layer I in cortical function. In: Cerebral cortex: normal and altered states of function (Peters A, Jones EG, eds), pp 49–80. New York: Plenum. [Google Scholar]
- Wang Y, Toledo-Rodriguez M, Gupta A, Wu C, Silberberg G, Luo J, Markram H (2004) Anatomical, physiological and molecular properties of martinotti cells in the somatosensory cortex of the juvenile rat. J Physiol 561:65–90. 10.1113/jphysiol.2004.073353 [DOI] [PMC free article] [PubMed] [Google Scholar]
- Woodruff AR, McGarry LM, Vogels TP, Inan M, Anderson SA, Yuste R (2011) State-dependent function of neocortical chandelier cells. J Neurosci 31:17872–17886. 10.1523/JNEUROSCI.3894-11.2011 [DOI] [PMC free article] [PubMed] [Google Scholar]
- Woodruff A, Xu Q, Anderson SA, Yuste R (2009) Depolarizing effect of neocortical chandelier neurons. Front Neural Circuits 3:15. 10.3389/neuro.04.015.2009 [DOI] [PMC free article] [PubMed] [Google Scholar]
- Wozny C, Williams SR (2011) Specificity of synaptic connectivity between layer 1 inhibitory interneurons and layer 2/3 pyramidal neurons in the rat neocortex. Cereb Cortex 21:1818–1826. 10.1093/cercor/bhq257 [DOI] [PMC free article] [PubMed] [Google Scholar]
- Yáñez IB, Muñoz A, Contreras J, Gonzalez J, Rodriguez-Veiga E, DeFelipe J (2005) Double bouquet cell in the human cerebral cortex and a comparison with other mammals. J Comp Neurol 486:344–360. 10.1002/cne.20533 [DOI] [PubMed] [Google Scholar]
- Zhang S, Xu M, Kamigaki T, Hoang Do JP, Chang WC, Jenvay S, Miyamichi K, Luo L, Dan Y (2014) Selective attention. long-range and local circuits for top-down modulation of visual cortex processing. Science 345:660–665. 10.1126/science.1254126 [DOI] [PMC free article] [PubMed] [Google Scholar]
- Zhou FM, Hablitz JJ (1996a) Layer I neurons of rat neocortex. I. Action potential and repetitive firing properties. J Neurophysiol 76:651–667. 10.1152/jn.1996.76.2.651 [DOI] [PubMed] [Google Scholar]
- Zhou FM, Hablitz JJ (1996b) Morphological properties of intracellularly labeled layer I neurons in rat neocortex. J Comp Neurol 376:198–213. [DOI] [PubMed] [Google Scholar]
- Zhu Y, Zhu JJ (2004) Rapid arrival and integration of ascending sensory information in layer 1 nonpyramidal neurons and tuft dendrites of layer 5 pyramidal neurons of the neocortex. J Neurosci 24:1272–1279. 10.1523/JNEUROSCI.4805-03.2004 [DOI] [PMC free article] [PubMed] [Google Scholar]