

Abstract
NH3 is a valuable chemical with a wide range of applications, but the conventional Haber–Bosch process for industrial‐scale NH3 production is highly energy‐intensive with serious greenhouse gas emission. Electrochemical reduction offers an environmentally benign and sustainable route to convert N2 to NH3 at ambient conditions, but its efficiency depends greatly on identifying earth‐abundant catalysts with high activity for the N2 reduction reaction. Here, it is reported that MnO particles act as a highly active catalyst for electrocatalytic hydrogenation of N2 to NH3 with excellent selectivity. In 0.1 m Na2SO4, this catalyst achieves a high Faradaic efficiency up to 8.02% and a NH3 yield of 1.11 × 10⁻¹⁰ mol s−1 cm−2 at −0.39 V versus reversible hydrogen electrode, with great electrochemical and structural stability. On the basis of density functional theory calculations, MnO (200) surface has a smaller adsorption energy toward N than that of H with the *N2 → *N2H transformation being the potential‐determining step in the nitrogen reduction reaction.
Keywords: ambient conditions, artificial N2 fixation, electrocatalysis, MnO, NH3
NH3 plays a key role in earth's ecosystem and is widely used as an activated nitrogen building block to manufacture fertilizers and other products.1, 2, 3 NH3 is also regarded as an attractive energy carrier with high energy density coupled with no CO2 emission.4, 5 The most abundant molecular N2, making up 78% of the atmosphere, is chemically inert, and does not engage in most chemical reactions due to the strong triple bond6 and the N2 to NH3 fixation is rather challenging. In N2‐fixing bacteria, nitrogenases biologically can catalyze the reduction of N2 to NH3 at ambient conditions.7, 8 High temperature and pressure however is involved in the Haber–Bosch process for industrial‐scale NH3 production.6, 9, 10, 11 This traditional process is not only energy‐intensive, but the H2 used as the feeding gas often comes from fossil fuels leading to serious greenhouse gas emission. In this context, a less energy‐demanding and environmentally benign alternative process for NH3 production is highly desirable.
Electrochemical reduction using proton from water as the hydrogen source can be powered by renewable energy from solar or wind sources under ambient reaction conditions, offering an attractive approach to convert N2 to NH3 in a green and sustainable manner.12, 13 Although tackling the energy‐ and H2‐intensive operations by the Haber–Bosch process, it is still challenged with N2 activation and electrocatalysts for N2 reduction reaction (NRR) are a prerequisite.14, 15 Efficient catalysts based on noble metals have been designed to perform NRR with remarkable catalytic performances.16, 17, 18, 19, 20, 21 An immediate outlook for large‐scale industrial applications points toward the use of systems not relying on expensive precious metals, which strongly encourages the development of non‐noble‐metal NRR electrocatalysts (Fe2O3‐CNT,21 PEBCD/C,22 NPC,23 defect‐rich MoS2 nanoflower,24 MoS2/CC,25 and Bi4V2O11/CeO2 26).
As indispensable components of the cellular machinery, metal cations have various important biological functions, including in nucleic acids and protein structure stabilization to enzyme catalysis, signal transduction, photosynthesis,27, 28 etc. Photosynthesis is the principal energy converter on earth, and central to this process is photosystem II (PSII), a homodimeric multi‐subunit protein‐cofactor complex embedded in the thylakoid membrane.29, 30 PSII captures sunlight to power the most thermodynamically demanding reaction in biology: the photoinduced water oxidation to molecular O2, which is effectively catalyzed by a Mn‐containing cluster as the oxygen evolving center.31, 32 Inspired by this, a number of Mn‐based oxides have been developed for water oxidation electrocatalysis.33 Of note, Mn2+ is not involved in nitrogenases, but previous studies have suggested that Mn2+ can greatly enhance the catalytic activity of nitrogenases (N2ase) in extracts from the photosynthetic bacterium Rhodospirillum rubrum.34, 35 Although playing an important role in vitro activate N2ase for N2 fixation, Mn2+ is not required for the catalysis. In this regard, it is quite interesting to explore the electrochemical behavior of Mn oxide toward catalytic N2‐to‐NH3 fixation, which, however, has never been addressed before.
In this contribution, we demonstrate the first experimental verification that MnO particles on Ti mesh (MnO/TM) is a robust NRR catalyst for high‐performance electrohydrogenation of N2 to NH3 with excellent selectivity at ambient conditions. When tested in 0.1 m Na2SO4, this catalyst achieves a high Faradaic efficiency (FE) up to 8.02% and a large NH3 yield of 1.11 × 10⁻¹⁰ mol s−1 cm−2 at −0.39 V versus reversible hydrogen electrode (RHE). Density functional theory (DFT) calculations further reveal that the adsorption energy of N (ΔN*, −2.20 eV) is smaller than that of H (ΔH*, −1.56 eV) on MnO (200) surface and the *N2 → *N2H reaction is identified as the potential‐determining step of the NRR process and exhibits a low free energy change of 1.88 eV.
Figure 1 a,b shows X‐ray diffraction (XRD) patterns of MnCO3 and MnO scraped from TM. The peaks at 24.25°, 31.36°, 34.24°, 37.52°, 41.42°, 45.18°, 51.49°, and 51.69° are indexed to the (012), (104), (006), (110), (113), (202), (018), and (116) planes of MnCO3 (JCPDS No. 44‐1472), respectively. Other peaks are attributed to the KMn8O16 derived from the incomplete reduction of KMnO4 by glucose.36 The annealing product owns characteristic diffraction peaks at 34.96°, 40.59°, 58.74°, 70.22°, and 73.84° corresponding to the (111), (200), (220), (311), and (222) planes of MnO, respectively. Scanning electron microscopy (SEM) image of MnCO3/TM indicates the full coverage of TM (Figure S1, Supporting Information) with MnCO3 particles, as shown in Figure 1c. The SEM image (Figure 1d) of MnO/TM suggests the formation of roughed MnO particles with an average particle size of ≈0.65 µm (Figure 1d inset). The transmission electron microscopy (TEM) image (Figure 1e) further displays the MnO particles. High‐resolution TEM (HRTEM) image (Figure 1f) of MnO nanoparticle discloses clear lattices with an interplanar spacing of 0.221 nm, corresponding to the (200) plane of MnO crystal. Energy‐dispersive X‐ray (EDX) elemental mapping images (Figure 1g) manifest the uniform distribution of Mn and O elements in the MnO. Figure 1h,i presents the X‐ray photoelectron spectroscopy (XPS) spectra for MnO in Mn 2p and O 1s regions. For Mn 2p region, two diffraction peaks at 641.2 and 652.7 eV can be ascribed to the binding energies (BEs) of Mn 2p3/2 and Mn 2p1/2. The BE at 531.7 eV is assigned to the O 1s region with O2− species.37 And the ratio of Mn:O is 0.99:1 obtained from XPS data, further validating the formation of MnO. Figure 1j shows the typical Raman spectrum of MnO at ≈318, 378, 481, 575, and 662 cm−1, which squares well with the XPS results.38 Electron paramagnetic resonance (EPR) spectrum of MnO (Figure S2, Supporting Information) shows pronounced signal with g = 2.045 that can be assigned to the unpaired electrons of the paramagnetic center of the Mn2+.39, 40 The pyrolysis process of MnCO3 was characterized by thermogravimetric analysis (TGA), as shown in Figure S3 (Supporting Information). MnCO3 starts to decompose at ≈255 °C, following a significant weight loss (≈37.5 wt%) at around 450 °C, which is slightly lower than the theoretical value of the weight loss for the decomposition of MnCO3 into MnO (≈38.26 wt%). It indicates that there should be carbon left in MnCO3 due to glucose decomposition. The carbon content was further determined by TGA analysis of MnO under an Ar‐air atmosphere. The first weight loss before 100 °C can be ascribed to the removal of adsorbed water, while the second weight loss in the temperature range of 375–700 °C is due to the decomposition of the amorphous carbon, and a slight increase of the weight in the temperature range from 700 to 900 °C is related to the oxidation of MnO into MnOx (Figure S4, Supporting Information).
Figure 1.
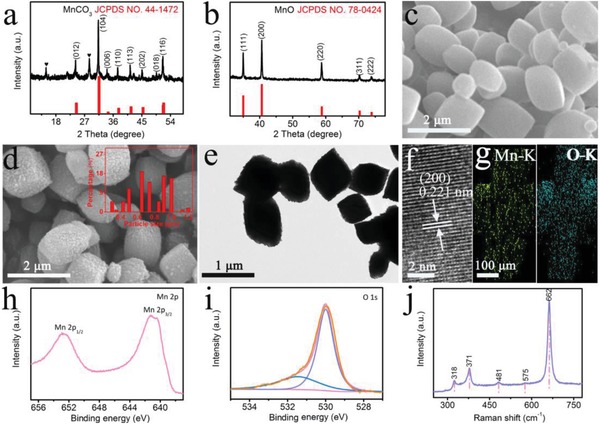
a,b) XRD patterns of MnCO3 and MnO. c,d) SEM images of MnCO3/TM and MnO/TM (inset: particle size distribution histogram of MnO). e) TEM and f) HRTEM images of MnO. g) EDX elemental mapping images of Mn and O elements of MnO. h,i) XPS spectra of MnO in the Mn 2p and O 1s regions. j) Raman spectrum of MnO.
The electrochemical measurements were performed in a two‐compartment electrochemical cell (Figure S5, Supporting Information) separated by a piece of Nafion membrane. A graphite rod, an Ag/AgCl electrode (filled with saturated KCl solution), and the prepared MnO/TM (with MnO loading of 0.85 mg) were used as counter electrode (Figure S6, Supporting Information), reference electrode, and working electrode, respectively. N2 gas was delivered into the cathodic compartment by N2 gas bubbling. All potentials are reported on the RHE scale. The produced NH3 was spectrophotometrically determined by the indophenol blue method,41 and the possible by‐product N2H4 was detected using the method of Watt and Chrisp.42 Figure 2 a shows the UV–vis absorption spectra of various electrolytes colored with indophenol indicator after electrocatalytic reaction for 3 h at different potentials ranging from −0.29 to −0.59 V (Figure S7, Supporting Information). Based on the calibration curves (Figure S8, Supporting Information), we determined the corresponding NH3 yields (Figure 2b) and FEs (Figure 2c). Furthermore, NH3 yields and FEs at various potentials (Figure S9, Supporting Information) determined by ion chromatography data (Table S1, Supporting Information) are quite comparable to the values obtained from the indophenol blue method. Both NH3 yields and FEs initially increase with potential being more negative. When the negative potential exceeds −0.39 V, the NH3 yields and FEs decrease obviously. These results might result from the competitive hydrogen‐evolving process, which can be suppressed in nonaqueous media to achieve higher current efficiency.43 Figure S10a (Supporting Information) exhibits the amount ofevolved H2 determined by gas chromatography from the headspace of the cell in N2‐saturated solution at various potentials. Figure S10b (Supporting Information) shows the selectivity of the catalyst toward H2 production at given potentials in N2‐saturated solutions. The unaccounted value may be attributed to the capacitance of the MnO/TM as well as dynamic H2 adsorption and desorption on MnO/TM.44 The mass ratio of H2/NH3 at various potentials is shown in Figure S10c (Supporting Information). At −0.39 V, MnO/TM affords the largest NH3 yield of 1.11 × 10⁻¹⁰ mol s−1 cm−2 and the highest FE of 8.02%, outperforming recent aqueous‐based NRR electrocatalysts, including Fe2O3‐CNT (3.58 × 10⁻¹² mol s−1 cm−2, 0.15%),21 PEBCD/C (2.58 × 10⁻¹¹ mol s−1 cm−2, 2.85%),22 MoS2/CC (8.08 × 10⁻¹¹ mol s−1 cm−2, 1.17%),25 Mo2N (4.60 × 10⁻¹⁰ mol s−1 cm−2, 4.5%),45 MoO3 (4.80 × 10⁻¹⁰ mol s−1 cm−2, 1.9%),46 MoN NA/CC (3.01 × 10⁻¹⁰ mol s−1 cm−2, 1.15%),47 Fe3O4/Ti (5.6 × 10⁻¹¹ mol s−1 cm−2, 2.6%),48 TiO2/Ti (9.16 × 10⁻¹¹ mol s−1 cm−2, 2.5%),49 VN/TM (8.40 × 10⁻¹¹ mol s−1 cm−2, 2.25%),50 hollow Cr2O3 microspheres (25.3 µg h−1 mg−1 cat., 6.78%),51 and TiO2‐rGO (15.13 µg h−1 mg−1 cat., 3.3%).52 A more detailed comparison is listed in Table S2 (Supporting Information).
Figure 2.
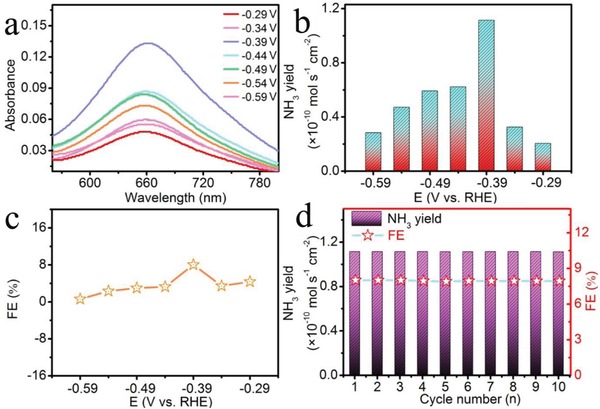
a) UV–vis absorption spectra of the electrolytes stained with indophenol indicator after NRR electrolysis at a series of potentials for 3 h. b) NH3 yields and c) FEs for MnO/TM at a series of potentials. d) Cycling test of MnO/TM at a potential of −0.39 V. The data were subtracted by the absorbance intensities of electrolytes after NRR electrolysis in Ar.
We compared the catalytic NRR performances of blank TM, MnCO3/TM, and MnO/TM. Figure S11 (Supporting Information) shows the NH3 yields for three electrodes after 3 h electrolysis at −0.39 V. Obviously, blank TM shows very poor NRR activity. Of note, although MnCO3/TM is also active for NRR, it only achieves a much lower NH3 yield compared with MnO/TM. The electrochemical impedance spectroscopy (EIS) data (Figure S12, Supporting Information) also suggest that MnO/TM has a lower charge transfer resistance53 than MnCO3/TM, leading faster NRR kinetics. For the case of NH3 electrosynthesis, the by‐product N2H4 seems to be easy to generate. However, there is no N2H4 detected in our system (Figure S13, Supporting Information), revealing the excellent selectivity of MnO/TM for NH3 formation. Stability of the MnO/TM catalyst for electrochemical NRR was assessed by consecutive electrolysis at −0.39 V. As observed in Figure 2d, MnO/TM has negligible change in NH3 yields and FEs during the cycling tests for ten times, implying its strong electrochemical stability.
To probe the durability, we collected the time‐dependent current density curve of MnO/TM at −0.39 V. As shown in Figure 3 a, this catalyst can maintain its catalytic activity for at least 25 h. After NRR durability test, this catalyst still maintains its particle morphology (Figure 3b) and is also MnO in nature (Figure 3c,d and Figure S14, Supporting Information). The particle size of MnO is distributed with an average size of ≈0.65 µm (Figure 3b inset).
Figure 3.
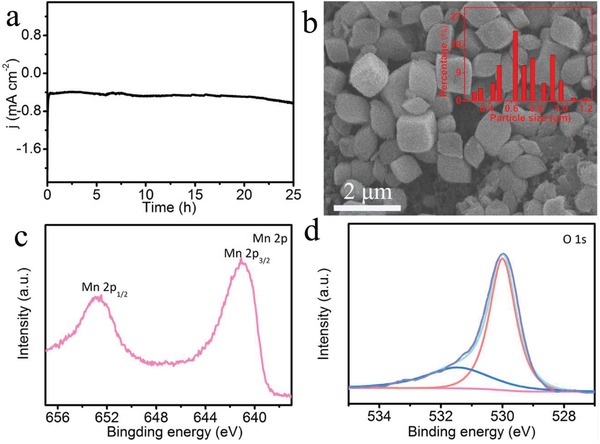
a) Time‐dependent current density curve of MnO/TM at potential of −0.39 V. SEM image of b) MnO/TM (inset: particle size distribution histogram of MnO) and XPS spectra of MnO in the c) Mn 2p and d) O 1s after durability test.
We also performed NRR experiments for MnO/TM under N2 atmosphere at an open‐circuit or under Ar gas at −0.39 V for 3 h. As shown in Figure S15 (Supporting Information), no apparent NH3 was detected for both cases using the indophenol blue method, indicating NH3 was produced by N2 reduction in the presence of MnO catalyst. The formation of NH4 + during the electrochemical NRR experiments was also validated by Raman spectroscopy under 785 nm laser excitation (Figure S16, Supporting Information). Given that Na2SO4 could affect the Raman features of NH4 +, we compared the Raman spectrum of NRR sample collected from the electrochemical experiment at −0.39 V with those of 0.1 m Na2SO4 and 0.1 m Na2SO4 + NH4 +. At 3200 cm−1, there is no peak for 0.1 m Na2SO4, while NRR sample and 0.1 m Na2SO4 + NH4 + have intensive peaks, indicating the generation of NH4 + in solution during the electrolysis.54, 55 We further performed 15N isotopic labeling experiment to verify the N source of the NH3 produced, using a doublet coupling for 15NH4 + standard sample as reference. Figure S17 (Supporting Information) shows the 1H nuclear magnetic resonance (1H NMR) spectra. As observed, supplying Ar to the electrolysis system failed to produce NH4 + in the electrolyte; however, 15NH4 + was detected when 15N2 was fed. These observations also confirm that the NH3 in the electrolyte was indeed generated via electrocatalytic N2 reduction by MnO.
For appreciable buildup of NHx intermediates, an ideal NRR catalyst would require a high selectivity of N2 adsorption with respect to H, that is, the adsorption energy of N (E ads N*) is smaller than that of H (E ads H*) on the catalyst surface.56, 57 Our DFT calculations demonstrate that the adsorption of N on Mn atom and H on O atom of the MnO (200) surface yield the largest adsorption energy of −2.20 and −1.56 eV, respectively, which indicates that our catalyst has higher selectivity for N.
In general, the hydrogenation of N2 involves supplying hydrogen atoms to N2 one‐by‐one from the electrolyte and gaining electrons from the electrode surface. The standard hydrogen electrode (SHE) free energy profile (Figure 4 a) shows that the reaction from *N2 to *NNH with an uphill free energy change of 1.88 eV is the potential‐determining step of the NRR process on the MnO (200) surface. At the initial stage (Figure S18, Supporting Information), N2 is physically adsorbed on the top of Mn atom with N≡N and N—Mn bond lengths of 1.12 and 2.73 Å, respectively. Subsequently, the N≡N bond is elongated to 1.21 Å while the N—Mn bond is shortened to 2.05 Å due to that the N≡N dimer is hydrogenated to *NNH, as shown in Figure S18 (Supporting Information). As displayed in Figure 4b, the atom‐projected density of state (DOS) for the *N2 and *NNH structures is substantially from the substrate MnO. The zooming‐in DOS of the N2/MnO configuration shows that the two N atoms are completely overlapping at 1.0–1.5 eV above the Fermi level, suggesting the intact feature of N2 molecule and the weak interactions between N2 and MnO surface. As for the structure of NNH adsorbed on MnO, the enlarged DOS image evidences the hybridization of N2 with H and N1 atoms, as well as the bonding interactions between N1 atom and the substrate around −1.5 to −1.0 eV in the valence band. Consequently, the N‐2p states locating above the Fermi level are stretched from about 0.25 to 1.5 eV and becoming less overlapping with respect to the N2 portion in the DOS of N2/MnO, indicating the N2 molecules are activated by the added H atom. Furthermore, the charge density difference, defined as △ρ = ρ(*A) − ρ(*) − ρ(A) (A = adsorbate), of *N2 and *NNH states are visualized in Figure 4c. Because of the weak vdW interactions between N2 and the substrate, the electron transfer between them is greatly limited. However, it is much more impressive for the *NNH configuration, where the depletion of electrons occurs in the region between the two N atoms while the accumulation of electrons occurs on the N—Mn and N—H bonds (Figure 4c). This indicates the remarkable dissociation of the N—N bonds in the first hydrogenation step. Bader charge analysis58 manifests that the lower N atom obtains 0.13 electrons from the coordinated Mn atom, and the upper N atom grabs 0.38 electrons from the hydrogen atom (Figure 4c).
Figure 4.
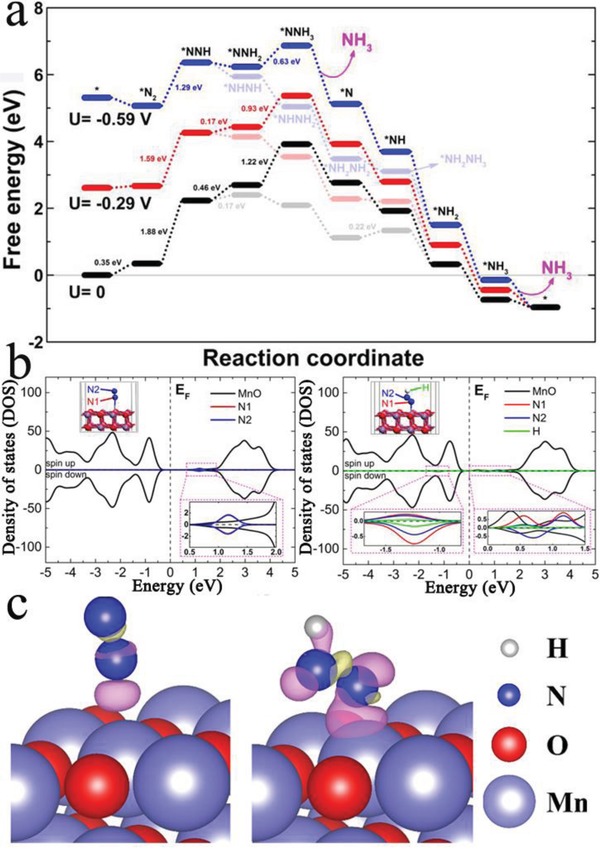
a) Free energy profile of NRR process on MnO (200) surface. An asterisk (*) denotes the adsorption site. The competitive processes are shown in light colors. b) DOS of *N2 and *NNH. c) Charge density difference of *N2 and *NNH. The electron excess and deficiency are displayed as purple and yellow isosurfaces, respectively. The level of isosurface is 0.001 and 0.003 e Å−1 for *N2 and *NNH, respectively.
The addition of the second hydrogen atom is 0.46 or 0.17 eV uphill to form *NNH2 or *NHNH on the SHE free energy profile. Obviously, the formation of *NHNH is an energetically preferable hydrogenation step. This pathway is even more feasible to add the third hydrogen atom, since the formation of *NHNH2 is −0.31 eV downhill, but an uphill free energy of 1.22 eV is required to form *NNH3. After that, all the following hydrogen steps are downhill in free energy (exergonic), except for a small uphill energy change of 0.22 eV from *NH2NH2 to *NH2NH3. This value is much smaller than the desorption energy of 0.60 eV for NH2NH2 to escape from the MnO (200) surface. Therefore, the formation of N2H4 as a by‐product is prohibited.
In order to better interpret the NRR process under the experimental condition, the effect of potential of −0.29 or −0.59 V on the reactions is involved in the calculations. As compared in Figure 4a, the reaction free energy of the determining step on the SHE energy profile is reduced to 1.59 or 1.29 eV with the applied potential of −0.29 or −0.59 V, respectively. The uphill energy change is eliminated for the reaction step from *NNH to *NHNH (or *NNH2), and for the following reaction steps. The large energy change of the next step on the competitive reaction process is also reduced to 0.93 or 0.63 eV. The decline and elimination of the uphill reaction steps suggest the beneficial effect of the applied potentials on the hydrogenation process of N2. The energy profile of the NRR process under the potential of −0.39 V accompanying with the values of the standard reaction (0 V) is presented in Figure S19 (Supporting Information), in order to reduce spatial redundancy of Figure 4a. The potential of −0.39 V makes moderate efforts to adjust the uphill energy change on the reaction pathway, as compared with the results of −0.29 and −0.59 V. Remarkably, although the adsorption of N2 and NNH species is more stable on the MnCO3 (104) surface, the free energy difference of the critical step *N2 → *NNH on the MnCO3 (104) is 1.98 eV, which is larger than the value of 1.88 eV for the reaction on the MnO (200) surface (Table S3, Supporting Information). Such smaller free energy difference of *N2 → *NNH and the lower charge transfer resistance (Figure S12, Supporting Information) contribute to the higher NRR activity for MnO/TM.
In summary, MnO has been experimentally proven as a high‐performance and durable catalyst for ambient electrohydrogenation of N2 to NH3 in neutral media. This catalyst achieves superior performances in current efficiency and NH3 yield of 8.02% and 1.11 × 10⁻¹⁰ mol s−1 cm−2 at −0.39 V, respectively. Theoretical calculations further reveal the preferential adsorption of N atoms compared to H atoms on the catalyst and the potential‐determining step of *N2 → *N2H reaction in the NRR process. Constructing carbon‐based nanohybrids with enhanced conductivity is a promising way to further enhance the NRR performances of Mn oxide catalysts,59 and engineering surface oxygen vacancies for more efficient molecular N2 adsorption and activation may also provide another viable avenue.26, 60, 61
Experimental Section
Materials: KMnO4, glucose, salicylic acid, sodium citrate, sodium hypochlorite (NaClO), Na2[Fe(CN)5NO] · 2H2O, and sodium nitroferricyanide (C5FeN6Na2O) were purchased from Sigma‐Aldrich Chemical Reagent Co., Ltd. Sodium sulfate (Na2SO4), isopropyl alcohol, ethanol, and 15N2 gas were purchased from Aladdin Ltd. (Shanghai, China). 211 Nafion membrane (Dupont) and TM were provided by Hongshan District, Wuhan Instrument Surgical Instruments business. The ultrapure water used throughout all experiments was purified through a Millipore system.
Preparation of MnCO3/TM and MnO/TM: To prepare MnCO3/TM, 0.8 g of KMnO4, 1.0 g of glucose, and 45 mL of deionized water were mixed with magnetic stirring. After stirring for 30 min, the mixture was transferred and sealed in a 50 mL Teflon‐lined autoclave with a piece of TM, then heated at 180 °C for 10 h, and finally cooled to room temperature. The obtained material was collected by centrifuge, washed alternately with deionized water and ethanol for three times, and dried in vacuum oven at 80 °C overnight. MnO/TM material was prepared by heating the resulting MnCO3/TM at 550 °C for 4 h in Ar.
Characterizations: XRD patterns were obtained from a Shimazu XRD‐6100 diffractometer working with Cu Kα radiation (40 kV, 30 mA) of wavelength 0.154 nm (Shimadzu, Japan). SEM images were collected from the tungsten lamp‐equipped SU3500 scanning electron microscope at an accelerating voltage of 20 kV (Hitachi, Japan). TEM images were obtained from a Zeiss Libra 200FE transmission electron microscope operated at 200 kV. XPS measurements were performed on an ESCALABMK II X‐ray photoelectron spectrometer using Mg as the exciting source. The absorbance data of spectrophotometer were measured on UV–vis spectrophotometer. TGA were performed on a Perkin‐Elmer Model Pyris1 TGA apparatus at a heating rate of 10 °C min−1 in flowing Ar or Ar‐air mixture. The Raman spectra were collected on a Renishaw InVia Raman spectrometer under a backscattering geometry (λ = 532 nm). EPR spectra were obtained from the Bruker EMX‐10/12 variable‐temperature apparatus. A gas chromatograph (Shimadzu, GC‐2014C) equipped with MolSieve 5A column was used for H2 quantifications. Gas‐phase product was sampled every 1000 s using a gas‐tight syringe (Hamilton). The ion chromatography was conducted on Swiss Wangtong ECO. 1H NMR spectra were recorded on a Bruker AVANCE III 500 HD spectrometer with a 5 mm BBFO smart probe, operating at 500.13 MHz. 1H NMR experiments were carried out at 303 K for 5% w/v sample solution in DMSO‐d6. The spectral windows were set to 12.5 kHz (25 ppm), a total of 16 scans were recorded, a π/2 pulse length of 11.6 µs, and 64 K data points with 3 s recycle delay for each sample. Topspin software version is 3.5 pl6. All 1H chemical shifts are referenced to the resonances of DSS standard (δ = 0.00).
Electrochemical N2 Reduction Measurements: All experiments were carried out at room temperature. The potentials reported in this work were converted to RHE scale via calibration with the following equation: E (vs RHE) = E (vs Ag/AgCl) + pH × 0.059 V and the presented current densities were normalized to the geometric surface area. For N2 reduction experiments, the Na2SO4 electrolyte was purged with N2 for 30 min before the measurement. Potentiostatic tests were conducted in N2‐saturated 0.1 m Na2SO4 solution (30 mL) in a two‐compartment cell, which was separated by Nafion 211 membrane. For comparison, potentiostatic test in Ar‐saturated 0.1 m Na2SO4 solution was also conducted in this work. The concentration of synthesized NH3 was calculated after subtracting that in Ar.
Determination of NH3: The produced NH3 was detected with indophenol blue by UV–vis absorption spectra. In detail, 4.0 mL electrolyte was removed from the cathodic chamber and added into 50 µL oxidizing solution containing NaClO (ρCl = 4–4.9) and NaOH (0.75 m), followed by adding 500 µL coloring solution containing 0.4 m C7H6O3 and 0.32 m NaOH, and 50 µL catalyst solution (0.1 g Na2[Fe(CN)5NO] · 2H2O diluted to 10 mL with deionized water) in turn. Absorbance measurements were performed after 2 h at λ = 655 nm. The concentration–absorbance curve was calibrated using standard NH4Cl solution with NH4 + concentrations of 0.0, 0.1, 0.2, 0.3, 0.4, and 0.5 µg mL−1 in 0.1 m Na2SO4. The fitting curve (y = 0.7036x + 0.029, R 2 = 0.999) shows good linear relation of absorbance value with NH3 concentration by three times independent calibrations.
Determination of N2H4: N2H4 presented in the electrolyte was determined by the method of Watt and Chrisp. The p‐C9H11NO (5.99 g), HCl (30 mL), and C2H5OH (300 mL) were mixed and the resulting mixture was used as a color reagent. In detail, 5 mL electrolyte was removed from the electrochemical reaction vessel, and added into 5 mL prepared color reagent at 25 °C. The obtained calibration curve of N2H4 is y = 0.433x + 0.044 with R 2 = 0.999.
Determination of NH3 Yield Rate and the Calculation of FE: NH3 yield rate was calculated using the following equation
| (1) |
The FE was calculated according to the following equation
| (2) |
where [NH3] is the measured NH3 concentration; V is the volume of the cathodic reaction for NH3 collection; t is the potential applied time; A is the geometric area; m is the loaded mass of catalyst; F is the Faraday constant; and Q is the quantity of applied electricity.
DFT Calculation Details: Spin‐polarized DFT+U calculations were performed using the Vienna ab initio simulation package (VASP)62 to improve the description of the on‐site Coulomb interactions between Mn (3d) electrons, where the value of U eff = U − J was set to 4.0 eV.63, 64 The projector augmented wave (PAW) potentials65 were used for the treatment of core electrons. The generalized gradient approximation (GGA) with the Perdew–Burke–Ernzerhof (PBE) functional66 was applied to describe the electron exchange correlation interactions. In order to investigate the key steps of the NRR on the MnO (200) surface, the calculations were performed based on a model of 2 × 2 × 1 supercell, with a vacuum of 20 Å added in the z‐direction. The energy cutoff of the plane‐wave basis sets was set to 450 eV. The ionic relaxation was performed until the force on each atom converge to within 0.01 eV Å−1. The K points were sampled with 5 × 5 × 1 by Monkhorst–Pack method.67 The magnetic ordering of the Mn atoms in the slab was arranged in type‐II antiferromagnetic, as suggested by Pask et al.68 Under the SHE condition, the reaction free energies of the NRR steps were calculated as:69 G = E DFT + E ZPE − TΔS, where E DFT is the DFT calculated energy, E ZPE and TΔS are obtained by DFT vibration frequency calculations, and presented in Table S4 (Supporting Information). In order to consider the effect of an applied electric potential on the electrode reaction, a value of −neU was added to calculate the free energy of each step, where n is the number of electrons involved in the reaction, and U is the applied bias.69
Conflict of Interest
The authors declare no conflict of interest.
Supporting information
Supplementary
Acknowledgements
Z.W. and F.G. contributed equally to this work. This work was supported by the National Natural Science Foundation of China (No. 21575137). The authors also appreciate Hui Wang from the Analytical & Testing Center of Sichuan University for her help with SEM characterization.
Wang Z., Gong F., Zhang L., Wang R., Ji L., Liu Q., Luo Y., Guo H., Li Y., Gao P., Shi X., Li B., Tang B., Sun X., Adv. Sci. 2019, 6, 1801182 10.1002/advs.201801182
Contributor Information
Baihai Li, Email: libaihai@uestc.edu.cn.
Bo Tang, Email: tangb@sdnu.edu.cn.
Xuping Sun, Email: xpsun@uestc.edu.cn.
References
- 1. Schlögl R., Angew. Chem., Int. Ed. 2003, 42, 2004. [DOI] [PubMed] [Google Scholar]
- 2. Murakami T., Nishikiori T., Nohira T., Ito Y., J. Am. Chem. Soc. 2003, 125, 334. [DOI] [PubMed] [Google Scholar]
- 3. Rosca V., Duca M., de Groot M. T., Koper M. T., Chem. Rev. 2009, 109, 2209. [DOI] [PubMed] [Google Scholar]
- 4. Pickett C. J., Talarmin J., Nature 1985, 317, 652. [Google Scholar]
- 5. Klerke A., Christensen C. H., Norskov J. K., Vegge T., J. Mater. Chem. 2008, 18, 2304. [Google Scholar]
- 6. Smil V., Sci. Am. 1997, 277, 76. [Google Scholar]
- 7. Burgess B. K., Lowe D. J., Chem. Rev. 1996, 96, 2983. [DOI] [PubMed] [Google Scholar]
- 8. Hoffman B. M., Lukoyanov D., Yang Z., Dean D., Seefeldt L. C., Chem. Rev. 2014, 114, 4041. [DOI] [PMC free article] [PubMed] [Google Scholar]
- 9. Jennings J. R., Catalytic Ammonia Synthesis: Fundamentals and Practice, Plenum, New York: 1991. [Google Scholar]
- 10. Li S., Bao D., Shi M., Wulan B., Yan J., Jiang Q., Adv. Mater. 2017, 29, 1700001. [DOI] [PubMed] [Google Scholar]
- 11. Bao D., Zhang Q., Meng F., Zhong H., Shi M., Zhang Y., Yan J., Jiang Q., Zhang X., Adv. Mater. 2017, 29, 1604799. [DOI] [PubMed] [Google Scholar]
- 12. Shipman M. A., Symes M. D., Catal. Today 2017, 286, 57. [Google Scholar]
- 13. Kyriakou V., Garagounis I., Vasileiou E., Vourros A., Stoukides M., Catal. Today 2017, 286, 2. [Google Scholar]
- 14. Seh Z. W., Kibsgaard J., Dickens C. F., Chorkendorff I., Nørskov J. K., Jaramillo T. F., Science 2017, 355, eaad4998. [DOI] [PubMed] [Google Scholar]
- 15. Guo C., Ran J., Vasileff A., Qiao S., Energy Environ. Sci. 2018, 11, 45. [Google Scholar]
- 16. Shi M., Bao D., Wulan B. R., Li Y., Zhang Y., Yan J., Jiang Q., Adv. Mater. 2017, 29, 1606550. [DOI] [PubMed] [Google Scholar]
- 17. Wang Z., Li Y., Yu H., Yu Y., Xue H., Li X., Wang H., Wang L., ChemSusChem 2018, 11, 3480. [DOI] [PubMed] [Google Scholar]
- 18. Nazemi M., Panikkanvalappil S. R., El‐Sayed M. A., Nano Energy 2018, 49, 316. [Google Scholar]
- 19. Liu H., Han S. H., Zhao Y., Zhu Y., Tian X., Zeng J., Chen Y., J. Mater. Chem. A 2018, 6, 3211. [Google Scholar]
- 20. Kugler K., Luhn M., Schramm J. A., Rahimi K., Wessling M., Phys. Chem. Chem. Phys. 2015, 17, 3768. [DOI] [PubMed] [Google Scholar]
- 21. Chen S., Perathoner S., Ampelli C., Mebrahtu C., Su D., Centi G., Angew. Chem., Int. Ed. 2017, 56, 2699. [DOI] [PubMed] [Google Scholar]
- 22. Chen G., Cao X., Wu S., Zeng X., Ding L., Zhu M., Wang H., J. Am. Chem. Soc. 2017, 139, 9771. [DOI] [PubMed] [Google Scholar]
- 23. Liu Y., Su Y., Quan X., Fan X., Chen S., Yu H., Zhao H., Zhang Y., Zhao J., ACS Catal. 2018, 8, 1186. [Google Scholar]
- 24. Li X., Li T., Ma Y., Wei Q., Qiu W., Guo H., Shi X., Zhang P., Asiri A. M., Chen L., Tang B., Sun X., Adv. Energy Mater. 2018, 8, 201801357. [Google Scholar]
- 25. Zhang L., Ji X., Ren X., Ma Y., Shi X., Tian Z., Abdullah A. M., Chen L., Tang B., Sun X.. Adv. Mater. 2018, 30, 1800191. [DOI] [PubMed] [Google Scholar]
- 26. Lv C., Yan C., Chen G., Ding Y., Sun J., Zhou Y., Yu G., Angew. Chem., Int. Ed. 2018, 57, 6073. [DOI] [PubMed] [Google Scholar]
- 27. Finney L. A., O'Halloran T. V., Science 2003, 300, 931. [DOI] [PubMed] [Google Scholar]
- 28. Dudev T., Lim C., Chem. Rev. 2014, 114, 538. [DOI] [PubMed] [Google Scholar]
- 29. Ke B., Photosynthesis: Photobiochemistry and Photobiophysics, Kluwer Academic, Dordrecht, The Netherlands: 2001. [Google Scholar]
- 30. Kok B., Forbush B., Gloin M., Photochem. Photobiol. 1970, 11, 457. [DOI] [PubMed] [Google Scholar]
- 31. Ferreira K. N., Iverson T. M., Maghlaoui K., Barber J., Iwata S., Science 2004, 303, 1831. [DOI] [PubMed] [Google Scholar]
- 32. Loll B., Kern J., Saenger W., Zouni A., Biesiadka J., Nature 2005, 438, 1040. [DOI] [PubMed] [Google Scholar]
- 33. Hunter B. M., Gray H. B., Müller A. D., Chem. Rev. 2016, 116, 14120. [DOI] [PubMed] [Google Scholar]
- 34. Ludden P. W., Burris R. H.. Science 1976, 194, 424. [DOI] [PubMed] [Google Scholar]
- 35. Nordlund S., Erikason U., Baltscheffsky H., Biochim. Biophys. Acta 1977, 462, 187. [DOI] [PubMed] [Google Scholar]
- 36. Xu G., Xu Y., Fang J., Fu F., Sun H., Huang L., Yang S., Sun S., ACS Appl. Mater. Interfaces 2013, 5, 6316. [DOI] [PubMed] [Google Scholar]
- 37. Sun Y., Hu X., Luo W., Huang Y., J. Mater. Chem. 2012, 22, 19190. [Google Scholar]
- 38. Ramesh K., Chen L., Chen F., Liu Y., Wang Z., Han Y., Catal. Today 2008, 131, 477. [Google Scholar]
- 39. Chen T., Huo P., Hou J., Xu J., Zhu Q., Dai J., Inorg. Chem. 2016, 55, 12758. [DOI] [PubMed] [Google Scholar]
- 40. Beermann P. A. G., McGarvey B. R., Muralidharan S., Sung R. C., Chem. Mater. 2004, 16, 915. [Google Scholar]
- 41. Qiu W., Xie X., Qiu J., Fang W., Liang R., Ren X., Ji X., Cui G., Asiri A. M., Cui G., Tang B., Sun X., Nat. Commun. 2018, 9, 3485. [DOI] [PMC free article] [PubMed] [Google Scholar]
- 42. Watt G. W., Chrisp J. D., Anal. Chem. 1952, 24, 2006. [Google Scholar]
- 43. Zhou F., Azofra L. M., Ali M., Kar M., Simonov A. N., McDonnell‐Worth C., MacFarlane D. R., Energy Environ. Sci. 2017, 10, 2516. [Google Scholar]
- 44. Wang J., Yu L., Hu L., Chen G., Xin H., Feng X., Nat. Commun. 2018, 9, 1795. [DOI] [PMC free article] [PubMed] [Google Scholar]
- 45. Ren X., Cui G., Chen L., Xie F., Wei Q., Tian Z., Sun X., Chem. Commun. 2018, 54, 8474. [DOI] [PubMed] [Google Scholar]
- 46. Han J., Ji X., Ren X., Cui G., Li L., Xie F., Wang H., Li B., Sun X., J. Mater. Chem. A 2018, 6, 12974. [Google Scholar]
- 47. Zhang L., Ji X., Ren X., Luo Y., Shi X., Asiri A. M., Zheng B., Sun X., ACS Sustainable Chem. Eng. 2018, 6, 9550. [Google Scholar]
- 48. Liu Q., Zhang X., Zhang B., Luo Y., Cui G., Xie F., Sun X., Nanoscale 2018, 10, 14386. [DOI] [PubMed] [Google Scholar]
- 49. Zhang R., Ren X., Shi X., Xie F., Zheng B., Guo X., Sun X., ACS Appl. Mater. Interfaces 2018, 10, 28251. [DOI] [PubMed] [Google Scholar]
- 50. Zhang R., Zhang Y., Ren X., Cui G., Asiri A. M., Zheng B., Sun X., ACS Sustainable Chem. Eng. 2018, 6, 9545. [Google Scholar]
- 51. Zhang Y., Qiu W., Ma Y., Luo Y., Tian Z., Cui G., Xie F., Chen L., Li T., Sun X., ACS Catal. 2018, 8, 8540. [Google Scholar]
- 52. Zhang X., Liu Q., Shi X., Asiri A. M., Luo Y., Li T., Sun X., J. Mater. Chem. A 2018, 6, 17303. [Google Scholar]
- 53. Ji Y., Yang L., Ren X., Cui G., Xiong X., Sun X., ACS Sustainable Chem. Eng. 2018, 6, 11186. [Google Scholar]
- 54. Vítek P., Edwards H. G. M., Jehlicka J., Ascaso C., De Los Ríos A., Valea S., Jorge‐Villar S. E., Davila A. F., Wierzchos J., Philos. Trans. R. Soc. A 2010, 368, 3205. [DOI] [PubMed] [Google Scholar]
- 55. Carter R. L., Spectrochim. Acta, Part A 2002, 58, 3185. [DOI] [PubMed] [Google Scholar]
- 56. Singh A. R., Rohr B. A., Schwalbe J. A., Cargnello M., Chan K., Jaramillo T. F., Nørskov J. K., ACS Catal. 2017, 7, 706. [Google Scholar]
- 57. Oshikiri T., Ueno K., Misawa H., Angew. Chem., Int. Ed. 2016, 55, 3942. [DOI] [PubMed] [Google Scholar]
- 58. Bader R. F. W., Atoms in Molecules: A Quantum Theory, Oxford University Press, Oxford: 1990. [Google Scholar]
- 59. Wang Y., Gong F., Wu X., Shi X., Asiri A. M., Li T., Liu Q., Sun X., unpublished.
- 60. Li C., Wang T., Zhao Z., Yang W., Li J., Li A., Yang Z., Ozin G. A., Gong J., Angew. Chem., Int. Ed. 2018, 57, 5278. [DOI] [PubMed] [Google Scholar]
- 61. Hirakawa H., Hashimoto M., Shiraishi Y., Hirai T., J. Am. Chem. Soc. 2017, 139, 10929. [DOI] [PubMed] [Google Scholar]
- 62. Segall M. D., Philip J. D. L., Probert M. J., Pickard C. J., Hasnip P. J., Clark S. J., Payne M. C., J. Phys. Condens. Matter 2002, 14, 2717. [Google Scholar]
- 63. Jain A., Hautier G., Ong S. P., Moore C. J., Fischer C. C., Persson K. A., Ceder G., Phys. Rev. B 2011, 84, 045115. [Google Scholar]
- 64. Wang L., Maxisch T., Ceder G., Phys. Rev. B 2006, 73, 195107. [Google Scholar]
- 65. Blochl P. E., Phys. Rev. B 1994, 50, 17953. [DOI] [PubMed] [Google Scholar]
- 66. Perdew J. P., Chevary J. A., Vosko S. H., Jackson K. A., Pederson M. R., Singh D. J., Fiolhais C., Phys. Rev. B 1992, 46, 6671. [DOI] [PubMed] [Google Scholar]
- 67. Monkhorst H. J., Pack J. D., Phys. Rev. B 1976, 13, 5188. [Google Scholar]
- 68. Pask J., Singh D., Mazin I., Hellberg C., Kortus J., Phys. Rev. B 2001, 64, 024403. [Google Scholar]
- 69. Skulason E., Bligaard T., Gudmundsdóttir S., Studt F., Rossmeisl J., Abild‐Pedersen F., Nørskov J. K., Phys. Chem. Chem. Phys. 2012, 14, 1235. [DOI] [PubMed] [Google Scholar]
Associated Data
This section collects any data citations, data availability statements, or supplementary materials included in this article.
Supplementary Materials
Supplementary