

Summary
Sigma-1 receptors (Sig-1Rs) are integral ER membrane proteins. They bind diverse ligands, including psychoactive drugs, and regulate many signaling proteins, including the inositol 1,4,5-trisphosphate receptors (IP3Rs) that release Ca2+ from the ER. The endogenous ligands of Sig-1Rs are unknown. Phospholipase D (PLD) cleaves phosphatidylcholine to choline and phosphatidic acid (PA), with PA assumed to mediate all downstream signaling. We show that choline is also an intracellular messenger. Choline binds to Sig-1Rs, it mimics other Sig-1R agonists by potentiating Ca2+ signals evoked by IP3Rs, and it is deactivated by metabolism. Receptors, by stimulating PLC and PLD, deliver two signals to IP3Rs: IP3 activates IP3Rs, and choline potentiates their activity through Sig-1Rs. Choline is also produced at synapses by degradation of acetylcholine. Choline uptake by transporters activates Sig-1Rs and potentiates Ca2+ signals. We conclude that choline is an endogenous agonist of Sig-1Rs linking extracellular stimuli, and perhaps synaptic activity, to Ca2+ signals.
Keywords: bradykinin, Ca2+, choline, G-protein-coupled receptor, IP3 receptor, intracellular messenger, neurotransmitter, phospholipase C, phospholipase D, Sigma-1 receptor
Graphical Abstract
Highlights
-
•
Choline, but not its metabolites, binds to Sigma-1 receptors
-
•
Choline potentiates IP3-evoked Ca2+ release by activating Sigma-1 receptors
-
•
Bradykinin stimulates Ca2+ release by stimulating formation of IP3 and choline
-
•
Choline uptake by a specific transporter potentiates IP3-evoked Ca2+ release
Sigma-1 receptors respond to diverse stimuli and regulate many signaling proteins. Brailoiu et al. show that choline is an endogenous agonist of Sigma-1 receptors. Choline links receptors and cholinergic synaptic activity, through Sigma-1 receptors, to enhanced Ca2+ release through IP3 receptors.
Introduction
The Sigma-1 receptor (Sig-1R) is a small integral membrane protein expressed mainly in the endoplasmic reticulum (ER) and concentrated at the dynamic contacts between mitochondria and ER, the mitochondria-associated ER membrane domains (MAMs) (Schmidt et al., 2016, Smith and Su, 2017, Su et al., 2016). Sig-1R was thought to have two transmembrane domains (TMDs), with its N and C termini in the ER lumen (Aydar et al., 2002, Hayashi and Su, 2007). This topology was consistent with evidence that BiP, an ER luminal chaperone protein, binds to the C-terminal domain of Sig-1R (Hayashi and Su, 2007). However, a crystal structure of Sig-1R challenges these observations because it identified only a single TMD within each subunit of a trimeric complex, and it placed the C-terminal region on the cytosolic side of the ER membrane (Alon et al., 2017, Schmidt et al., 2016).
Sig-1Rs are abundant in brain, but they are also expressed in other tissues (Smith and Su, 2017). They are implicated in many pathologies, including depression, anxiety, amyotrophic lateral sclerosis and other neurodegenerative diseases, drug addiction, neuropathic pain, and cancers (Gueguinou et al., 2017, Su et al., 2016, Watanabe et al., 2016). Sig-1Rs bind an unusually diverse array of ligands, most of which are amines. These include antidepressants (e.g., fluoxetine), antipsychotics (e.g., haloperidol), and drugs of abuse (e.g., cocaine and methamphetamine) (Maurice and Su, 2009, Walker et al., 1990). Sig-1Rs also interact with many different signaling proteins. Within the ER, these proteins include inositol 1,4,5-trisphosphate receptors (IP3Rs) (Hayashi and Su, 2007) and STIM1, the Ca2+ sensor for store-operated Ca2+ entry (Srivats et al., 2016). At the plasma membrane (PM), Sig-1Rs regulate a variety of receptors and ion channels (Su et al., 2016).
Although many ligands of Sig-1Rs have opposing effects, their diversity and the many proteins that interact with Sig-1Rs confound attempts to classify ligands consistently as agonists or antagonists across all bioassays (Schmidt et al., 2016, Yano et al., 2018). A more fundamental distinction may be whether ligands stabilize oligomeric (antagonists) or monomeric forms (agonists) of Sig-1R (Gromek et al., 2014, Mishra et al., 2015, Ossa et al., 2017, Schmidt et al., 2016, Yano et al., 2018). Hence, agonists by releasing Sig-1Rs from large oligomeric complexes may free Sig-1Rs to interact with client proteins (Figure 1A). Several endogenous molecules, including steroids (Monnet and Maurice, 2006) (notably progesterone), various sphingolipids (Ramachandran et al., 2009), and N,N-dimethyltryptamine (DMT) (Fontanilla et al., 2009), bind to Sig-1Rs and regulate some of their activities. It is unclear whether any of these ligands mediate endogenous regulation of Sig-1Rs, and none has been shown to link extracellular stimuli to regulation of Sig-1Rs.
Figure 1.

Choline Is an Agonist of Sig-1Rs
(A) Clusters of Sig-1Rs anchored at MAMs are thought to dissociate into monomers when they bind a Sig-1R agonist, freeing Sig-1Rs to interact with their targets, within and beyond MAMs. The targets include IP3Rs.
(B) Specific binding of [3H](+)-pentazocine (5 nM) in the presence of choline and related compounds using membranes from Neuro-2A cells stably expressing Sig-1R-GFP (mean ± SEM; n = 5, with 3 replicates for each). Specific binding of 3H-pentazocine was 90% ± 3% of total binding (mean ± SEM; n = 3) for membranes from cells overexpressing Sig-1R, and 13% ± 5% for mock-transfected cells.
(C) Choline metabolism (structures from http://www.hmdb.ca).
(D) NG108-15 cells were incubated (2 hr, 37°C) with PRE-084 (25 μM) or BD1047 (25 μM), and then, in the continuous presence of the Sig-1R ligands, loaded with Fluo-8 by incubation with Fluo-8 AM in HEPES-buffered saline (HBS) (30 min, 20°C, with a further 30 min to allow de-esterification of Fluo-8). BAPTA (2.5 mM) was then added to chelate extracellular Ca2+ before addition of bradykinin (10 μM). Results show typical responses as means of 3 replicates.
(E) Summary results (mean ± SEM; n = 5, each with 3 replicates) show peak increases in [Ca2+]i (Δ[Ca2+]i) evoked by bradykinin. ∗p < 0.05 for maximal responses relative to control, one-way ANOVA with Dunnett’s test.
(F) Pooled results (mean ± SEM; n = 20; as percentages of matched control response) for all bradykinin concentrations. The asterisk (∗) denotes 95% confidence intervals that exclude 100%.
See also Figure S1A.
Many extracellular stimuli evoke increases in the intracellular free [Ca2+] ([Ca2+]i) through receptors that stimulate phospholipase C (PLC), leading to formation of IP3 and release of Ca2+ from the ER through IP3Rs. Sig-1Rs have been reported to both potentiate the Ca2+ signals evoked by these receptors by increasing the IP3 sensitivity of IP3Rs (Hayashi et al., 2000, Hong et al., 2004, Wu and Bowen, 2008) and to increase the efficiency of Ca2+ transfer from ER to mitochondria through IP3Rs (Hayashi and Su, 2007, Shioda et al., 2012).
Here, we demonstrate that agonists of G-protein-coupled receptors (GPCRs) that stimulate PLC and an increase in [Ca2+]i, also stimulate phospholipase D (PLD). We show that choline produced by PLD is an endogenous agonist of Sig-1Rs, and that it thereby potentiates Ca2+ signals evoked by IP3Rs. Each of the immediate products of choline metabolism, phosphocholine, acetylcholine, and betaine, is inactive. Hence, GPCRs signal to IP3Rs through two parallel pathways that converge to provide coincident stimulation of IP3Rs. In addition, choline uptake by specific transporters allows extracellular choline to stimulate Sig-1Rs and potentiate IP3-evoked Ca2+ signals. We conclude that choline is an endogenous agonist of Sig-1Rs that links both cell signaling pathways (through PLD) and the activity of cholinergic synapses (through choline uptake) to regulation of IP3-evoked Ca2+ signals.
Results
Choline Binds to Sig-1Rs and Potentiates IP3-Evoked Ca2+ Signals
Most high-affinity ligands of Sig-1Rs comprise a tertiary amine flanked by a short acyl chain and hydrophobic moieties (Glennon, 2005, Ossa et al., 2017). Endogenous agonists are unlikely to have such high affinity because they must rapidly associate with and dissociate from Sig-1Rs if they are to acutely regulate them. We considered whether choline, a quaternary amine with an acyl chain but no hydrophobic moieties, might be an endogenous agonist of Sig-1Rs.
(+)-Pentazocine is a high-affinity, selective ligand of Sig-1Rs (equilibrium dissociation constant, Kd = 5.5 nM) (de Costa et al., 1989). Specific binding of [3H](+)-pentazocine to membranes prepared from Neuro-2A cells stably expressing Sig-1R was completely displaced by choline (Ki = 525 μM; pKi = 3.28 ± 0.16; h = 1.07 ± 0.2; mean ± SEM; n = 5; where pKi is the negative log of the Kd, and h is the Hill coefficient) (Figure 1B). Phosphocholine, the major product of choline metabolism in most cells (Figure 1C) (Corbin and Zeisel, 2012), did not displace specific [3H](+)-pentazocine from Sig-1Rs, and the other immediate products of choline metabolism, betaine (Ki = 1.32 mM; pKi = 2.88 ± 0.23; h = 1.40 ± 0.35; n = 5) and acetylcholine (Ki ∼12 mM; n = 5), were less effective than choline. This is consistent with choline binding with greater affinity than its metabolites to the same site as known agonists and antagonists of Sig-1Rs.
Subsequent experiments explore the interactions of choline with Sig-1Rs in NG108-15 cells. These neuroblastoma-glioma hybrid cells retain many properties of neurons, including responsiveness to neurotransmitters, and the ability to synthesize and release acetylcholine (Hamprecht et al., 1985); they express endogenous Sig-1Rs, and their bradykinin receptors stimulate PLC and Ca2+ release from the ER through IP3Rs (Figure S1A). The bradykinin-evoked Ca2+ signals were enhanced by pre-incubation with a Sig-1R agonist (PRE-084) and attenuated by an antagonist (BD1047) (Figures 1D–1F). Microinjection of NG108-15 cells with IP3 evoked a transient increase in [Ca2+]i, whereas microinjection of choline or the Sig-1R agonist, (+)SKF-10047, had no effect. However, co-injection of choline or (+)SKF-10047 with IP3 potentiated the IP3-evoked Ca2+ signals (Figures 2A and 2B). When applied to intact cells, neither choline nor other Sig-1R ligands significantly affected the Ca2+ content of the intracellular stores (Figures S1B and S1C). The potentiation of IP3-evoked Ca2+ release by choline was blocked by pre-incubation with the Sig-1R antagonist, BD1047 (Figure 2B). Neither betaine, phosphocholine, nor acetylcholine mimicked the effects of microinjected choline (Figures 2C and 2D).
Figure 2.

Choline Potentiates IP3-Evoked Ca2+ Release by Stimulating Sig-1Rs
(A) Ca2+ signals recorded from Fura-2-loaded NG108-15 cells after microinjection (∼1% cell volume) of IP3 (pipette concentration, 0.5 μM), (+)SKF-10047 (SKF, 100 μM), or choline (100 mM). Results (n = 6 cells) show untransfected cells or after transfection with scrambled shRNA or Sig-1R shRNA, each tagged with red fluorescent protein (RFP).
(B) Summary (mean ± SD; n = 6) shows peak [Ca2+]i. ∗p < 0.05, ANOVA with Bonferroni test, relative to matched stimuli in untransfected cells. The effects of pre-incubating cells with BD1047 (25 μM, 15 min) are also shown.
(C) Similar analysis of the effects of microinjected IP3 (pipette concentration, 0.5 μM) or acetylcholine, betaine, or phosphocholine (pipette concentration, 100 mM for each), alone or in combination.
(D) Summary (mean ± SD; n = 6) shows peak [Ca2+]i. ∗p < 0.05, ANOVA with Bonferroni test, relative to IP3 alone.
(E) Western blot (WB) of Sig-1R after transfection of NG108-15 cells with scrambled or Sig-1R shRNA, each tagged with RFP. Tagged shRNAs were used to allow identification of transfected cells in microinjection experiments. Hence, WB from cell populations probably over-estimates Sig-1R expression in functional analyses of micro-injected cells treated with Sig-1R shRNA. Sig-1R expression was reduced to 50% ± 12% of control levels by the shRNA treatment (mean ± SD; n = 3).
(F) WB showing detectable expression of Sig-1R in MCF7 cells only after transfection with Sig-1R-GFP. Typical of 4 blots. Mr markers (kDa) are shown.
(G) Ca2+ signals recorded from Fura-2-loaded MCF7 cells after microinjection as described for (C). Results (n = 6 cells) are from control cells or after transfection with GFP or Sig-1R-GFP.
(H) Summary (mean ± SD; n = 6) results show [ΔCa2+]i. ∗p < 0.05 for maximal responses relative to matched untransfected cells, one-way ANOVA with Dunnett’s test.
See also Figures S1B and S1C.
Treatment of NG108-15 cells with appropriate short hairpin RNA (shRNA) reduced expression of Sig-1R (Figure 2E) and abolished the potentiating effects of choline and (+)SKF-10047, without affecting responses to IP3 alone (Figures 2A and 2B). In MCF7 breast cancer cells, Sig-1R expression was scarcely detectable (Figure 2F) (Wu and Bowen, 2008). In these cells, neither microinjected choline nor (+)SKF-10047 potentiated IP3-evoked Ca2+ signals, but the signals were potentiated after expression of Sig-1R-GFP (Figures 2F–2H). These results establish that choline, by activating Sig-1Rs, potentiates IP3-evoked Ca2+ release.
Sig-1Rs Contribute to Ca2+ Signals Evoked by GPCRs
Extracellular ATP stimulates PLC through P2Y6 receptors in NG108-15 cells (Sak et al., 2001). Loss of Sig-1Rs in NG108-15 cells (by shRNA) reduced the amplitude of the Ca2+ signals evoked by maximally effective concentrations of ATP (Figures 3A–3C) or bradykinin (Figure 3D). We next considered whether the contribution of Sig-1Rs to the Ca2+ signals evoked by GPCRs might be mediated by choline. Both mammalian isoforms of PLD (PLD1 and PLD2) are almost ubiquitously expressed enzymes that hydrolyse phosphatidylcholine (PC) to phosphatidic acid (PA) and choline. PLDs are regulated by many signals, including those that stimulate PLC and protein kinase C (PKC) (Selvy et al., 2011).
Figure 3.

Sig-1R and PLD Contribute to Ca2+ Signals Evoked by Agonists of GPCRs
(A) Typical pseudocolor images show peak Ca2+ signals (F340/F380) evoked by ATP (50 μM) in Fura-2-loaded NG108-15 cells transfected with control shRNA or shRNA to PLD1 and PLD2, or Sig-1R, each tagged with RFP. Calibration code (F340/F380) and scale bar (20 μm) apply to all panels.
(B) Time course of response to ATP (bar; n = 6).
(C) Summary (mean ± SD; n = 6) shows Δ[Ca2+]i evoked by ATP. ∗p < 0.05, ANOVA with Bonferroni test, relative to untransfected cells.
(D) Δ[Ca2+]i evoked by bradykinin in populations of NG108-15 cells. Histogram (which shares the y axis) compares responses to bradykinin (10 μM) after treatment with scrambled or Sig-1R shRNA. Results are means ± SEM; n = 3 with duplicate determinations. ∗p < 0.05, Student’s t test.
(E) WB shows effects of indicated shRNA, each tagged with RFP, on expression of PLD1 and PLD2 in NG108-15 cells. Mr markers (kDa) are shown. Results, typical of 3 WBs, underestimate knockdowns in the cells used for Ca2+ measurements, which used only cells shown to be transfected by expression of RFP (see A).
(F and G) Intracellular concentrations of choline (F) and IP3 (G) during stimulation of NG108-15 cells with ATP (50 μM, bar) show the effects of shRNA for PLD1 and PLD2. Results show means ± SD; n = 6.
(H) GPCRs that activate PLC and phospholipase D (PLD) initiate two parallel signaling pathways that converge at IP3Rs. IP3 from PLC directly activates IP3R. Choline from PLD activates Sig-1R, which potentiates IP3-evoked Ca2+ release.
The basal choline concentration in NG108-15 cells (144 ± 7 μM) was similar to values reported for other cells (100–400 μM) (Pelech and Vance, 1984). Stimulation of NG108-15 cells with extracellular ATP increased the intracellular concentrations of both choline and IP3. Knockdown of PLD1 and PLD2 expression using shRNA (Figure 3E) prevented the increase in choline concentration without affecting IP3 production (Figures 3F and 3G). Furthermore, the ATP-evoked Ca2+ signals were similarly and substantially attenuated by loss of Sig-1R or loss of PLDs (Figures 3A–3C). The results so far demonstrate that GPCRs, by stimulating both PLC and PLD, generate parallel signals, IP3 and choline, which converge to stimulate Ca2+ release through IP3Rs (Figure 3H).
Choline Uptake Regulates Ca2+ Signals
Synthesis of acetylcholine within cholinergic nerve terminals requires choline uptake by a high-affinity, Na+-dependent transporter (CHT1 [choline high-affinity transporter 1]) expressed mostly at cholinergic terminals (Haga, 2014, Sarter and Parikh, 2005). Additional Na+-independent transporters mediate low-affinity choline uptake (OCTs [organic cation transporters]); and the widely expressed choline transporter-like proteins (CTL1-5, encoded by SLC44A1-5) mediate high-affinity uptake outside cholinergic terminals (Haga, 2014, Machová et al., 2009, Yamada et al., 2011). NG108-15 cells are capable of high-affinity choline uptake and they express CTL1, but not CHT1 (Machová et al., 2009), consistent with evidence that CTL1 is expressed in neurons and glia (Traiffort et al., 2013).
Incubation of NG108-15 cells with choline caused a time-dependent increase in the amplitude of the Ca2+ signals subsequently evoked by bradykinin (Figure 4A). The effect was minimally affected by removing the extracellular choline immediately before stimulation with bradykinin (Figure S2), suggesting that choline potentiates Ca2+ signals after its transport into cells. Potentiation of bradykinin-evoked Ca2+ signals by extracellular choline was substantially attenuated by loss of Sig-1R (shRNA) or CTL1 (small interfering RNA [siRNA]), but unaffected by scrambled shRNA or siRNA (Figures 4C–4E).
Figure 4.

CTL1-Mediated Choline Uptake Potentiates IP3-Evoked Ca2+ Signals
(A) NG108-15 cells were incubated in HBS alone or with 3 mM choline for the indicated times before adding bradykinin (1 μM) and immediately recording the increase in [Ca2+]i. Results (mean ± SEM; n = 3 with duplicate determinations) show Δ[Ca2+]i evoked by bradykinin.
(B) Summary results (mean ± SEM; n = 3) show bradykinin-evoked Δ[Ca2+]i after incubation with the indicated choline concentrations (105 min).
(C) WB showing effects of the indicated siRNA (for CTL1) or shRNA (for Sig-1R) and their scrambled counterparts on expression of CTL1 and Sig-1R in NG108-15 cells. Mr markers (kDa) are shown.
(D) Summary results (mean ± SD; n = 5) show CTL1 expression in cells treated with the indicated siRNA expressed as a percentage of the matched cells treated with scrambled siRNA.
(E) Summary results (mean ± SEM; n = 5 plates with 2 replicates) show the effects of 10 mM choline on bradykinin-evoked Ca2+ signals. ∗p < 0.05, ∗∗p < 0.01, one-way ANOVA with Dunnett’s test, relative to control (B and E).
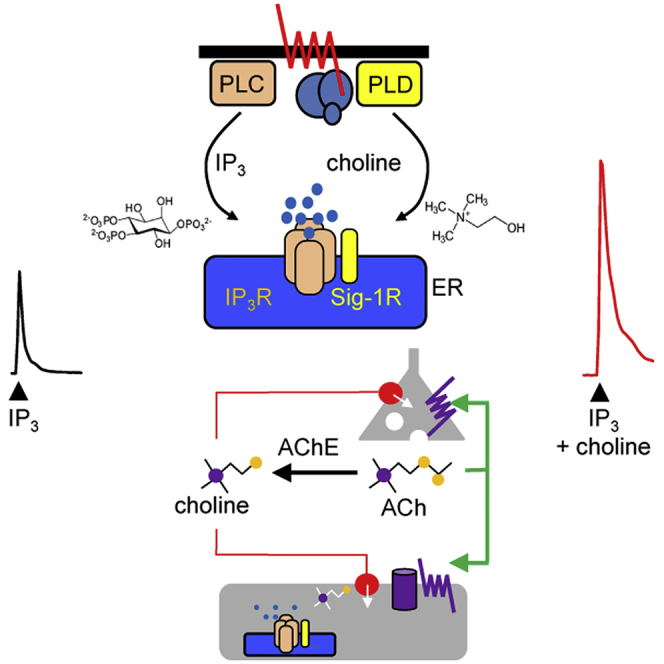
(F) Ca2+-mobilizing GPCRs stimulate PLC and PLD, with consequent formation of IP3 and choline. Although we have not resolved how GPCRs stimulate PLD in NG108-15 cells, signals evoked by both PLC and parallel pathways are known to stimulate PLD. IP3 stimulates IP3R, while choline binds to Sig-1Rs, causing them to potentiate IP3R activity. Metabolism of IP3 and choline terminates their signaling. Hence, GPCRs regulate IP3Rs through two parallel, but converging, pathways. Import of extracellular choline by transporters, including the widely expressed CTL1, can also deliver choline to Sig-1Rs.
(G) Acetylcholine (ACh) released at cholinergic terminals can activate post- and pre-synaptic receptors, before its rapid hydrolysis to choline by acetylcholinesterase (AChE). Hence, synaptic activity is rapidly followed by a substantial local increase in choline concentration. Transporters (red circles) in the cholinergic terminal (CHT1) and neighboring cells (CTL1-5 and OCT) can import the choline, which will then stimulate Sig-1Rs, providing cells with a paracrine reporter of recent synaptic activity.
See also Figure S2.
Discussion
Sig-1Rs respond to many diverse drugs, including some that are commonly abused or used clinically, but it is unclear whether endogenous agonists regulate Sig-1Rs (Maurice and Su, 2009). Here, we provide evidence that choline (Figure 1C), best known as a precursor for synthesis of acetylcholine and PC, the most abundant membrane phospholipid in mammalian cells, is an endogenous agonist of Sig-1Rs. We show that choline meets the three essential criteria of an intracellular messenger, namely it is produced in response to extracellular stimuli, it exerts a specific intracellular action, and it is endogenously deactivated. We conclude that choline is an intracellular messenger linking GPCRs, through Sig-1Rs, to Ca2+ release from intracellular stores (Figure 4F).
Choline mimicked known Sig-1R agonists by competing with (+)-pentazocine for binding to Sig-1Rs (Figure 1B) and by potentiating the Ca2+ signals evoked by receptors that stimulate IP3 formation (Figures 2A, 2B, and 2D). The immediate metabolites of choline were ineffective (Figures 2C and 2D). The effect of choline on Ca2+ signals was attenuated when Sig-1R expression was reduced (Figures 2A, 2B, and 2E); and in cells without Sig-1Rs, expression of Sig-1R endowed the cells with sensitivity to choline (Figures 2F–2H). The Ca2+ signals evoked by GPCRs that stimulate formation of IP3 were attenuated when Sig-1R expression was reduced (Figures 3A–3D). ATP, which stimulates PLC through P2Y6 receptors in NG108-15 cells (Sak et al., 2001), rapidly evoked formation of IP3 and choline, but only the latter required PLDs (Figures 3F and 3G). Furthermore, the ATP-evoked Ca2+ signals were similarly attenuated by loss of PLDs or Sig-1Rs (Figure 3C). Bradykinin-evoked Ca2+ signals were likewise attenuated by loss of Sig-1Rs (Figure 3D).
Many GPCRs that stimulate PLC also activate PLD, and most agonists that activate PLD also stimulate PLC. However, the links between GPCRs and stimulation of mammalian PLD differ between cell types, and the stimulatory signals, which include PKC, Ca2+, small GTPases (rho and ADP-ribosylation factor [Arf]), phosphatidylinositol 4,5-bisphosphate, and phosphatidylinositol 3,4,5-trisphosphate, can be generated by PLC or parallel pathways (Exton, 1999, Selvy et al., 2011). Hitherto, signaling downstream of PLD has been thought to arise entirely, directly or indirectly, from PA (Selvy et al., 2011). We suggest that the other product of PLD activity, namely choline, is also an important intracellular messenger that regulates Sig-1Rs and thereby IP3-evoked Ca2+ release (Figures 3H and 4G). Our estimate of the intracellular choline concentration in NG108-15 cells after GPCR activation (∼900 μM) (Figure 3F) is similar to that required for binding to Sig-1Rs (Ki = 525 μM) (Figure 1B). The low affinity of choline, relative to the many ligands used to establish structure-affinity relationship for Sig-1R (Glennon et al., 1992), is important because it will allow Sig-1R to respond rapidly to acute changes in intracellular choline concentration. We conclude that choline is an endogenous agonist of Sig-1Rs, a consequence of which includes potentiation of IP3-evoked Ca2+ release (Figure 3H).
Choline is an essential nutrient that cells import through transporters from plasma, where the choline concentration is typically 5–10 μM, although it varies with diet (Sarter and Parikh, 2005). At cholinergic synapses, the choline concentration may be much higher (∼1 mM) after synaptic activity, when acetylcholine is rapidly hydrolysed by acetylcholinesterase (Figure 4G). Our results show that extracellular choline, at concentrations encompassing likely synaptic concentrations, potentiates GPCR-evoked Ca2+ signals. The potentiation requires both Sig1R and the choline transporter, CTL1 (Figures 4A–4E and S2). These observations suggest an additional signaling role, whereby changes in extracellular choline concentration might regulate Sig-1Rs and thereby Ca2+ signaling. Such a mechanism might be particularly effective at cholinergic synapses of neuromuscular junctions or within the autonomic nervous system (Picciotto et al., 2012), where rapid transient increases in choline concentration follow synaptic activity. Choline might then determine the sensitivity of adjacent neurons or glia to PLC-coupled GPCRs (Figure 4G), consistent with many reported interactions between Sig-1Rs and cholinergic transmission (van Waarde et al., 2011). Hence, choline, as an endogenous agonist of Sig-1Rs, may be both an intracellular messenger linking GPCRs through PLD to Sig-1Rs (Figure 4F); and a paracrine signal at cholinergic synapses linking synaptic activity, through choline transporters, to Sig-1R regulation in nearby cells (Figure 4G).
We conclude that choline is an endogenous agonist of Sig-1Rs. Although we examined the consequences of activating Sig-1Rs only in the context of IP3-evoked Ca2+ signals, it is likely that choline, like other agonists of Sig-1Rs, also promotes interaction of Sig-1Rs with other signaling proteins. We propose that choline may be delivered to Sig-1Rs as a paracrine reporter of activity at cholinergic synapses through choline transporters, or as an intracellular messenger from PLD activated by GPCRs (Figures 4F and 4G). The GPCRs that stimulate both PLC and PLD thereby send parallel signals to IP3Rs: IP3 directly activates IP3Rs, while choline stimulates Sig-1Rs, which potentiate IP3R activity. IP3Rs thereby function as coincidence detectors, integrating signals from IP3 and Sig-1Rs (Figures 3G and 4F).
STAR★Methods
Key Resources Table
| REAGENT OR RESOURCE | SOURCE | IDENTIFIER |
|---|---|---|
| Antibodies | ||
| Donkey anti-rabbit IgG-HRP (1:5000) | Santa Cruz Biotechnology Inc, Dallas, TX | Cat# sc-2313 |
| Goat anti-mouse IgG-HRP (1:2000) | Santa Cruz Biotechnology | Cat# sc-2005 |
| IRDye 800CW-conjugated goat anti-rabbit IgG (1:10,000) | LI-COR, Lincoln, NE | Cat# 926-32211 |
| IRDye 680-conjugated goat anti-mouse IgG (1:10,000) | LI-COR | Cat# 926-32220 |
| Rabbit anti-Sig-1R (1:200) | OriGene, Rockville, MD | Cat# TA302033 |
| Rabbit anti-Sig-1R (2 μg/mL) | AbCam, Cambridge, UK | Cat# 53852 |
| Mouse anti-GFP (1:2000) | OriGene | Cat# TA150041 |
| Mouse anti-PLD1 (1:200) | Santa Cruz Biotechnology | Cat# sc-25512 |
| Mouse anti-PLD2 (3 μg/mL) | Abnova Corporation, Taipei, Taiwan | Cat# H00005338 |
| Rabbit anti-β-actin (1:2000) | Santa Cruz Biotechnology | Cat# sc-1616 |
| Mouse anti-β-actin (1:1000) | Cell Signaling Technology, Boston, MA | Cat# 8H10D10 |
| Mouse anti-β-actin (1:10,000) | Sigma-Aldrich, St. Louis, MO | Cat# A5441 |
| Rabbit anti-CTL1 (1:500) | ThermoFisher, Basingstoke, UK | Cat# AB_2556158 |
| Chemicals, Peptides, and Recombinant Proteins | ||
| Acetylcholine chloride | Chem-IMPEX International, Wood Dale, IL | Cat# 00770 |
| Acetylcholine chloride | Sigma-Aldrich | Cat# A6625 |
| ATP | Sigma-Aldrich | Cat# A9187 |
| BAPTA | Molekula, Dorset, UK | Cat# 20358510 |
| Betaine hydrochloride | Sigma-Aldrich | Cat# 61962 |
| BD1047 dihydrobromide | Tocris, Abingdon, UK | Cat# 0956 |
| Bradykinin acetate salt | Sigma-Aldrich | Cat# B3259 |
| Bovine serum albumin (BSA) | Europa Bioproducts Ltd, Cambridge, UK | Cat# EQBAH64 |
| Choline chloride | Sigma-Aldrich | Cat# C7017 |
| cOmplete™ protease inhibitor cocktail | Sigma-Aldrich | Cat# 4693116001 |
| Dimethyl sulfoxide (DMSO) | Sigma-Aldrich | Cat# D2650 |
| DMEM/F-12, GlutaMAX medium | ThermoFisher | Cat# 31331028 |
| ECL Prime | GE Healthcare, Little Chalfont, UK | Cat# RPN2232 |
| Fluo-8 AM | AAT Bioquest, Cambridge, UK | Cat# 21802 |
| Fetal bovine serum (FBS) | Sigma-Aldrich | Cat# F7524, batch 094M3341 |
| Fura-2 AM | AAT Bioquest | Cat# 21020 |
| ThermoFisher | Cat# F1221 | |
| G-418 | ThermoFisher | Cat# 10131027 |
| Glucose | ThermoFisher | Cat# 10141520 |
| Haloperidol | Sigma-Aldrich | Cat# H1512 |
| Hank’s balanced salt solution (HBSS) | ThermoFisher | Cat# 21-023-CV |
| HEPES | Merck Millipore | Cat# 391338 |
| Ionomycin | Apollo Scientific, Stockport, UK | Cat# 56092-81-0 |
| Lipofectamine | ThermoFisher | Cat# 18324012 |
| Lipofectamine RNAiMax | ThermoFisher | Cat# 13778150 |
| Odyssey blocking buffer | LI-COR | Cat# 927-50000 |
| Opti-MEM I | ThermoFisher | Cat# 11058-021 |
| [3H]-(+)-Pentazocine (26.9 Ci/mmol) | Perkin-Elmer, Richmond, CA | Cat# NET10560250UC |
| PRE-084 hydrochloride | Tocris | Cat# 0589 |
| Phosphocholine chloride | Tokyo Chemical Industry, Japan | Cat# P0834 |
| Pluronic F127 | Sigma-Aldrich | Cat# P2443 |
| Polyethyleneimine | Sigma-Aldrich | Cat# P3143 |
| RPMI medium | ThermoFisher | Cat# MT10041CM |
| (+)SKF-10047 hydrochloride | Tocris | Cat# 1079 |
| Sodium fluoride | Sigma-Aldrich | Cat# S7920 |
| Sodium orthovanadate | Sigma-Aldrich | Cat# S6508 |
| TurboFectin 8.0 | OriGene | Cat# TF81001 |
| Tris base | ThermoFisher | Cat# BP152-1 |
| Triton X-100 | Sigma-Aldrich | Cat# T8787 |
| Tween-20 | Sigma-Aldrich | Cat# T5927 |
| Critical Commercial Assays | ||
| BCA protein assay kit (Pierce) | ThermoFisher | Cat# 23225 |
| Choline assay kit | BioVision, Mountain View, CA | Cat# K615-100 |
| IP3 assay kit | DiscoveRx, Fremont, CA | Cat# 90-0037 |
| Experimental Models: Cell Lines | ||
| NG108-15 cells | American Type Culture Collection (ATCC), Manassas, VA | Cat# ATCC HB-12317 |
| MCF7 cells | ATCC | Cat# ATCC HTB-22 |
| Neuro-2A cells | ATCC | Cat# ATCC CCL-131 |
| Recombinant DNA | ||
| Human Sig-1R-GFP in pCMV6-AC-GFP | OriGene | Cat# RG201206 |
| RFP-tagged shRNA (HuSH, 29-mer shRNA in pRFP-C-RS) against human Sig-1R [GAGTAT GTGCTGCTCTTCGGCACCGCCTT] |
OriGene | Cat# TF311012 |
| FI344041 | ||
| RFP-tagged shRNA (HuSH, 29-mer shRNA in pRFP-C-RS) against rat PLD1 [GCCTCTATCG CCAACTTCACCGCCGTAAT] |
OriGene | Cat# TF711124 |
| FI744500 | ||
| RFP-tagged shRNA (HuSH, 29-mer shRNA in pRFP-C-RS) against rat PLD2 [GGAGACTGG ACATTATGCTCAAGAGGAAG] |
OriGene | Cat# TF711696 |
| FI746786 | ||
| RFP-tagged scrambled shRNA (HuSH, 29-mer scrambled shRNA in pRFP-C-RS) | OriGene | Cat# TF311012 |
| TR30015 | ||
| Silencer siRNA (3 different 21-bp siRNA) against rat CTL1 (SLC44A1) | ThermoFisher | Cat# 192756 |
| Cat# 192757 | ||
| Cat# 55087 | ||
| Control Silencer siRNA | ThermoFisher | Cat# AM4611 |
| Software and Algorithms | ||
| Prism 5, version 5 | GraphPad, La Jolla | https://www.graphpad.com/ |
| GeneTools, version 4 | Syngene, Cambridge, UK | https://www.syngene.com/ |
| Odyssey, version 3 | LI-COR | https://www.licor.com/ |
| SoftMax Pro, version 7 | Molecular Devices, San Jose, CA | https://www.moleculardevices.com/ |
| NIS-Elements AR 3.1 | Nikon, Melville, NY | https://www.nikon.com/ |
Contact for Reagent and Resource Sharing
Further information and requests for resources and reagents should be directed to and will be fulfilled by the Lead Contact, Colin W. Taylor (cwt1000@cam.ac.uk).
Experimental Model and Subject Details
The NG108-15 cell line (ATCC) is a somatic hybrid derived from a mouse neuroblastoma and rat glioma. NG108-15 cells were grown in DMEM/F12 with 10% fetal bovine serum (FBS). MCF7 cells (ATCC) were derived from a human metastatic mammary tumor. These cells were grown in RPMI with 10% FBS. Neuro-2A cells (ATCC), which were used only for heterologous expression of Sig-1R-GFP for radioligand binding analyses, were derived from a mouse neuroblastoma. Neuro-2A cells were grown in DMEM containing 10% FBS, and further supplemented with G-418 (100 μg/mL) for the cells stably expressing Sig-1R-GFP. We have not established the sex of the animals from which NG108-15 and Neuro-2A cells were derived. All cells were grown in humidified air at 37°C with 5% CO2. Cells were passaged when they reached around 80% confluence. The authenticity of the cell lines was not confirmed, but screening established that all cells were free of mycoplasma.
Method Details
Transfection of Cells
Cells were transiently transfected using either TurboFectin 8.0 or electroporation. For the former, plasmid DNA was added to TurboFectin 8.0 in OptiMEM I (TurboFectin:DNA, 3:1), incubated (15-30 min, 20°C), and the complex was then added to cells in 6-well plates (1-1.5 μg DNA/well) in complete medium, and incubated for 24-48 h. For electroporation, cells (80%–90% confluent in a T75 flask) were scraped into culture medium, centrifuged (150 xg, 5 min), and resuspended in Opti-MEM I (2 × 10⁶ cells/mL). Cells (500 μL) were transferred to electroporation cuvettes (800 μL, 4-mm gap; Eppendorf, Hamburg, Germany) with plasmid DNA (5-10 μg/cuvette) and the cells were subjected to electroporation using a GenePulser Xcell (BioRad, 200-250V, 700-900 μF, 18-20 ms). Transfected cells were plated in Opti-MEM I in 6-well plates, FBS (10%) was added after 4 h, and the medium was replaced after 24 h.
Neuro-2A cells stably expressing Sig-1R-GFP were generated by transfecting cells with plasmid encoding human Sig-1R-GFP using Lipofectamine. Cells were grown in medium containing G418 (400 μg/mL), and after 2 weeks resistant colonies were selected and propagated. Stable cell lines with intermediate levels of Sig-1R-GFP expression (determined by fluorescence microscopy) were identified and then maintained in DMEM supplemented with FCS (10%) and G418 (100 μg/mL).
For expression of human Sig-1R-GFP, cells grown in 6-well plates were transfected with 1-1.5 μg DNA/well. To reduce expression of Sig-1R or PLDs, RFP-tagged shRNA constructs were used. Each set of constructs included four different 29-mer targeting shRNA in a pRFP-C-RS plasmid. Using methods reported previously (Brailoiu et al., 2016), we used western blotting to assess the ability of each individual construct to reduce expression of its target protein (Sig-1R, PLD1 or PLD2). The most effective shRNA construct from each set was used for the experiments described here. The constructs were used individually for Sig-1R knockdown (2 μg/mL) or as a pair for knockdown of PLD1 and PLD2 (1 μg/mL of each). The same scrambled RFP-shRNA construct (2 μg/mL) was used as a control for all shRNA analyses.
Lipofectamine RNAiMax was used to transfect cells simultaneously with three different siRNAs against CTL1 (50 nM of each) to reduce CTL1 expression. A siRNA with no known target in mammalian genomes (150 nM) was used as a control for the siRNA experiments (Silencer control, ThermoFisher). Cells were used 24-48 h after transfection.
Radioligand Binding
Membranes were prepared from Neuro-2A cells stably expressing Sig-1R-GFP (Wu and Bowen, 2008). Cells (∼1.7 × 10⁸) were harvested (500 xg, 5 min) in phosphate-buffered saline (PBS) containing EGTA (1 mM), homogenized in cold medium (10 mL; 50 mM Tris-HCl, 320 mM sucrose, 2 mM EDTA, 5 mM MgCl2, pH 7.4), centrifuged (50,000 xg, 4°C, 10 min), the pellet was then resuspended by homogenization (2 mg protein/mL) in binding medium (50 mM Tris-HCl, 1 mM EDTA, 3 mM MgCl2, pH 7.4) and stored at −80°C. Binding assays (final volume 500 μL) were performed in glass tubes with binding medium containing BSA (5 mg/mL), [3H](+)-pentazocine (5 nM, 26.9 Ci/mmol), competing ligands and membranes (100 μg). After 1 h at 30°C, bound ligand was recovered by rapid filtration through Whatman GF/C filters pre-soaked in polyethyleneimine (0.1%, 2 h), the filters were washed twice, and their radioactivity was determined by liquid scintillation counting. Non-specific binding was determined in the presence of 5 μM haloperidol.
Western Blotting
Lysates were prepared from cells 48 h after transfection. Cells were collected (150 xg, 5 min) and lysed (1 h, 4°C) in medium comprising: NaCl (50 mM), Tris (20 mM), Mg acetate (10 mM), Triton X-100 (1%, v/v), cOmplete protease inhibitor mixture, Na orthovanadate (1 mM) and Na fluoride (5 mM), pH 7.3. After centrifugation (14,000 xg, 15 min), the supernatant was collected and its protein concentration determined using a BCA assay kit. Cell lysates, which were used immediately or after storage at −80°C, were subject to SDS-PAGE using Mini-PROTEAN TGX 4%–20% gels (BioRad, Hercules, CA) or NuPAGE 4%–12% Bis-Tris gels (Invitrogen, Paisley, UK). Proteins were transferred to Odyssey nitrocellulose membranes (LI-COR Biosciences) or PVDF membranes (iBlot, Invitrogen). Membranes were washed and blocked (1 h, 20°C) with Odyssey blocking buffer or TBST (137 mM NaCl, 20 mM Tris, 0.1% Tween-20, pH 7.6) supplemented with 5% (w/v) BSA. Membranes were incubated (12 h, 4°C) with primary antibodies in TBST and 1% BSA, washed with TBST (3 × 5 min), incubated with secondary antibodies in TBST and 1% BSA (1 h, 20°C), and then washed with TBST. Bands were visualized by infrared emission (LI-COR Infrared Imager, resolution 169 μm, intensity 4.5-6) or by incubation with HRP-conjugated secondary antibodies (1 h), followed by washing and detection with ECL Prime. Densitometric analysis used Odyssey or GeneTools software, or ImageJ (NIH, Bethesda, USA). The antibodies used and their dilutions are listed in the Key Resources Table.
Microinjection and Analysis of Ca2+ Signals in Single Cells
For measurements of [Ca2+]i in single Fura-2-loaded cells grown on glass coverslips (#1.5, 25-mm diameter, Warner Instruments), cells were incubated with Fura-2 AM (5 μM, 45 min, 20°C) in Hanks’ balanced salt solution (HBSS), washed 3 times, and incubated for a further 45 min before experiments (Brailoiu et al., 2009). Fluorescence images (alternate excitation at 340 and 380 nm; emission at 510 nm) were acquired at 0.25 Hz using an inverted Nikon Eclipse Ti microscope with a Perfect Focus System and a CoolSnap HQ2 CCD camera (Photometrics Scientific). Images were acquired and analyzed using NIS-Elements AR 3.1 software (Nikon). After correction for background, determined from an area outside the cell, fluorescence ratios (F340/F380) were calibrated to [Ca2+]i (Grynkiewicz et al., 1985). Injections were performed using Femtotips II, InjectMan N I2 and FemtoJet systems (Eppendorf) (Brailoiu et al., 2009). Pipettes were back-filled with intracellular solution (110 mM KCl, 10 mM NaCl, 20 mM HEPES, pH 7.2) (Guse et al., 1997) and appropriate drugs. The injection time was 0.4 s at 60 hPa with a compensation pressure of 20 hPa in order to inject ∼1% of the cell volume.
Measurement of Ca2+ Signals in Cell Populations
For measurements of [Ca2+]i in cell populations, confluent cultures of cells in 96-well plates were loaded with Fluo-8 by incubation with Fluo-8 AM (2 μM, 30 min, 20°C) in HEPES-buffered saline (HBS) supplemented with 0.02% pluronic acid. The medium was then replaced with HBS, and after 30 min at 20°C to allow de-esterification of the indicator, fluorescence was recorded using a FlexStation III plate-reader (MDS Analytical Devices, Wokingham, UK) (Konieczny et al., 2017, Tovey et al., 2006). Fluorescence was captured and processed using SoftMax Pro software. All measurements were performed in HBS at 20°C. HBS comprised: 135 mM NaCl, 5.9 mM KCl, 1.2 mM MgCl2, 1.5 mM CaCl2, 11.5 mM glucose, 11.6 mM HEPES, pH 7.3. Fluorescence was recorded at 1.44 s intervals, with excitation at 485 nm and emission at 525 nm. The minimal (Fmin, Ca2+-free indicator) and maximal (Fmax, Ca2+-saturated indicator) fluorescence values were determined from several parallel wells in each plate after addition of Triton X-100 (0.1%) with either BAPTA (10 mM, for Fmin) or CaCl2 (10 mM, for Fmax). Fluorescence values (F) were then calibrated to [Ca2+]i from:
The KD of fluo-8 was assumed to be 389 nM.
Measurements of Intracellular IP3 and Choline Concentrations
NG108-15 cells (1010 cells) in HBSS (0.5 mL, 20°C) were stimulated with ATP and the reaction was terminated by addition of cold HClO4 (1 mL, 0.75 M). After centrifugation (2000 × g, 5 min, 4°C), the supernatant was removed, PBS (270 μL) was added, and the mixture was sonicated. After centrifugation (15,000 × g, 10 min), assay kits were used to determine the amounts of choline (BioVision Inc.) and IP3 (DiscoveRx) in the supernatant, according to the manufacturer’s instructions. A volume of 2.5 pL for an NG108-15 cell (Rouzaire-Dubois and Dubois, 1997) was used to calculate intracellular concentrations of IP3 and choline.
Quantification and Statistical Analysis
For analyses of radioligand binding results, each equilibrium competition-binding curve was fitted to a logistic equation (GraphPad Prism, version 5), from which the half-maximal inhibitory concentration (IC50) and Hill coefficient (h) were determined. The IC50 value, [3H](+)-pentazocine concentration (5 nM) and Kd of (+)pentazocine for Sig-1R (5.5 nM) (de Costa et al., 1989) were used to calculate Ki values (Ki is the Kd determined by equilibrium competition binding) (Cheng and Prusoff, 1973). The negative logarithms of these individual Ki values (pKi) were pooled for statistical analysis. All results are presented as means ± SD or SEM, as appropriate, from n independent analyses. ANOVA, followed by Dunnett’s, Bonferroni or Tukey tests, was used to evaluate differences between groups (GraphPad Prism, version 5). p < 0.05 was considered significant. The tests used are reported in the figure legends.
Acknowledgments
This work was supported by the Wellcome Trust (101844 to C.W.T.) and NIH (R01 DA035926 to M.E.A., P30 DA 013429 to E.M.U., and R03 NS099957 to G.C.B.).
Author Contributions
E.B. and C.W.T. supervised the study. E.B., S.C., G.C.B., P.Z., J.L.B., and M.A.I. performed experiments. E.B., S.C., E.M.U., M.E.A., and C.W.T. conceived and designed experiments, and analyzed and interpreted experimental data. E.B. and C.W.T. wrote the manuscript with contributions from all authors. All authors commented on the manuscript.
Declaration of Interests
The authors declare no competing interests.
Published: January 8, 2019
Footnotes
Supplemental Information includes two figures and can be found with this article online at https://doi.org/10.1016/j.celrep.2018.12.051.
Contributor Information
Eugen Brailoiu, Email: ebrailou@temple.edu.
Colin W. Taylor, Email: cwt1000@cam.ac.uk.
Supplemental Information
References
- Alon A., Schmidt H., Zheng S., Kruse A.C. Structural perspectives on sigma-1 receptor function. Adv. Exp. Med. Biol. 2017;964:5–13. doi: 10.1007/978-3-319-50174-1_2. [DOI] [PubMed] [Google Scholar]
- Aydar E., Palmer C.P., Klyachko V.A., Jackson M.B. The sigma receptor as a ligand-regulated auxiliary potassium channel subunit. Neuron. 2002;34:399–410. doi: 10.1016/s0896-6273(02)00677-3. [DOI] [PubMed] [Google Scholar]
- Brailoiu E., Churamani D., Cai X., Schrlau M.G., Brailoiu G.C., Gao X., Hooper R., Boulware M.J., Dun N.J., Marchant J.S., Patel S. Essential requirement for two-pore channel 1 in NAADP-mediated calcium signaling. J. Cell Biol. 2009;186:201–209. doi: 10.1083/jcb.200904073. [DOI] [PMC free article] [PubMed] [Google Scholar]
- Brailoiu G.C., Deliu E., Console-Bram L.M., Soboloff J., Abood M.E., Unterwald E.M., Brailoiu E. Cocaine inhibits store-operated Ca2+ entry in brain microvascular endothelial cells: critical role for sigma-1 receptors. Biochem. J. 2016;473:1–5. doi: 10.1042/BJ20150934. [DOI] [PMC free article] [PubMed] [Google Scholar]
- Cheng Y., Prusoff W.H. Relationship between the inhibition constant (Ki) and the concentration of inhibitor which causes 50 per cent inhibition (IC50) of an enzymatic reaction. Biochem. Pharmacol. 1973;22:3099–3108. doi: 10.1016/0006-2952(73)90196-2. [DOI] [PubMed] [Google Scholar]
- Corbin K.D., Zeisel S.H. Choline metabolism provides novel insights into nonalcoholic fatty liver disease and its progression. Curr. Opin. Gastroenterol. 2012;28:159–165. doi: 10.1097/MOG.0b013e32834e7b4b. [DOI] [PMC free article] [PubMed] [Google Scholar]
- de Costa B.R., Bowen W.D., Hellewell S.B., Walker J.M., Thurkauf A., Jacobson A.E., Rice K.C. Synthesis and evaluation of optically pure [3H]-(+)-pentazocine, a highly potent and selective radioligand for sigma receptors. FEBS Lett. 1989;251:53–58. doi: 10.1016/0014-5793(89)81427-9. [DOI] [PubMed] [Google Scholar]
- Exton J.H. Regulation of phospholipase D. Biochim. Biophys. Acta. 1999;1439:121–133. doi: 10.1016/s1388-1981(99)00089-x. [DOI] [PubMed] [Google Scholar]
- Fontanilla D., Johannessen M., Hajipour A.R., Cozzi N.V., Jackson M.B., Ruoho A.E. The hallucinogen N,N-dimethyltryptamine (DMT) is an endogenous sigma-1 receptor regulator. Science. 2009;323:934–937. doi: 10.1126/science.1166127. [DOI] [PMC free article] [PubMed] [Google Scholar]
- Glennon R.A. Pharmacophore identification for sigma-1 (sigma1) receptor binding: application of the “deconstruction-reconstruction-elaboration” approach. Mini Rev. Med. Chem. 2005;5:927–940. doi: 10.2174/138955705774329519. [DOI] [PubMed] [Google Scholar]
- Glennon M.C., Bird G.S.J., Kwan C.-Y., Putney J.W., Jr. Actions of vasopressin and the Ca2+-ATPase inhibitor, thapsigargin, on Ca2+ signaling in hepatocytes. J. Biol. Chem. 1992;267:8230–8233. [PubMed] [Google Scholar]
- Gromek K.A., Suchy F.P., Meddaugh H.R., Wrobel R.L., LaPointe L.M., Chu U.B., Primm J.G., Ruoho A.E., Senes A., Fox B.G. The oligomeric states of the purified sigma-1 receptor are stabilized by ligands. J. Biol. Chem. 2014;289:20333–20344. doi: 10.1074/jbc.M113.537993. [DOI] [PMC free article] [PubMed] [Google Scholar]
- Grynkiewicz G., Poenie M., Tsien R.Y. A new generation of Ca2+ indicators with greatly improved fluorescence properties. J. Biol. Chem. 1985;260:3440–3450. [PubMed] [Google Scholar]
- Gueguinou M., Crottès D., Chantôme A., Rapetti-Mauss R., Potier-Cartereau M., Clarysse L., Girault A., Fourbon Y., Jézéquel P., Guérin-Charbonnel C. The SigmaR1 chaperone drives breast and colorectal cancer cell migration by tuning SK3-dependent Ca2+ homeostasis. Oncogene. 2017;36:3640–3647. doi: 10.1038/onc.2016.501. [DOI] [PubMed] [Google Scholar]
- Guse A.H., Berg I., da Silva C.P., Potter B.V., Mayr G.W. Ca2+ entry induced by cyclic ADP-ribose in intact T-lymphocytes. J. Biol. Chem. 1997;272:8546–8550. doi: 10.1074/jbc.272.13.8546. [DOI] [PubMed] [Google Scholar]
- Haga T. Molecular properties of the high-affinity choline transporter CHT1. J. Biochem. 2014;156:181–194. doi: 10.1093/jb/mvu047. [DOI] [PubMed] [Google Scholar]
- Hamprecht B., Glaser T., Reiser G., Bayer E., Propst F. Culture and characteristics of hormone-responsive neuroblastoma X glioma hybrid cells. Methods Enzymol. 1985;109:316–341. doi: 10.1016/0076-6879(85)09096-6. [DOI] [PubMed] [Google Scholar]
- Hayashi T., Su T.P. Sigma-1 receptor chaperones at the ER-mitochondrion interface regulate Ca2+ signaling and cell survival. Cell. 2007;131:596–610. doi: 10.1016/j.cell.2007.08.036. [DOI] [PubMed] [Google Scholar]
- Hayashi T., Maurice T., Su T.P. Ca2+ signaling via sigma1-receptors: novel regulatory mechanism affecting intracellular Ca2+ concentration. J. Pharmacol. Exp. Ther. 2000;293:788–798. [PubMed] [Google Scholar]
- Hong W., Nuwayhid S.J., Werling L.L. Modulation of bradykinin-induced calcium changes in SH-SY5Y cells by neurosteroids and sigma receptor ligands via a shared mechanism. Synapse. 2004;54:102–110. doi: 10.1002/syn.20069. [DOI] [PubMed] [Google Scholar]
- Konieczny V., Tovey S.C., Mataragka S., Prole D.L., Taylor C.W. Cyclic AMP recruits a discrete intracellular Ca2+ store by unmasking hypersensitive IP3 receptors. Cell Rep. 2017;18:711–722. doi: 10.1016/j.celrep.2016.12.058. [DOI] [PMC free article] [PubMed] [Google Scholar]
- Machová E., O’Regan S., Newcombe J., Meunier F.M., Prentice J., Dove R., Lisá V., Dolezal V. Detection of choline transporter-like 1 protein CTL1 in neuroblastoma x glioma cells and in the CNS, and its role in choline uptake. J. Neurochem. 2009;110:1297–1309. doi: 10.1111/j.1471-4159.2009.06218.x. [DOI] [PubMed] [Google Scholar]
- Maurice T., Su T.P. The pharmacology of sigma-1 receptors. Pharmacol. Ther. 2009;124:195–206. doi: 10.1016/j.pharmthera.2009.07.001. [DOI] [PMC free article] [PubMed] [Google Scholar]
- Mishra A.K., Mavlyutov T., Singh D.R., Biener G., Yang J., Oliver J.A., Ruoho A., Raicu V. The sigma-1 receptors are present in monomeric and oligomeric forms in living cells in the presence and absence of ligands. Biochem. J. 2015;466:263–271. doi: 10.1042/BJ20141321. [DOI] [PMC free article] [PubMed] [Google Scholar]
- Monnet F.P., Maurice T. The sigma1 protein as a target for the non-genomic effects of neuro(active)steroids: molecular, physiological, and behavioral aspects. J. Pharmacol. Sci. 2006;100:93–118. doi: 10.1254/jphs.cr0050032. [DOI] [PubMed] [Google Scholar]
- Ossa F., Schnell J.R., Ortega-Roldan J.L. A review of the human sigma-1 receptor structure. Adv. Exp. Med. Biol. 2017;964:15–29. doi: 10.1007/978-3-319-50174-1_3. [DOI] [PubMed] [Google Scholar]
- Pelech S.L., Vance D.E. Regulation of phosphatidylcholine biosynthesis. Biochim. Biophys. Acta. 1984;779:217–251. doi: 10.1016/0304-4157(84)90010-8. [DOI] [PubMed] [Google Scholar]
- Picciotto M.R., Higley M.J., Mineur Y.S. Acetylcholine as a neuromodulator: cholinergic signaling shapes nervous system function and behavior. Neuron. 2012;76:116–129. doi: 10.1016/j.neuron.2012.08.036. [DOI] [PMC free article] [PubMed] [Google Scholar]
- Ramachandran S., Chu U.B., Mavlyutov T.A., Pal A., Pyne S., Ruoho A.E. The sigma1 receptor interacts with N-alkyl amines and endogenous sphingolipids. Eur. J. Pharmacol. 2009;609:19–26. doi: 10.1016/j.ejphar.2009.03.003. [DOI] [PMC free article] [PubMed] [Google Scholar]
- Rouzaire-Dubois B., Dubois J.M. A proton pump contributes to neuroblastoma x glioma cell membrane potentials. Pflugers Arch. 1997;434:750–755. doi: 10.1007/s004240050461. [DOI] [PubMed] [Google Scholar]
- Sak K., Samuel K., Kelve M., Webb T.E. Pharmacological characterisation of pyrimidinoceptor responses in NG108-15 cells. Eur. J. Pharmacol. 2001;415:127–133. doi: 10.1016/s0014-2999(01)00845-7. [DOI] [PubMed] [Google Scholar]
- Sarter M., Parikh V. Choline transporters, cholinergic transmission and cognition. Nat. Rev. Neurosci. 2005;6:48–56. doi: 10.1038/nrn1588. [DOI] [PubMed] [Google Scholar]
- Schmidt H.R., Zheng S., Gurpinar E., Koehl A., Manglik A., Kruse A.C. Crystal structure of the human σ1 receptor. Nature. 2016;532:527–530. doi: 10.1038/nature17391. [DOI] [PMC free article] [PubMed] [Google Scholar]
- Selvy P.E., Lavieri R.R., Lindsley C.W., Brown H.A. Phospholipase D: enzymology, functionality, and chemical modulation. Chem. Rev. 2011;111:6064–6119. doi: 10.1021/cr200296t. [DOI] [PMC free article] [PubMed] [Google Scholar]
- Shioda N., Ishikawa K., Tagashira H., Ishizuka T., Yawo H., Fukunaga K. Expression of a truncated form of the endoplasmic reticulum chaperone protein, σ1 receptor, promotes mitochondrial energy depletion and apoptosis. J. Biol. Chem. 2012;287:23318–23331. doi: 10.1074/jbc.M112.349142. [DOI] [PMC free article] [PubMed] [Google Scholar]
- Smith S.B., Su T.-P. Sigma receptors: Their role in disease and as therapeutic targets. Adv. Exp. Med. Biol. 2017;961:1–312. doi: 10.1007/978-3-319-50174-1_1. [DOI] [PubMed] [Google Scholar]
- Srivats S., Balasuriya D., Pasche M., Vistal G., Edwardson J.M., Taylor C.W., Murrell-Lagnado R.D. Sigma1 receptors inhibit store-operated Ca2+ entry by attenuating coupling of STIM1 to Orai1. J. Cell Biol. 2016;213:65–79. doi: 10.1083/jcb.201506022. [DOI] [PMC free article] [PubMed] [Google Scholar]
- Su T.P., Su T.C., Nakamura Y., Tsai S.Y. The sigma-1 receptor as a pluripotent modulator in living systems. Trends Pharmacol. Sci. 2016;37:262–278. doi: 10.1016/j.tips.2016.01.003. [DOI] [PMC free article] [PubMed] [Google Scholar]
- Tovey S.C., Sun Y., Taylor C.W. Rapid functional assays of intracellular Ca2+ channels. Nat. Protoc. 2006;1:259–263. doi: 10.1038/nprot.2006.40. [DOI] [PubMed] [Google Scholar]
- Traiffort E., O’Regan S., Ruat M. The choline transporter-like family SLC44: properties and roles in human diseases. Mol. Aspects Med. 2013;34:646–654. doi: 10.1016/j.mam.2012.10.011. [DOI] [PubMed] [Google Scholar]
- van Waarde A., Ramakrishnan N.K., Rybczynska A.A., Elsinga P.H., Ishiwata K., Nijholt I.M., Luiten P.G., Dierckx R.A. The cholinergic system, sigma-1 receptors and cognition. Behav. Brain Res. 2011;221:543–554. doi: 10.1016/j.bbr.2009.12.043. [DOI] [PubMed] [Google Scholar]
- Walker J.M., Bowen W.D., Walker F.O., Matsumoto R.R., De Costa B., Rice K.C. Sigma receptors: biology and function. Pharmacol. Rev. 1990;42:355–402. [PubMed] [Google Scholar]
- Watanabe S., Ilieva H., Tamada H., Nomura H., Komine O., Endo F., Jin S., Mancias P., Kiyama H., Yamanaka K. Mitochondria-associated membrane collapse is a common pathomechanism in SIGMAR1- and SOD1-linked ALS. EMBO Mol. Med. 2016;8:1421–1437. doi: 10.15252/emmm.201606403. [DOI] [PMC free article] [PubMed] [Google Scholar]
- Wu Z., Bowen W.D. Role of sigma-1 receptor C-terminal segment in inositol 1,4,5-trisphosphate receptor activation: constitutive enhancement of calcium signaling in MCF-7 tumor cells. J. Biol. Chem. 2008;283:28198–28215. doi: 10.1074/jbc.M802099200. [DOI] [PMC free article] [PubMed] [Google Scholar]
- Yamada T., Inazu M., Tajima H., Matsumiya T. Functional expression of choline transporter-like protein 1 (CTL1) in human neuroblastoma cells and its link to acetylcholine synthesis. Neurochem. Int. 2011;58:354–365. doi: 10.1016/j.neuint.2010.12.011. [DOI] [PubMed] [Google Scholar]
- Yano H., Bonifazi A., Xu M., Guthrie D.A., Schneck S.N., Abramyan A.M., Fant A.D., Hong W.C., Newman A.H., Shi L. Pharmacological profiling of sigma 1 receptor ligands by novel receptor homomer assays. Neuropharmacology. 2018;133:264–275. doi: 10.1016/j.neuropharm.2018.01.042. [DOI] [PMC free article] [PubMed] [Google Scholar]
Associated Data
This section collects any data citations, data availability statements, or supplementary materials included in this article.