Abstract
Objectives:
To compare the accuracy of linear and volumetric measurements of artificial external root resorption (ERR) cavities by cone beam CT (CBCT) images obtained at four voxel sizes and by using four different software ex vivo.
Methods:
ERR cavities were created on 40 extracted single rooted anterior teeth. Images were obtained by using Planmeca CBCT unit at endo mode (0.075 mm); high-resolution mode (0.1 mm); high-definition mode (0.15 mm) and normal resolution mode (0.2 mm) voxel sizes. Images were analyzed by two observers using four different software (Romexis, 3D Doctor, ITK-SNAP, and OsiriX). (1) Diameter; (2) height; (3) depth; and (4) volume of the ERR were measured. CBCT measurements were then compared with direct physical measurements. ANOVA was used with general linear model analysis. The significance level was set at p < 0.05.
Results:
One-way ANOVA general linear model analysis showed no significant difference between or within observers for diameter, height, depth and volume measurements (p > 0.05). We found significant differences for diameter and volume measurements among softwares in terms of mean differences as compared to mean standard direct measurements (p < 0.05). We found statistically significant differences among voxel sizes and software for height measurements (p < 0.05). In addition, we found significant differences for diameter and volume measurements (p < 0.05) suggesting more accurate measurements for the cervical region when compared to apical region.
Conclusions:
Observers using CBCT images obtained at four voxel sizes performed similarly in the quantification of artificial ERR with clinically insignificant distinction between CBCT softwares used.
Introduction
Root resorption 1 can be categorized as internal and external according to location of the resorptive cavity.1 External root resorption (ERR) is defined as the loss of dental hard tissues such as; dentin, cementum and alveolar bone because of clastic activity outside the root surface.2, 3 ERR in the permanent dentition is a pathological situation and if untreated, this might result in loss of the affected teeth. Aetiologic factors are known to be impacted teeth, orthodontic movement, tumours, and cysts, poor regeneration of peridontium of luxated or reimplanted teeth, periradicular inflammatory lesions, periodontal disease, and tooth bleaching by hydrogen peroxide.4–11 Cervical area is one of the most common region for ERR and the highest incidence has been reported for anterior teeth.12 Generally, if ERR can be detected at the early stages of formation, it may be possible to prevent ERR by eliminating the aetiologic factor.10 However, as ERR presents no clinical symptoms, it is usually detected at the advanced level during radiological dental examinations conducted by using periapical radiography.13–15 Digital intraoral periapical radiography is the most frequently used technique in the diagnosis of root resorption during routine dental practice. Unfortunately, intraoral periapical radiography is only able to provide limited information regarding accurate location, size and extend of the ERR lesion.13–15 Periapical radiographic images have also other limiting factors including distortion, superimpositions, and beam angulation problems which may all effect diagnostic ability.16, 17 Cone beam CT (CBCT) dedicated to dentomaxillofacial imaging has the ability to obtain three-dimensional (3D) images with lower radiation doses, shorter acquisition scan times, easier imaging and lower costs when compared to medical CT.18–20 Owing to flat panel technology and isotropic voxels offered by CBCT systems, it is possible to obtain highly accurate quantitative information regarding ERR.21 Also, effectiveness of CBCT in the clinical diagnosis and treatment of ERR was proven to be acceptable.22–25
CBCT units specifically which offer limited field of view (FOV) are preferred in the assessment of ERR due to lower radiation doses and higher definition images. Voxel size is the smallest cubed shaped part of a 3D image and it is short for a volumetric pixel. Various CBCT units offer voxel sizes ranging between 0.075 and 0.4 mm. Selection of voxel size may affect diagnostic ability, patient radiation dose, scanning, and reconstruction times.26, 27 Previous studies also assessed CBCT-aided linear and volumetric measurement accuracy of ERR which is crucial in terms of diagnosis, treatment plan, and prognosis of lesions. Software capability is another important factor in terms of diagnostic and quantitative measurement accuracy. However, most CBCT units and their softwares do offer linear measurement option but they are unable to provide volumetric measurements of ERR.28, 29 Nowadays, companies introduce various third-party softwares which have the strong potential to be utilized for different tasks and can be incorporated into CBCT imaging.
In view of the importance of voxel size selection and software capability on quantitative measurement accuracy of ERR with CBCT, the purpose of the present study was to compare the accuracy and reproducibility of linear (diameter, height, and depth) and volumetric measurements of chemomechanically created artificial ERR cavities by CBCT images obtained at four different voxel sizes and by using four different software to actual physical measurements ex vivo.
Methods and materials
A total of 40 extracted single rooted anterior teeth (10 maxillary central incisors, 10 maxillary lateral incisors, 10 mandibular central incisors and 10 mandibular lateral incisors) with radiographically visible pulpal canals and without restorations, root canal fillings, pathologies or anomalies were numbered and on each tooth 80% trichloroacetic acid was applied with cotton bud until the resorption area appeared. Thereafter, this area was enlarged by using round burrs at the cervical or apical thirds of lingual/palatal root surface ensuring an equal number of artificial ERR lesions on each location (20 apical and 20 cervical). Dimensional measurements of the maximum diameter, height and depth of the resorption cavities were performed twice by an independent researcher by using an electronic digital caliper (Allendale Electronics Ltd., Hertfordshire, UK) with fine-pointed jaws and measuring range of 0–200 mm (0–8.0 inch) and a resolution of 0.01 mm (0.0005 inch). The average of both measurements was considered as the reference standard. In addition, a non-deformable light flow silicon impression material (Variotime®; Heraeus-Kulzer, Hanau, Germany) was injected into 40 cavities and volumes of the impression models were measured by a “water displacement technique”. Defect volume was calculated by subtracting last volume of the water in the cylinder from initial volume of the water in the cylinder. Volumetric measurements of the impression models were made by using an SCALTEC SBC 21 balance (Denver Instrument, Bohemia, NY) by an external independent researcher twice. The average volume was considered the reference standard. All physical measurements were then compared with the average CBCT image measurements conducted by two calibrated observers (one dentomaxillofacial radiologist and one endodontist) twice. Another 40 extracted single rooted anterior teeth (10 maxillary central incisors, 10 maxillary lateral incisors, 10 mandibular central incisors and 10 mandibular lateral incisors) with radiographically visible pulpal canals and without ERR, restorations, root canal fillings, pathologies or anomalies served as control group.
Image acquisition
Prior to each imaging procedure, four teeth were randomly positioned in the appropriate alveolar sockets of a dry human skull in contact (four maxillary or four mandibular incisors) making a total of 80 teeth. Dry human skull was covered with 1.5 cm thick wax as a soft tissue equivalent. Images of each group were taken by ProMax® 3D Max CBCT (Planmeca, Helsinki, Finland) with a flat panel sensor, using low artefact reduction mode operating at 96 kVp, 7mA, 15 s and 55 × 50 mm FOV at four different voxel sizes (nominal cubic mm resolution) as follows: (1) CBCTendo mode (0.075 mm); (2) high-resolution mode (0.1 mm); (3) high-definition mode (0.15 mm); and (4) normal resolution mode (0.2 mm) voxel size. The exposure time anddose–area product, mGy *cm2 values showed variations among different voxel sizes. The exposure time was ~15 s for 0.075 mm and 0.15 mm voxel sizes and ~12 s for 0.1 mm and 0.2 mm voxel sizes. The dose–area product values were 6.6 , 5.3,6.6, and 4.2 mGy*cm2 for 0.075, 0.1, 0.15, and 0.2 mm voxel sizes, respectively.
Image interpretation
Images were analyzed by using four different software and four different measurements were performed as follows: (1) diameter; (2) height; (3) depth; and (4) volume of the ERR cavity. Softwares chosen for analyzing the images were (1) Dedicated Planmeca Romexis Viewer (Planmeca Oy, Helsinki, Finland); (2) 3D-DOCTOR (Able SoftwareCorp., Lexington, MA); (3) Open source application: ITK-SNAP v. 3.4.0 (http://itksnap.org); and (4) OsiriX (Pixmeo SARL, Bernex, Switzerland). Prior to image interpretation, a calibration session was performed by using all softwares on one ERR cavity which was not included in the study. Sagittal CBCT sections were used for conducting height, depth and volume measurements whereas axial CBCT sections were used for diameter measurements of artificial resorption cavities. Prior to conducting depth measurements, tooth contour was established manually and the depth of the ERR cavities were measured from the deepest point of the cavity to the contour in perpendicular direction.
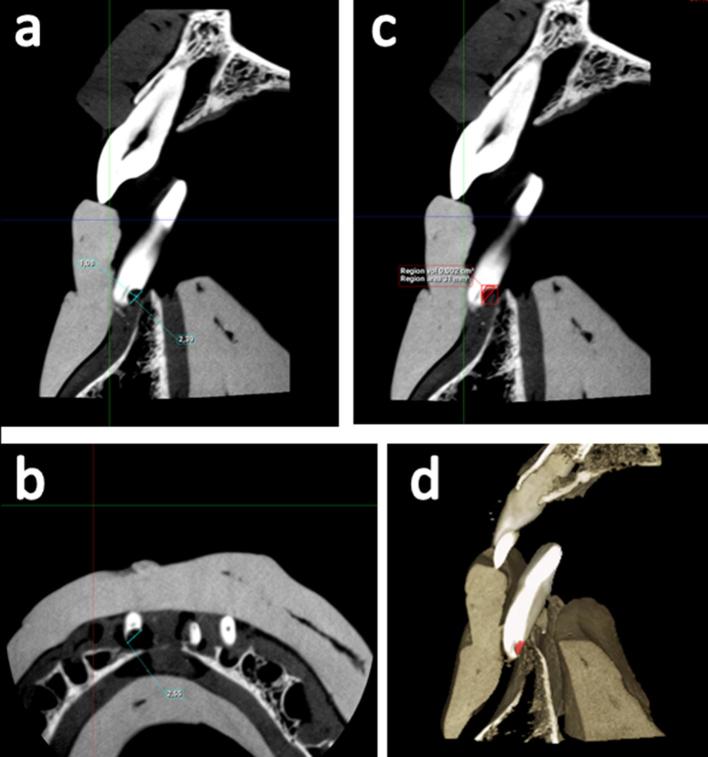
By using Planmeca’s dedicated Romexis software images were analyzed on 21.3-inch medical diagnostic monitor at 2048 × 1536 resolution (NEC, Tokyo, Japan) and 32-bit colour depth in a dimly lit room, and volumetric measurement of resorption cavities were conducted by using annotation tool and free region grow icon. After creating a red coloured area which included resorption cavity on each consecutive sagittal slice, 3D reconstruction and volume of the resorption cavity were calculated by using create region option. Figure 1 shows representative Planmeca Romexis images from a scan obtained at 0.075 mm voxel size of a mandibular anterior tooth with artificial apical ERR cavity.
Figure 1.
Representative Romexis analysis software images from a scan obtained at 0.075 mm voxel size of a mandibular anterior tooth with artificial apical ERR cavity (a) Shows a sagittal section providing the height and depth of the cavity, (b) shows an axial section providing the diameter of the cavity, and (c, d) show sagittal sections providing borders, reconstruction and volume of the resorption cavity. ERR, external root resorption.
For the other three softwares, 3D-DOCTOR (Able SoftwareCorp., Lexington, MA), ITK-SNAP v. 3.4.0 (http://itksnap.org), and OsiriX (Pixmeo SARL, Bernex, Switzerland), CBCT scans taken at each acquisition parameter of 40 artificial resorption cavities were exported as digital imaging and communications in medicine files and then imported into three different softwares.
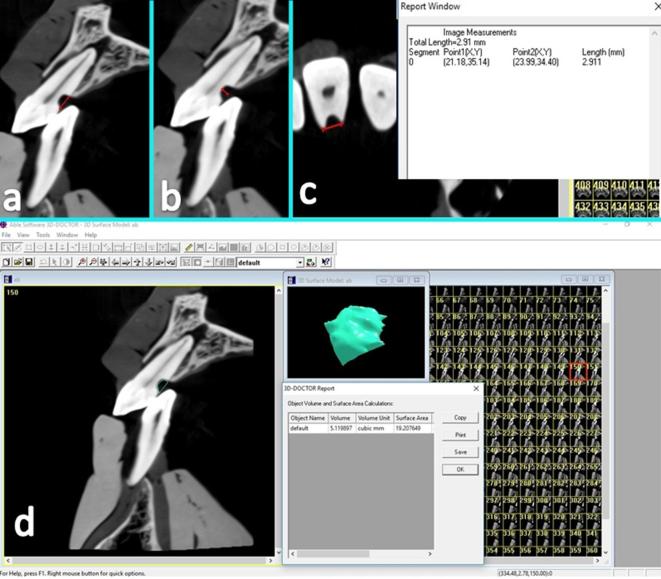
3D-DOCTOR (Able SoftwareCorp., Lexington, MA), is a volumetric rendering software capable of vector-based segmentation technology. This software allowed resorption cavity segmentation on consecutive sagittal slices enabling visualization at each level mesiodistally. This ensured detailed slice-by-slice manual segmentation of the resorption cavity borders using a mouse with turquoise coloured delineation via trace boundary tool. This software also enabled creating autoshaped rectangular and circular boundaries that users could adjust boundaries with merge tool to fit the resorption cavity boundary on each slice. Automated calculation of the total volume from the areas outlined on each slice of known thickness was performed by the software. Images were viewed on a 21.3-inch medical diagnostic monitor at 2048 × 1536 resolution (NEC, Tokyo, Japan) and 32-bit colour depth in a dimly lit room. Figure 2 shows representative 3D Doctor analysis software images from a scan obtained at 0.15 mm voxel size of a maxillary anterior tooth with artificial cervical ERR cavity.
Figure 2.
Representative 3D Doctor analysis software images from a scan obtained at 0.15 mm voxel size of a maxillary anterior tooth with artificial cervical ERR cavity. (a) Shows a sagittal section providing the height of the cavity, (b) shows a sagittal section providing the depth of the cavity, (c) shows an axial section providing the diameter of the cavity and (d) shows sagittal sections illustrating the segmentation process for volume quantification. Each sagittal slice of the region containing the cavity was delineated by a turquoise green coloured border using the mouse cursor. ERR, external root resorption.
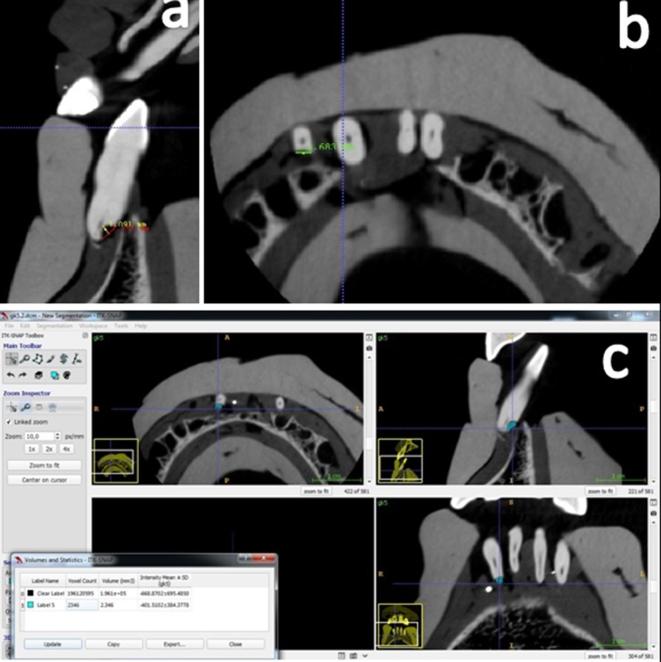
ITK-SNAP (http://itksnap.org) is an open source application, which provides image visualization, along with manual and semi-automatic segmentation. CBCT images of the resorption cavities were also manually segmented by using brush mode of the ITK-SNAP v.3.4 (http://itksnap.org) software. According to organization information, creating quick and reliably constructed 3D models is one of the most important property that ITK-SNAP supplies for users. This software offers two different manual segmentation for creating boundaries; polygon mode and brush mode. Brush mode enables defining boundaries by using isotropic, 3D and adjustable size brush which is quicker than polygon mode. Brush mode also allows creating and calculating volumes of multiple resorption cavities by using different coloured brushes. First, observers determined the cavity boundaries on each sagittal slice and then, they created 3D models of ERR by using segmentation option. Thereafter, they calculated volumes by using volume and statistic tool. Images were viewed on a 21.3-inch medical diagnostic monitor at 2048 × 1536 resolution and 32-bit colour depth (NEC, Tokyo, Japan) in a dimly lit room. Figure 3 shows representative ITK-SNAP analysis software images from a scan obtained at 0.1 mm voxel size of a mandibular anterior tooth with artificial apical ERR cavity.
Figure 3.
Representative ITK-SNAP analysis software images from a scan obtained at 0.1 mm voxel size of a mandibular anterior tooth with artificial apical ERR cavity. (a) Shows a sagittal section providing the height and depth of the cavity, (b) shows an axial section providing the diameter of the cavity and (c) shows sagittal sections illustrating the segmentation process for volume quantification. Brush mode allows creating and calculating volumes of multiple resorption cavities by using different coloured brushes. Observers determined the cavity boundaries on each sagittal slice and then they created 3D models of ERR by using segmentation option. 3D, three-dimensional; ERR, external root resorption.
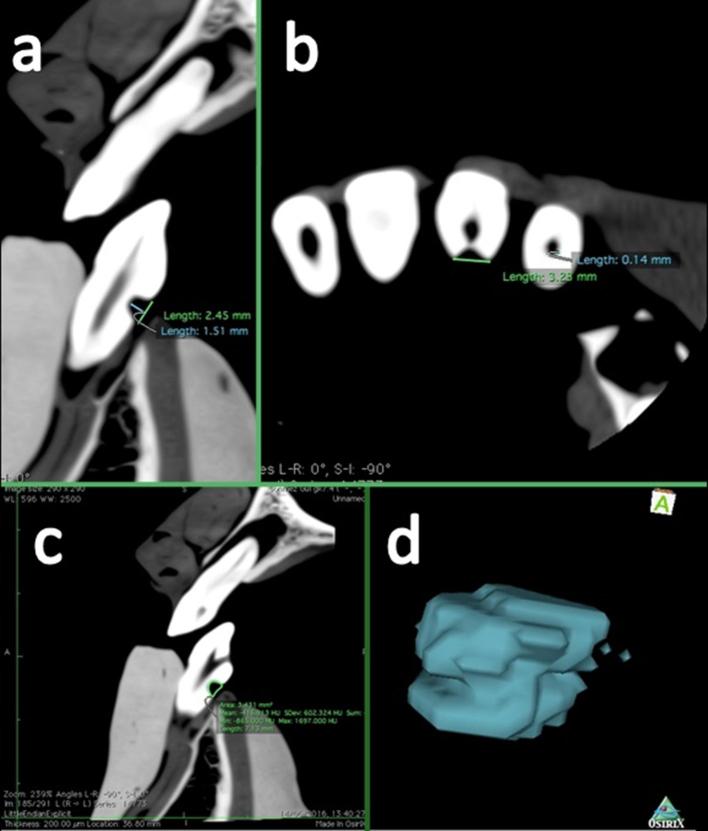
OsiriX (Pixmeo SARL, Bernex, Switzerland) is a free and open-source software program developed as a standalone application for the MacOS X platform which allows users to analyze, reconstruct and manipulate 3D images. Observers generated volume renderings by creating the region of interest with a pencil tool. Images were viewed and assessed on a 12-inch monitor MacBook (Apple Inc., Cupertino, CA) at 2304 × 1440 resolution and 32-bit colour depth. Figure 4 shows representative OsiriX analysis software images from a scan obtained at 0.2 mm voxel size of a mandibular anterior tooth with artificial cervical ERR cavity.
Figure 4.
Representative OsiriX analysis software images from a scan obtained at 0.2 mm voxel size of a mandibular anterior tooth with artificial cervical ERR cavity. (a) Shows a sagittal section providing the height and depth of the cavity, (b) shows an axial section providing the diameter of the cavity and (c) shows sagittal sections illustrating the segmentation process for volume quantification. Observers generated volume renderings by creating the region of interest with a pencil tool. ERR, external root resorption.
Statistical analysis
ANOVA was used with general linear model analysis. Minitab statistical software (Inova, Teknokent, Ankara, Turkey) was used. Significant level was set at p < 0.05.
Results
In consideration to mean percentage of true and false responses for all observers and all softwares, we found a mean 100% true-positive, 0% false-negative, 100% true-negative and 0% false-positive results. Table 1 shows the mean, minimum and maximum diameters, heights, depths and volumes of the chemomechanically created ERR cavities obtained with CBCT at four different voxel sizes and measured using four different softwares. Table 2 shows variation from the standard direct measurement of mean, minimum and maximum diameters, heights, depths and volumes of the chemomechanically created ERR cavities obtained with CBCT and measured using four different softwares. Table 3 shows the average of diameter, height, depth and volume differences from the gold-standard according to location, software and voxel size.
Table 1.
Mean and SD, minimum and maximum measurements of diameters, heights, depths and volumes of the chemomechanically simulated ERR cavities obtained at four different voxel sizes and measured using four different software in mm
| Software | Voxel size (mm) | Diameter | Height | Depth | Volume |
| 0.075 | 2.30 (±0.45) 1.15–3.05 | 2.52 (±0.50) 1.48–3.84 | 1.01 (±0.38) 0.22–1.73 | 4.42 (±1.66) 0.47–8.56 | |
| 3D-Doctor | 0.1 | 2.33 (±0.45) 1.16–3.05 | 2.54 (±0.50) 1.48–3.84 | 0.99 (±0.38) 0.22–1.79 | 4.44 (±1.65) 0.56–8.67 |
| 0.15 | 2.33 (±0.44) 1.21–3.09 | 2.54 (±0.51) 1.49–3.88 | 1.00 (±0.37) 0.27–1.68 | 4.45 (±1.65) 0.59–8.68 | |
| 0.2 | 2.33 (±0.45) 1.19–3.03 | 2.53 (±0.50) 1.58–3.79 | 1.00 (±0.37) 0.24–1.72 | 4.45 (±1.65) 0.57–8.69 | |
| 0.075 | 2.33 (±0.46) 1.13–3.01 | 2.53 (±0.51) 1.48–3.88 | 0.99 (±0.38) 0.24–1.75 | 4.47 (±1.66) 0.55–8.76 | |
| ITK-SNAP | 0.1 | 2.34 (±0.46) 1.13–3.08 | 2.55 (±0.51) 1.53–3.89 | 0.98 (±0.38) 0.21–1.78 | 4.46 (±1.67) 0.59–8.79 |
| 0.15 | 2.34 (±0.46) 1.16–3.07 | 2.55 (±0.50) 1.53–3.89 | 0.99 (±0.38) 0.21–1.75 | 4.47 (±1.66) 0.59–8.69 | |
| 0.2 | 2.33 (±0.45) 1.18–3.08 | 2.54 (±0.51) 1.51–3.84 | 0.99 (±0.38) 0.21–1.76 | 4.46 (±1.67) 0.57–8.73 | |
| 0.075 | 2.33 (±0.46) 1.11–3.09 | 2.53 (±0.50) 1.54–3.88 | 0.98 (±0.37) 0.22–1.68 | 4.47 (±1.66) 0.55–8.64 | |
| OsiriX | 0.1 | 2.33 (±0.45) 1.11–3.11 | 2.53 (±0.49) 1.55–3.88 | 0.99 (±0.37) 0.22–1.64 | 4.47 (±1.66) 0.57–8.71 |
| 0.15 | 2.33 (±0.43) 1.15–3.11 | 2.54 (±0.50) 1.52–3.83 | 1.01 (±0.38) 0.25–1.73 | 4.46 (±1.67) 0.56–8.68 | |
| 0.2 | 2.32 (±0.44) 1.17–3.09 | 2.53 (±0.51) 1.51–3.89 | 0.99 (±0.37) 0.22–1.67 | 4.46 (±1.65) 0.55–8.61 | |
| 0.075 | 2.34 (±0.45) 1.15–3.09 | 2.55 (±0.52) 1.51–3.91 | 1.00 (±0.38) 0.24–1.69 | 4.41 (±1.67) 1–9 | |
| Planmeca | 0.1 | 2.34 (±0.44) 1.15–3.08 | 2.55 (±0.52) 1.51–3.98 | 1.00 (±0.37) 0.25–1.68 | 4.36 (±1.65) 1–9 |
| 0.15 | 2.34 (±0.45) 1.11–3.08 | 2.55 (±0.51) 1.56–3.91 | 1.00 (±0.37) 0.21–1.63 | 4.39 (±1.64) 1–9 | |
| 0.2 | 2.33 (±0.45) 1.11–3.08 | 2.54 (±0.52) 1.48–3.91 | 1.00 (±0.37) 0.21–1.68 | 4.36 (±1.65) 1–9 |
ERR,external root resorption; SD, standard deviation.
Mean (SD) minimum–maximum.
Mean of measurements in mm.
Mean of measurements in mm³.
Table 2.
Variation from the standard direct measurement of mean, minimum, and maximum diameters, heights, depths and volumes of the chemomechanically simulated ERR cavities obtained at four voxel sizes and measured using four different software in mm Mean Difference from gold standard(StDev) Minimum-Maximum
| Software | Voxel size (mm) | Diameter | Height | Depth | Volume |
| 0.075 | 0.025 (±0.060) 0.12–0.24 | 0.021 (±0.057) 0.14–0.1 | 0.041 (±0.050) −0.11–0.16 | 0.024 (±0.060) 0.12–0.10 | |
| 3D-Doctor | 0.1 | 0.029 (±0.050) 0.11–0.1 | 0.003 (±0.053) 0.11–0.1 | 0.028 (±0.052) −0.11–0.13 | 0.007 (±0.067) 0.13–0.1 |
| 0.15 | 0.005 (±0.052) −0.09–0.1 | 0.001 (±0.053) −0.09–0.1 | 0.034 (±0.044) −0.1–0.11 | 0.001 (±0.054) −0.11–0.1 | |
| 0.2 | 0.005 (±0.053) −0.11–0.18 | 0.007 (±0.048) 0.1–0.09 | 0.035 (±0.044) −0.09–0.21 | 0.002 (±0.053) −0.1–0.1 | |
| 0.075 | 0.007 (±0.044) −0.08–0.09 | 0.009 (±0.044) 0.11–0.09 | 0.026 (±0.054) −0.11–0.14 | 0.029 (±0.056) −0.09–0.13 | |
| ITK-SNAP | 0.1 | 0.008 (±0.052) −0.1–0.09 | 0.012 (±0.048) −0.08–0.22 | 0.017 (±0.050) −0.1–0.12 | 0.019 (±0.052) −0.1–0.14 |
| 0.15 | 0.017 (±0.049) −0.1–0.12 | 0.007 (±0.057) −0.24–0.09 | 0.024 (±0.047) −0.1–0.11 | 0.025 (±0.047) −0.08–0.1 | |
| 0.2 | 0.005 (±0.051) −0.1–0.09 | 0.002 (±0.051) 0.09–0.1 | 0.019 (±0.042) −0.1–0.11 | 0.018 (±0.053) −0.1–0.11 | |
| 0.075 | 0.004 (±0.052) −0.1–0.1 | 0.005 (±0.051) 0.11–0.1 | 0.028 (±0.049) −0.1–0.1 | 0.027 (±0.049) −0.09–0.1 | |
| OsiriX | 0.1 | 0.006 (±0.054) −0.1–0.1 | 0.008 (±0.053) 0.1–0.1 | 0.017 (±0.050) −0.1–0.1 | 0.026 (±0.051) −0.1–0.1 |
| 0.15 | 0.005 (±0.053) −0.1–0.1 | 0.002 (±0.047) −0.1–0.09 | 0.039 (±0.038) −0.08–0.1 | 0.020 (±0.055) −0.1–0.1 | |
| 0.2 | 0.009 (±0.056) 0.1–0.1 | 0.009 (±0.058) 0.1–0.1 | 0.027 (±0.054) −0.1–0.1 | 0.015 (±0.054) −0.1–0.1 | |
| 0.075 | 0.011 (±0.041) −0.07–0.13 | 0.008 (±0.041) −0.08–0.1 | 0.035 (±0.049) −0.1–0.34 | 0.036 (±0.030) 0.46–0.57 | |
| Planmeca | 0.1 | 0.007 (±0.076) −0.07–0.13 | 0.016 (±0.047) −0.08–0.1 | 0.035 (±0.040) −0.08–0.1 | 0.080 (±0.085) 0.08–0.1 |
| 0.15 | 0.008 (±0.043) −0.1–0.1 | 0.007 (±0.051) −0.24–0.1 | 0.031 (±0.052) −0.1–0.27 | 0.053 (±0.030) 0.46–0.66 | |
| 0.2 | 0.004 (±0.041) −0.1–0.1 | 0.047 (±0.051) −0.08–0.1 | 0.047 (±0.052) −0.09–0.1 | 0.080 (±0.085) 0.46–0.47 |
ERR,external root resorptions; SD, standard deviation.
Meandifference from gold-standard (SD) minimum–maximum.
Mean difference from the gold standard in mm.
Mean difference from the gold standard in mm³.
Table 3.
Average of diameter, height, depth and volume differences from the gold-standard according to location, software and voxel size in mm
| Location | Diameter (p < 0.05) |
Height (p > 0.05) |
Depth (p > 0.05) |
Volume (p < 0.05) |
| Cervical | 0.0004 | −0.0006 | 0.0293 | −0.0005 |
| Apical | 0.0079 | −0.0004 | 0.0304 | −0.0120 |
| Software | Diameter (p = 0.003) |
Height (p = 0.00) |
Depth (p = 0.08) |
Volume (p = 0.01) |
| 3D-Doctor | −0.0035 | −0.0078 | 0.0348 | −0.0068 |
| ITK-SNAP | 0.0096 | 0.0020 | 0.0222 | 0.0232 |
| OsiriX | 0.0017 | −0.0052 | 0.0282 | 0.0223 |
| Planmeca | 0.0081 | 0.0090 | 0.0341 | −0.0625 |
| Voxel size | Diameter (p = 0.084) |
Height (p = 0.003) |
Depth (p = 0.09) |
Volume (p = 0.720) |
| 0.075 mm | −0.0003 | −0.0069 | 0.0328 | −0.0009 |
| 0.1 mm | 0.0056 | 0.0042 | 0.0248 | −0.0101 |
| 0.15 mm | 0.0091 | 0.0045 | 0.0325 | −0.0015 |
| 0.2 mm | 0.0015 | −0.0039 | 0.0291 | −0.0111 |
Average of difference from the gold standard in mm.
Average of difference from the gold standard in mm³.
One-way ANOVA general linear model analysis showed no significant difference between or within observers (p > 0.05) for diameter (p = 0.117), height (p = 0.584), depth (p = 0.136) and volume (p = 0.855) measurements. Considering diameter measurements, we found no significant difference among voxel sizes (p = 0.084) in terms of mean differences as compared to mean standard direct measurements. However, we found significant differences for diameter measurements among softwares (p = 0.003) in terms of mean differences as compared to mean standard direct measurements. Mean radiological diameter measurements showed an average variation of −0.0035 mm for 3D-Doctor, 0.0017 mm for OsiriX, 0.0081 mm for Planmeca and 0.0096 mm for ITK-SNAP from the mean standard direct measurements (Table 3). Figure 5 shows interval plot of diameter difference from the gold-standard 95% confidence interval for the mean measurements.
Figure 5.
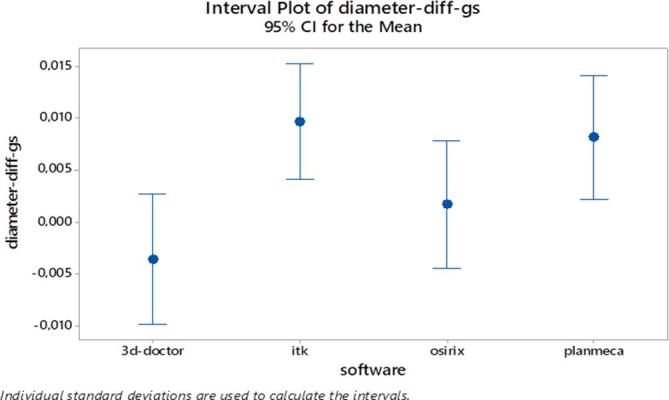
Interval plot of diameter difference from the gold-standard 95% CI for the mean measurements. CI, confidence interval.
General linear model analysis showed significant differences for height measurements among voxel sizes (p = 0.003) and softwares (p = 0.000) in terms of mean differences as compared to mean standard direct measurements. Mean radiological height measurements showed an average variation of −0.0069 mm for 0.075 mm voxel size, −0.0039 mm for 0.2 mm voxel size, 0.0042 mm for 0.1 mm voxel size and 0.0045 mm for 0.15 mm voxel size from the mean standard direct measurements (Table 3). Mean radiological height measurements showed an average variation of −0.0078 mm for 3D-Doctor, −0.0052 mm for OsiriX, 0.0020 mm for ITK-SNAP and 0.0090 mm for Planmeca from the mean standard direct measurements (Table 3). Figure 6 shows interaction plot for height difference from the gold standard.
Figure 6.
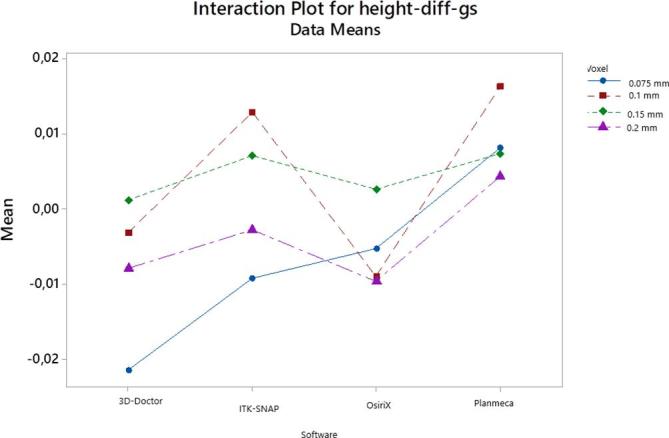
Interaction plot for height difference from the gold standard.
Considering depth measurements, we found no significant difference among voxel sizes (p = 0.090) and softwares (p = 0.080) in terms of mean differences as compared to mean standard direct measurements (Table 3). Figure 7 shows interaction plot for depth difference from the gold standard.
Figure 7.
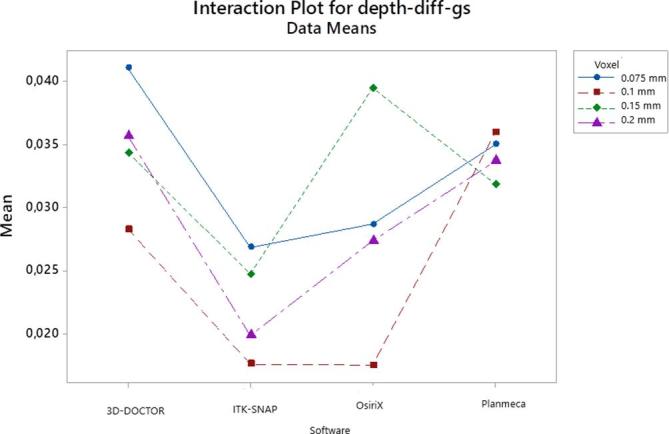
Interaction plot for depth difference from the gold standard.
Considering volume measurements, we found no significant difference among voxel sizes (p = 0.720) in terms of mean differences as compared to mean standard direct measurements. However, we found significant differences for volume measurements among softwares (p = 0.001) in terms of mean differences as compared to mean standard direct measurements. Mean radiological volume measurements showed an average variation of −0.0625 mm3 for Planmeca, −0.0068 mm3 for 3D-Doctor, 0.0223 mm3 for OsiriX, and 0.0232 mm3 for ITK-SNAP from the mean standard direct measurements (Table 3). Figure 8 shows main effects plot for volume difference from the gold standard.
Figure 8.
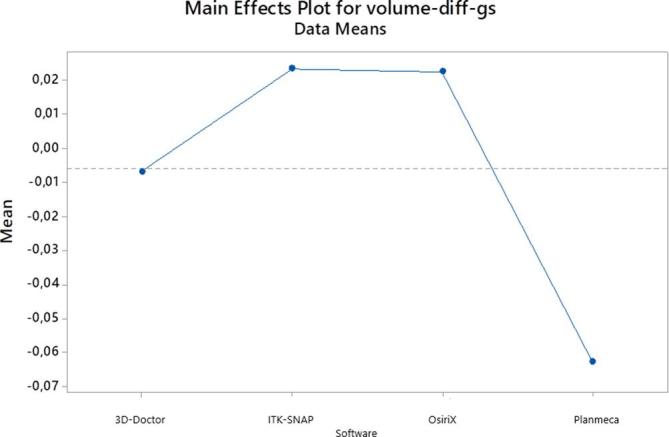
Main effects plot for volume difference from the gold standard.
When the location was taken into account, no statistically significant difference was found between two different locations for height and depth measurements (p > 0.05) whereas, statistically significant differences were found for diameter and volume measurements (p < 0.05) suggesting more accurate measurements for the cervical region when compared to the apical region. Mean radiological diameter measurements showed an average variation of 0.0004 mm for the cervical region and 0.0079 mm for the apical region, whereas mean volume measurements showed an average variation of −0.0005 mm3 for the cervical region and −0.0120 mm3 for the apical region.
Discussion
Generally, ERR occurs without any symptoms and when it is detected a significant loss of dental hard tissue may conclude with tooth loss. Therefore, early and accurate diagnosis of ERR is of paramount importance in order to achieve successful treatment outcome. The choice of an accurate and reliable imaging modality in the quantitative assessment of ERR is clinically important in terms of diagnosis, planning, selection of treatment and prognosis. Main treatment objectives in ERR are to excavate and stop the resorptive process. Accurate determination of ERR cavity size and volume may also assist in the selection of appropriate correction procedures including curettage and trichloroacetic acid application. Besides, another common treatment for ERR is the use of sealing techniques by biocompatible and aesthetic filling materials. Previous studies showed that 3D imaging was superior to two-dimensional radiographic techniques in the detection of ERR.13, 23 To our knowledge, up until now, no previous study compared the accuracy of linear and volumetric measurements of chemomechanically created ERR cavities by CBCT images obtained at various voxel sizes and different softwares to actual physical measurements.
In the present study, linear and volumetric measurements obtained by different voxels and softwares were clinically acceptable. The two observers using CBCT images obtained at four voxel sizes combining decreasing resolutions performed similarly in the quantification of artificial ERR with some distinction between types of CBCT software for diameter, height and volume measurements. In addition, we found statistically significant differences among voxel sizes for only height measurements. We obtained higher mean variation for the depth measurements when compared to other measurements. This result might be due to inherent difficulties in reformatting, delineating, and measuring the depth of the cavities. In addition, observers performed better with 3D-Doctor and OsiriX for diameter measurements and with ITK-SNAP software for height measurements and 3D-Doctor for volume measurements. Planmeca Romexis software revealed the highest mean variation values for volumetric measurements as it was only able to offer integer numbers for volume calculation. These findings could be attributable to software capability of the CBCT system used for linear and volumetric measurements; vector-based segmentation technology offered by 3D-Doctor software and/or the use of experienced clinicians in making measurements by CBCT as observers. However, it should be noted that mean variation values were found to be in the range −0.0078 to 0.0348 mm and −0.0625 to 0.0232 mm3 for all linear measurements and for volume measurements, respectively. Therefore, we considered all mean variations from the gold standard either statistically significant or insignificant as clinically insignificant. In our notion, all softwares chosen for the present study can reliably be used for the quantification of ERR when necessary.
Numerous softwares provide various linear and volumetric measurement techniques along with different segmentation technologies. Further studies should be conducted in order to compare different softwares and quantification techniques in assessing ERR. In addition, unlike the other three softwares used which were viewed on a medical grade diagnostic monitor, OsiriX images were viewed on a MacBook which offered a high-resolution “retina display” with higher pixel density than previous MacBook models. In our notion, this was not an issue for the present study as both monitor types provided highly acceptable viewing conditions under dimmed lighting with high-end technology.
Similar to previous studies,13, 16,21 we mainly focused on artificially created resorptive defects which were seen as radiolucent well-defined cavities. Replacement resorption in which resorptive area is filled with bone tissue was out of our scope. In the present study, chemically created cavities were shaped mechanically in order to obtain clear borders which facilitated easier physical and radiological measurements and they resembled real radiolucent ERR cavities. Observer performance and experience, software capability, mouse sensitivity, CBCT unit and settings used are all important factors in the radiological measurement of ERR. We used maxillary and mandibular incisor teeth, since they are prone to ERR. In order to simulate real clinical conditions, a dry skull was covered with soft tissue material. Although CBCT imaging provides 3D visualization of the ERR, the presence of metallic artefacts from restorations and root-canal filling material, along with patient motion represents a limitation to large- and limited-volume CBCT imaging. In the present study, there were no metallic restorations in the imaged area and therefore, observer performance was not affected by beam hardening and cupping artefacts. The visibility of ERR in the vicinity of restorative and endodontic materials can be the subject of further research. It should also be noted that, in contrast to actual clinical conditions, patient motion was not a factor in this ex vivo study.
Effectiveness of CBCT in the clinical diagnosis and treatment of ERR was proven.22–25 However, there are few investigations assessing the quantitative ability of CBCT images in ERR. Although Liedke et al26 demonstrated that higher resolution (0.2 mm and 0.3 mm voxel size) CBCT images were superior to low resolution (0.4 mm voxel) images for detecting ERR without statistically significant differences (p > 0.05), their study design did not aim to conduct linear and volumetric measurements. Another study27 evaluated the accuracy of three different image acquisition protocols as follows; half scan, 0.40 mm voxel size; full scan, 0.40 mm voxel size; and full scan, 0.125 mm voxel size. Although they found no difference between the degrees of rotation (half and full scan) in the same voxel size (0.4 mm), they found statistically significant difference between 0.4 mm voxel size and 0.125 mm voxel size.27 Therefore, we preferred utilizing only CBCT images less than 0.3 mm voxel sizes, due to the fact that they facilitate better visibility of subtle hard tissue changes. Our observers performed similarly for the quantification of ERR at all voxel sizes except for height measurements. We investigated the influence of different voxel sizes on observer ability to quantify ERR by using the smallest FOV available. We used the smallest FOV (55 × 50 mm) offered by the unit which is suggested for endodontic use with the advantages of lower patient exposure, shorter scan times and smaller voxel sizes available in comparison to larger FOVs. Small FOV (55 × 50 mm), CBCT and images obtained at small voxel sizes improved the ability of observers to discriminate objects of different attenuation separated by very small distances in any chosen viewing plan. It is possible that the use of CBCT units with different FOV and larger voxel size would reveal different observer performance and different results. Currently, no general protocol could be yet defined for CBCT examination of specific diagnostic tasks in dentistry considering voxel size. In addition, voxel size is one of the most important CBCT parameters that affect image quality, and it is related to scanning and reconstruction times of CBCT images. Thus, determination of optimal CBCT parameters is crucial in terms of radiation exposure and safety. Although, in general, we found no statistically significant difference among CBCT images taken with the four different voxel sizes, considering the increase in radiation dose and noise when using smaller voxel sizes with small FOV, CBCT images taken between 0.1 and 0.2 mm voxel sizes would be convenient for the measurement of ERR when necessary.
Ponder et al28 compared the accuracy of linear and volumetric measurements of simulated ERR defects obtained at high- and low-resolution CBCT images. They found that high-resolution (0.2 mm voxel size) CBCT images were more accurate than low-resolution CBCT images (0.4 mm voxel size). Moreover, they found that apical location of ERR defects had a significant effect on volumetric measurement conducted from low-resolution CBCT images. We found statistically significant differences between two different locations for diameter and volume measurements, and we calculated higher mean variation values for the apical region when compared to the cervical region. Quantitative measurement of apically located ERR cavities is more difficult than those of cervical ERR cavities due to their location which makes the segmentation process more troublesome.
A previous study29 evaluated the influence of FOV and voxel size on volumetric measurements of internal root resorption cavities by using CBCT images obtained with two different CBCT systems; i-Cat Next Generation (Imaging Sciences International, Inc., Hatfield, PA) and Kodak 9000 3D (KODAK Dental Systems, Carestream Health, Rochester, NY).29 Volumetric measurements of all resorption cavities were calculated by using the Dolphin 3D software and no statistically differences were found between CBCT images obtained at 0.2 mm voxel size with two different CBCT units. In our notion, delineation and segmentation of internal root resorption cavities are easier when compared to ERR due to their clear and well-defined borders.
Lermen et al30 evaluated the accuracy of coronal and sagittal CT sections in the detection of simulated root resorption cavities. They found no statistically significant difference (p > 0.05) among coronal and sagittal planes for detecting simulated resorption cavities at the apical, middle, and coronal thirds. Nevertheless, their results showed that there were statistically significant differences among coronal and sagittal planes for detecting small resorption cavities on the apical third of root surface (p < 0.05). In line with findings of the mentioned study, we utilized sagittal CBCT sections for conducting most of the linear measurements (axial sections were used for diameter measurements only) and volumetric measurements of artificial resorption cavities. Our observers found sagittal sections to be user-friendly and versatile for the linear and volumetric measurement of ERR.
Chosen CBCT units and imaging settings used also may play an important role in ERR. Therefore, a recent study31 evaluated the subjective image quality and radiographic diagnostic accuracy for the detection of simulated ERR lesions caused by an impacted canine by using six different CBCT units and authors demonstrated no statistically significant differences among six different CBCT units [3D Accuitomo-XYZ Slice View Tomograph (J. Morita, Kyoto, Japan), Scanora 3D CBCT (Soredex, Tuusula, Finland), Galileos 3D Comfort (Sirona Dental Systems, Bensheim, Germany), Picasso Trio (E-WOO Technology, Giheung-gu, Republic of Korea), ProMax 3D (Planmeca OY, Helsinki, Finland), and Kodak 9000 3D (Trophy, Croissy-Beaubourg, France)] utilized for the detection of simulated ERR. In consideration to subjective image quality, ProMax 3D (Planmeca OY, Helsinki, Finland) which was also chosen for the present study performed the highest subjective image quality with significant differences among six CBCT systems (p < 0.05).31 We preferred using one CBCT system, since different CBCT systems offer various imaging settings such as; kVp, mA, FOV, voxel size, exposure time, dose etc. all of which may prevent researchers to perform standardized comparison of CBCT units for different diagnostic tasks. Therefore, we utilized images obtained from only one CBCT unit at different voxel sizes using its smallest FOV in order to make a reliable and standardized comparison. We compared our radiological measurements with those of direct physical measurements. The validity and accuracy of the caliper we used to measure the size of the cavity and water displacement technique we used to measure volume from direct impressions were previously demonstrated.32
CBCT still delivers greater effective doses when compared to intraoral imaging. The effective dose for the CBCT unit utilized in the present study is in the range 28–122 µSv.33 This is higher than the effective doses from periapical radiography taken with PSP with rectangular collimation (0.1–2.6 µSv).34 Therefore, clinicians should use caution when prescribing CBCT imaging. Intraoral radiographic systems can provide only limited information regarding ERR size and volume. The concordance of our CBCT measurements with physical measurements at voxel sizes smaller than 0.2 mm validates the use of our findings. In applying our results to clinical situations, CBCT images may be used not only for diagnosis and treatment planning but also for the outcome assessment of ERR treatment if deemed necessary. However, researchers should make clear that it is more difficult to segment unclear ERR defects encountered during routine clinical practice.
Conclusion
Given the limitations of the present study, observers using CBCT images obtained at four voxel sizes combining decreasing resolutions performed similarly in the quantification of artificial ERR with clinically insignificant distinction between types of CBCT software. The results of this study are to be considered specific to the one CBCT system evaluated and to situations where artefacts from the heavy restorations of the adjacent teeth do not obscure the information needed.
REFERENCES
- 1.Frank AL, Torabinejad M. Diagnosis and treatment of extracanal invasive resorption. J Endod 1998; 24: 500–4. doi: 10.1016/S0099-2399(98)80056-3 [DOI] [PubMed] [Google Scholar]
- 2.Andreasen JO. External root resorption: its implication in dental traumatology, paedodontics, periodontics, orthodontics and endodontics. Int Endod J 1985; 18: 109–18. doi: 10.1111/j.1365-2591.1985.tb00427.x [DOI] [PubMed] [Google Scholar]
- 3.Tronstad L. Root resorption--etiology, terminology and clinical manifestations. Endod Dent Traumatol 1988; 4: 241–52. doi: 10.1111/j.1600-9657.1988.tb00642.x [DOI] [PubMed] [Google Scholar]
- 4.Becker A, Chaushu S. Long-term follow-up of severely resorbed maxillary incisors after resolution of an etiologically associated impacted canine. Am J Orthod Dentofacial Orthop 2005; 127: 650–4. doi: 10.1016/j.ajodo.2004.03.031 [DOI] [PubMed] [Google Scholar]
- 5.Milberg DJ. Labially impacted maxillary canines causing severe root resorption of maxillary central incisors. Angle Orthod 2006; 76: 173–6. doi: 10.1043/0003-3219(2006)076[0173:LIMCCS]2.0.CO;2 [DOI] [PubMed] [Google Scholar]
- 6.Mohandesan H, Ravanmehr H, Valaei N. A radiographic analysis of external apical root resorption of maxillary incisors during active orthodontic treatment. Eur J Orthod 2007; 29: 134–9. doi: 10.1093/ejo/cjl090 [DOI] [PubMed] [Google Scholar]
- 7.Kravitz LH, Tyndall DA, Bagnell CP, Dove SB. Assessment of external root resorption using digital subtraction radiography. J Endod 1992; 18: 275–84. doi: 10.1016/S0099-2399(06)80954-4 [DOI] [PubMed] [Google Scholar]
- 8.Pohl Y, Filippi A, Kirschner H. Results after replantation of avulsed permanent teeth. I. Endodontic considerations. Dent Traumatol 2005; 21: 80–92. doi: 10.1111/j.1600-9657.2004.00297.x [DOI] [PubMed] [Google Scholar]
- 9.Fuss Z, Tsesis I, Lin S, diagnosis Root resorption:. Root resorption--diagnosis, classification and treatment choices based on stimulation factors. Dent Traumatol 2003; 19: 175–82. doi: 10.1034/j.1600-9657.2003.00192.x [DOI] [PubMed] [Google Scholar]
- 10.Tredwin CJ, Naik S, Lewis NJ, Scully C. Hydrogen peroxide tooth-whitening (bleaching) products: review of adverse effects and safety issues. Br Dent J 2006; 200: 371–6. doi: 10.1038/sj.bdj.4813423 [DOI] [PubMed] [Google Scholar]
- 11.Gulsahi A, Gulsahi K, Ungor M. Invasive cervical resorption: clinical and radiological diagnosis and treatment of 3 cases. Oral Surg Oral Med Oral Pathol Oral Radiol Endod 2007; 103: e65–e72. doi: 10.1016/j.tripleo.2006.10.005 [DOI] [PubMed] [Google Scholar]
- 12.Bakland LK, Resorption R. Dent Clin North Am 1992; 36: 491–507. [PubMed] [Google Scholar]
- 13.Kamburoğlu K, Kurşun S, Yüksel S, Oztaş B. Observer ability to detect ex vivo simulated internal or external cervical root resorption. J Endod 2011; 37: 168–75. doi: 10.1016/j.joen.2010.11.002 [DOI] [PubMed] [Google Scholar]
- 14.Creanga AG, Geha H, Sankar V, Teixeira FB, McMahan CA, Noujeim M. Accuracy of digital periapical radiography and cone-beam computed tomography in detecting external root resorption. Imaging Sci Dent 2015; 45: 153–8. doi: 10.5624/isd.2015.45.3.153 [DOI] [PMC free article] [PubMed] [Google Scholar]
- 15.Leach HA, Ireland AJ, Whaites EJ. Radiographic diagnosis of root resorption in relation to orthodontics. Br Dent J 2001; 190: 16–22. [DOI] [PubMed] [Google Scholar]
- 16.Kamburoglu K, Barenboim SF, Aritürk T, Kaffe I. Quantitative measurements obtained by micro-computed tomography and confocal laser scanning microscopy. Dentomaxillofac Radiol 2008; 37: 385–91. doi: 10.1259/dmfr/57348961 [DOI] [PubMed] [Google Scholar]
- 17.Patel S, Dawood A, Whaites E, Pitt Ford T. New dimensions in endodontic imaging: part 1. Conventional and alternative radiographic systems. Int Endod J 2009; 42: 447–62. doi: 10.1111/j.1365-2591.2008.01530.x [DOI] [PubMed] [Google Scholar]
- 18.Scarfe WC, Farman AG. What is cone-beam CT and how does it work? Dent Clin North Am 2008; 52: 707–30. doi: 10.1016/j.cden.2008.05.005 [DOI] [PubMed] [Google Scholar]
- 19.Patel S. New dimensions in endodontic imaging: Part 2. Cone beam computed tomography. Int Endod J 2009; 42: 463–75. doi: 10.1111/j.1365-2591.2008.01531.x [DOI] [PubMed] [Google Scholar]
- 20.White SC. Cone-beam imaging in dentistry. Health Phys 2008; 95: 628–37. doi: 10.1097/01.HP.0000326340.81581.1a [DOI] [PubMed] [Google Scholar]
- 21.Kamburoğlu K, Kursun S. A comparison of the diagnostic accuracy of CBCT images of different voxel resolutions used to detect simulated small internal resorption cavities. Int Endod J 2010; 43: 798–807. doi: 10.1111/j.1365-2591.2010.01749.x [DOI] [PubMed] [Google Scholar]
- 22.Cohenca N, Simon JH, Mathur A, Malfaz JM. Clinical indications for digital imaging in dento-alveolar trauma. Part 2: root resorption. Dent Traumatol 2007; 23: 105–13. doi: 10.1111/j.1600-9657.2006.00546.x [DOI] [PubMed] [Google Scholar]
- 23.Alqerban A, Jacobs R, Souza PC, Willems G. In-vitro comparison of 2 cone-beam computed tomography systems and panoramic imaging for detecting simulated canine impaction-induced external root resorption in maxillary lateral incisors. Am J Orthod Dentofacial Orthop 2009; 136: 764.e1, 764.e1–764.e11. doi: 10.1016/j.ajodo.2009.03.036 [DOI] [PubMed] [Google Scholar]
- 24.Patel S, Dawood A, Wilson R, Horner K, Mannocci F. The detection and management of root resorption lesions using intraoral radiography and cone beam computed tomography - an in vivo investigation. Int Endod J 2009; 42: 831–8. doi: 10.1111/j.1365-2591.2009.01592.x [DOI] [PubMed] [Google Scholar]
- 25.Patel S, Kanagasingam S, Pitt Ford T, Ford TP. External cervical resorption: a review. J Endod 2009; 35: 616–25. doi: 10.1016/j.joen.2009.01.015 [DOI] [PubMed] [Google Scholar]
- 26.Liedke GS, da Silveira HE, da Silveira HL, Dutra V, de Figueiredo JA. Influence of voxel size in the diagnostic ability of cone beam tomography to evaluate simulated external root resorption. J Endod 2009; 35: 233–5. doi: 10.1016/j.joen.2008.11.005 [DOI] [PubMed] [Google Scholar]
- 27.Sousa Melo SL, Vasconcelos KF, Holton N, Allareddy V, Allareddy V, Tabchoury CPM, et al. Impact of cone-beam computed tomography scan mode on the diagnostic yield of chemically simulated external root resorption. Am J Orthod Dentofacial Orthop 2017; 151: 1073–82. doi: 10.1016/j.ajodo.2016.10.041 [DOI] [PubMed] [Google Scholar]
- 28.Ponder SN, Benavides E, Kapila S, Hatch NE. Quantification of external root resorption by low- vs high-resolution cone-beam computed tomography and periapical radiography: A volumetric and linear analysis. Am J Orthod Dentofacial Orthop 2013; 143: 77–91. doi: 10.1016/j.ajodo.2012.08.023 [DOI] [PubMed] [Google Scholar]
- 29.Da Silveira PF, Fontana MP, Oliveira HW, Vizzotto MB, Montagner F, Silveira HL, et al. CBCT-based volume of simulated root resorption - influence of FOV and voxel size. Int Endod J 2015; 48: 959–65. doi: 10.1111/iej.12390 [DOI] [PubMed] [Google Scholar]
- 30.Lermen CA, Liedke GS, da Silveira HE, da Silveira HL, Mazzola AA, de Figueiredo JA. Comparison between two tomographic sections in the diagnosis of external root resorption. J Appl Oral Sci 2010; 18: 303–7. doi: 10.1590/S1678-77572010000300019 [DOI] [PMC free article] [PubMed] [Google Scholar]
- 31.Alqerban A, Jacobs R, Fieuws S, Nackaerts O, Willems G. SEDENTEXCT Project Consortium. Comparison of 6 cone-beam computed tomography systems for image quality and detection of simulated canine impaction-induced external root resorption in maxillary lateral incisors. Am J Orthod Dentofacial Orthop 2011; 140: e129–e139. doi: 10.1016/j.ajodo.2011.03.021 [DOI] [PubMed] [Google Scholar]
- 32.Kamburoğlu K, Murat S, Kılıç C, Yüksel S, Avsever H, Farman A, et al. Accuracy of CBCT images in the assessment of buccal marginal alveolar peri-implant defects: effect of field of view. Dentomaxillofac Radiol 2014; 43: 20130332. doi: 10.1259/dmfr.20130332 [DOI] [PMC free article] [PubMed] [Google Scholar]
- 33.Pauwels R, Beinsberger J, Collaert B, Theodorakou C, Rogers J, Walker A, et al. SEDENTEXCT Project Consortium. Effective dose range for dental cone beam computed tomography scanners. Eur J Radiol 2012; 81: 267–71. doi: 10.1016/j.ejrad.2010.11.028 [DOI] [PubMed] [Google Scholar]
- 34.Granlund C, Thilander-Klang A, Ylhan B, Lofthag-Hansen S, Ekestubbe A. Absorbed organ and effective doses from digital intra-oral and panoramic radiography applying the ICRP 103 recommendations for effective dose estimations. Br J Radiol 2016; 89: 20151052. doi: 10.1259/bjr.20151052 [DOI] [PMC free article] [PubMed] [Google Scholar]


