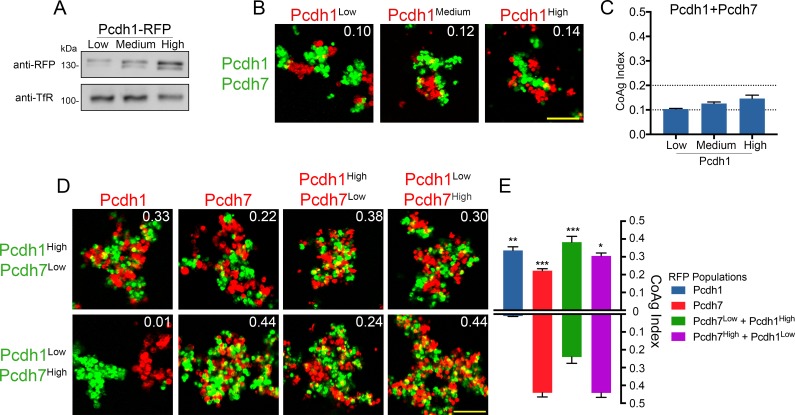
Figure 5. Relative surface expression modulates mismatch coaggregation behavior.
(A) Western blot of biotinylated membranes showing low, medium, and high surface expressing populations of Pcdh1 after DNA titration. (B) Representative images of mismatch coaggregation assays mixing Pcdh1+Pcdh7 cells with Pcdh1 (low, medium, and high) cells. Scale bar, 100 μm. Results for each assay were determined from three independent electroporations. (C) Mean CoAg values show varying the expression levels in Pcdh1 cells did not alter the coaggregation behavior (interfacing), but did affect the degree of interfacing. Error bars indicate ±SEM. Dotted lines indicate thresholds for change in coaggregation category. (D) Representative images of mismatch coaggregation assays where the relative expression levels of co-expressed δ-Pcdhs were varied. Pcdh1High+Pcdh7Low cells and their complement, Pcdh1Low+Pcdh7High cells, were combined with cells expressing a given δ-Pcdh population. The two images in a given column (e.g. Pcdh1, column 1) illustrate the differences in coaggregation behavior when mixed with these two populations. (E) Mean CoAg values for (D), each bar indicates values for the top image in a given column vs. values for the lower image in a given column. Error bars indicate ±SEM, * indicates p≤0.05, **p≤0.01, ***p≤0.001. Results for each assay were determined from four independent electroporations.


