Abstract
Magnetic resonance fingerprinting (MRF) is a promising framework that allows the quantification of multiple magnetic resonance parameters with a single scan. MRF using fast imaging with steady-state precession (MRF-FISP) has robustness to off-resonance artifacts and has many applications in inhomogeneous fields. However, the spoiler gradient used in MRF-FISP is sensitive to diffusion motion, and may lead to quantification errors when the spoiler moment increases. In this study, we examined the effect of the diffusion weighting in MRF-FISP caused by spoiler gradients. The T2 relaxation times were greatly underestimated when large spoiler moments were used. The T2 underestimation was prominent for tissues with large values of T2 and diffusion coefficients. The T2 bias was almost independent of the apparent diffusion coefficient (ADC) and T2 values when the ADC map was measured and incorporated into the matching process. These results reveal that the T2 underestimation resulted from the diffusion weighting caused by the spoiler gradients.
Keywords: diffusion weighting, magnetic resonance fingerprinting, magnetic resonance fingerprinting using fast imaging with steady-state precession, spoiler gradient, T2 underestimation
Introduction
Conventional clinical MRI scanners can detect disease pathologies, but in most cases, they are qualitative in nature. In contrast, quantitative MRI measurements could more directly reflect disease changes and be more helpful for disease detection and follow-up. These quantitative MRI assessments include T1 and T2 relaxation times,1 proton density, diffusion2,3 and perfusion4 parameters, magnetic transfer effects,5 and other tissue parameters. Despite many efforts, quantitative MRI measurements still face technical challenges, e.g., reproducibility and lengthy scan times to obtain multiple parameters.
Recently, a new framework for quantifying multiple tissue parameters in a single scan, called magnetic resonance fingerprinting (MRF), has been proposed.6 MRF has the potential to overcome the limitations of conventional quantitative methods, enabling routine quantitative MRF in clinical and preclinical environments.
Magnetic resonance fingerprinting uses the responses of tissues or materials to repeated excitation and acquisition schemes. MRF acquires a transient-state signal with pseudorandom acquisition parameters. The acquired signal is matched with a predetermined dictionary of possible signal evolutions calculated with appropriate tissue and system parameters, and the best-matched entry is used to assign multiple tissue properties simultaneously.
The acquisition schemes that are mostly used in the MRF framework are the balanced steady-state-based MRF (MRF-bSSFP)6 and MRF using fast imaging with steady-state precession (MRF-FISP).7 MRF-bSSFP has the advantage of high signal intensity, but quantification of relaxation parameters is affected by banding artifacts arising from the B0 inhomogeneity. In contrast, MRF-FISP uses the unbalanced gradient moment, which can alleviate the banding artifacts, and extends the application of MRF to inhomogeneous fields that are potentially challenging for MRF-bSSFP.
However, MRF-FISP can be affected by banding artifacts where there is a large off-resonance variation in an imaging volume, such as in high field strengths,8 under insufficient shimming, and for wide FOV scanners. Moreover, it is not straightforward to suppress the banding artifacts in regions where sharp susceptibility transitions exist, such as nasal cavities and auditory canals.
In such cases, the use of much stronger spoiler gradients is a simple way to alleviate banding artifacts. However, gradient-spoiled imaging is particularly sensitive to diffusive motion, especially when the spoiler gradient precedes imaging.9–11 Therefore, the increased gradient moment in MRF-FISP also causes increased sensitivity to diffusion and motion along the gradient direction. However, the diffusion-weighting effect has been neglected in the MRF-FISP framework and is not generally built into the MRF-FISP dictionaries that are used for pattern matching. The neglect of diffusion may lead to false estimates of relaxation times.
In this study, we examined the effect of diffusion weighting in MRF-FISP with spoiler moments, and we showed that the diffusion effect results in T2 underestimation, and that the T2 bias for tissues with large T2 and diffusion coefficients is nonnegligible even for moderate gradient moments.
Methods
Samples
For the phantom study, we used nine test tubes filled with water with CuSO4 (0.13, 0.4, and 2 g/l) to alter T1 and T2 and with glycerol (0, 12.5, and 25%) to alter the diffusion coefficient. For the reference, the T1, T2, and apparent diffusion coefficient (ADC) maps were acquired using standard methods. The T1 map was acquired with inversion-recovery spin-echo sequences (inversion time = 20, 50, 100, 200, 400, 800, 1500, and 3000 ms; TE/TR = 10/8000 ms) and the T2 map was acquired with a multiple spin echo (MSE) sequence (interecho spacing = 10 ms, TR = 8000 ms). The ADC map was estimated using the standard Stejskal-Tanner method (b = 0, 35.1, 141, and 316 s/mm 2).
MRI systems
The phantoms were measured on a vertical bore 4.74T system (Oxford Instruments, UK; bore diameter = 88.3 mm) with shielded gradients, a home-built radio-frequency coil, and a digital MRI console12 (DTRX6, MRTechnology, Japan). The field homogeneity was about 1 ppm over 20 mm in diameter of spherical volume (DSV).
For the in vivo study, MRF-FISP measurements were performed on a healthy C57BL/6JJcl mouse brain using a small-bore 1.5T system (bore diameter = 280 mm; JASTEC, Kobe, Japan) with shielded gradients. The field homogeneity was 50 ppm over 160 mm DSV.
MRF pulse sequences
The MRF-FISP acquisition was initiated with an adiabatic inversion pulse, which was followed by N successive FISP acquisition periods with varying flip angle (FA) and TR. N = 300 and TE was held constant (5 ms). FA was varied pseudo-randomly and sinusoidally (5–90°) and TR was varied using a Perlin noise pattern (20–30 ms) (Fig. 1). To avoid the potential imaging artifacts arising from hardware imperfections, Cartesian sampling13 was used for the MRF acquisition. The acquired MRF signal evolution profile was matched to an MRF dictionary. To correct the B1 inhomogeneity, the B1 dimension was added to the MRF dictionaries, and a B1 map measured with a double-angle method was incorporated into the dictionary-matching process. Vector-based inner product comparisons were used as a matching algorithm. To examine the effect of diffusion weighting in MRF-FISP, the moment of the spoiler gradient was varied from 2π to 32π per slice thickness. Here, we set the slice thickness to be 2.5 mm, and the moment ranged from 9.5 to 150 mT/m×ms.
Fig. 1.
Patterns of (a) flip angle (FA) and (b) TR used for the magnetic resonance fingerprinting using fast imaging with steady-state precession (MRF-FISP) sequence.
Conventionally, the MRF-FISP dictionary is generated without considering the diffusion effect. To consider this effect, we generated two types of MRF-FISP dictionaries; one without the diffusion effect (dictionary D−) and one with the diffusion effect (dictionary D+). The MRF dictionaries D− with a range of T1 (20–1500 ms), T2 (10–1200 ms), B1 (0.6–1.2) were created using an extended phase graph (EPG) algorithm.14 The MRF-FISP dictionary D+ with the additional dimension of the diffusion coefficient D (0–2.6 × 10− 3 mm 2 /s) was also generated using EPG with isotropic diffusion operators, and , where D̃ L and D̃ T are the diffusion operators for the longitudinal and transverse configuration states, respectively, k is the Fourier space coordinate, and where γGτ is the zeroth moment of the spoiler gradient.
For the phantom study, the slice thickness was 2.5 mm, and the FOV was 25.6×25.6 mm 2 . The whole TR was 12 s, and the measurement time was 26 min for MRF-FISP [number of excitations (NEX) = 1]. For the in vivo study, the slice thickness was 2.5 mm, and the FOV was 32×32 mm 2 . The whole TR was 12 s, and the measurement time was 26 min. The matrix size was 128×128 for all the measurements.
Results
Magnetic resonance fingerprinting using fast imaging with steady-state precession
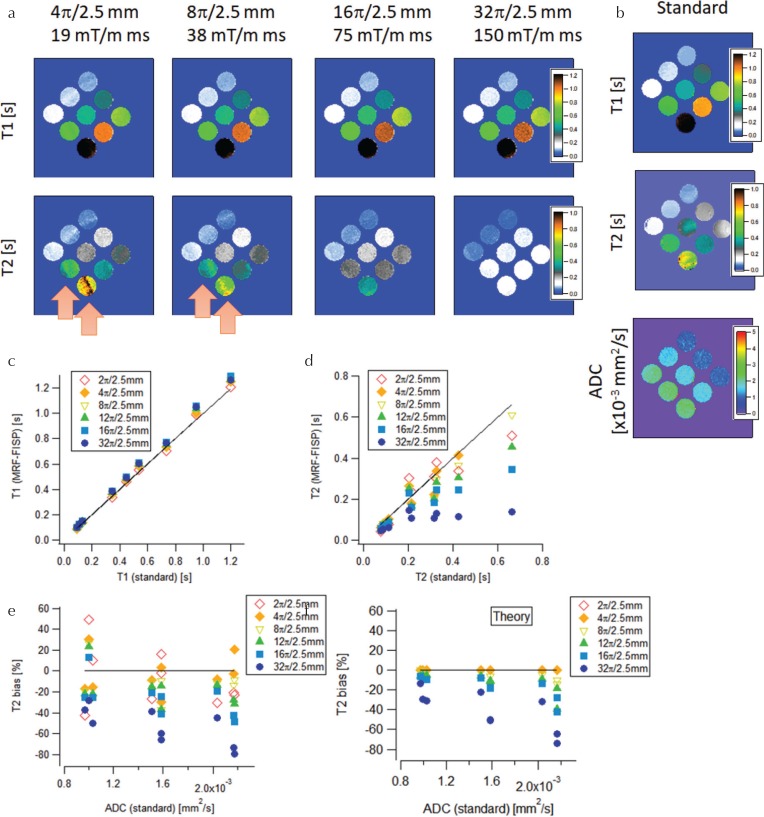
Figure 2 shows T1 and T2 estimates from MRF-FISP using dictionary D− (excluding diffusion). At small spoiler moments, both the T1 and T2 maps suffered from banding artifacts (indicated by arrows in the figure) and showed large variations in the estimated values in the region where the banding appeared. As the moment of the spoiler gradient increased, the banding artifacts became less clear, and the T1 and T2 values became almost constant in each phantom. The T1 estimates were almost independent of the moment, and showed a high correlation with the T1 standards (Fig. 2c). However, the T2 estimates significantly decreased as the moment increased (Fig. 2d), and deviated from the T2 standards. The T2 bias, which was defined as the difference between the T2 estimates and the T2 standards, became severe (increased negatively) as the moment increased (Fig. 2e). For large moments, the T2 bias increased negatively as the ADC increased. For small moments, the T2 bias had large variations because of the banding artifact.
Fig. 2.
Magnetic resonance fingerprinting using fast imaging with steady-state precession (MRF-FISP) results obtained without considering the diffusion effect. (a) T1 and T2 estimates from MRF-FISP for different spoiler gradient moments. (b) T1, T2, and apparent diffusion coefficient (ADC) maps from standard methods. Comparison of (c) T1 and (d) T2 between MRF-FISP and standard methods. (e) Experimental and (f) theoretical T2 bias vs ADC.
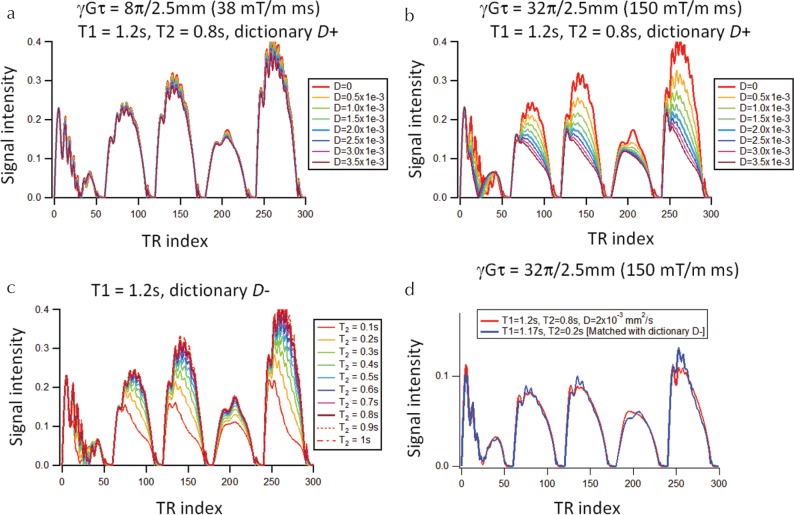
Figure 3a and 3b show an example of MRF-FISP signal entries from dictionary D+ (including diffusion). The signals were almost independent of D for the moderate moment (38 mT/m×ms). However, they decreased significantly with D for the large moment (150 mT/m×ms). Similar behavior is observed in the signal entries of dictionary D− (Fig. 3c); the signal intensity increased as T2 increased. As shown in Fig. 3d, the signal evolutions for large D values in D+ (Fig. 3b) were similar to those for small T2 values in D− (Fig. 3c). This characteristic would lead to T2 underestimation when dictionary D− was used for matching.
Fig. 3.
(a and b) Example of entries in dictionary D+ including diffusion for T1 = 1.2 s, T2 = 0.8 s, and varying D. The moment was (a) 8π/2.5 mm (38 mT/m×ms) and (b) 32π/2.5 mm (150 mT/m×ms). (c) Example of entries in dictionary D− excluding diffusion for T1 = 1.2 s and varying D. (d) Example of T2 underestimation. The signal evolution including the diffusion effect (red line) was matched with dictionary D− and the best-matched entry is shown as a blue line.
To estimate the theoretical T2 bias caused by the diffusion effect, the signal evolution in dictionary D+ was matched with that in dictionary D− and the resulting bias between the true T2 value and the best-matched T2 value was calculated. Figure 2f shows the theoretical T2 bias for the nine phantoms. It was negligibly small for the small moment, while it became severe for large moments and large ADC values. These features agreed with those observed in the experimental results (Fig. 2e).
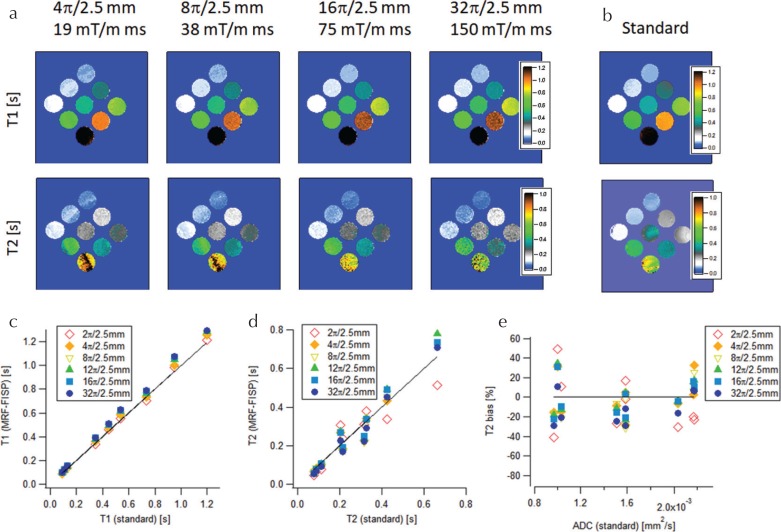
To validate experimentally that the T2 underestimation originates from the diffusion effect, the ADC map was also measured and incorporated into the matching processes with dictionary D+. Figure 4 shows the resulting T1 and T2 estimates. Both estimates agreed with their standard values for different gradient moments (Fig. 4c and 4d), and the T2 bias was almost independent of the ADC value (Fig. 4e). These results support the claim that the measured T2 underestimation originates from the diffusion weighting caused by the spoiler gradient.
Fig. 4.
Magnetic resonance fingerprinting using fast imaging with steady-state precession (MRF-FISP) results obtained while considering the diffusion effect. (a) T1 and T2 estimates from MRF-FISP for different spoiler gradient moments. (b) T1 and T2 maps from standard methods. Comparison of (c) T1 and (d) T2 between MRF-FISP and standard methods. (e) T2 bias vs apparent diffusion coefficient (ADC).
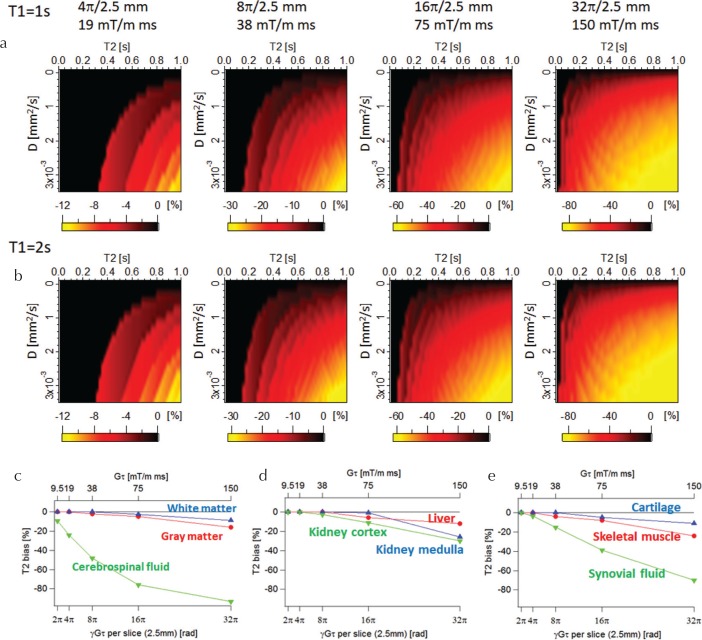
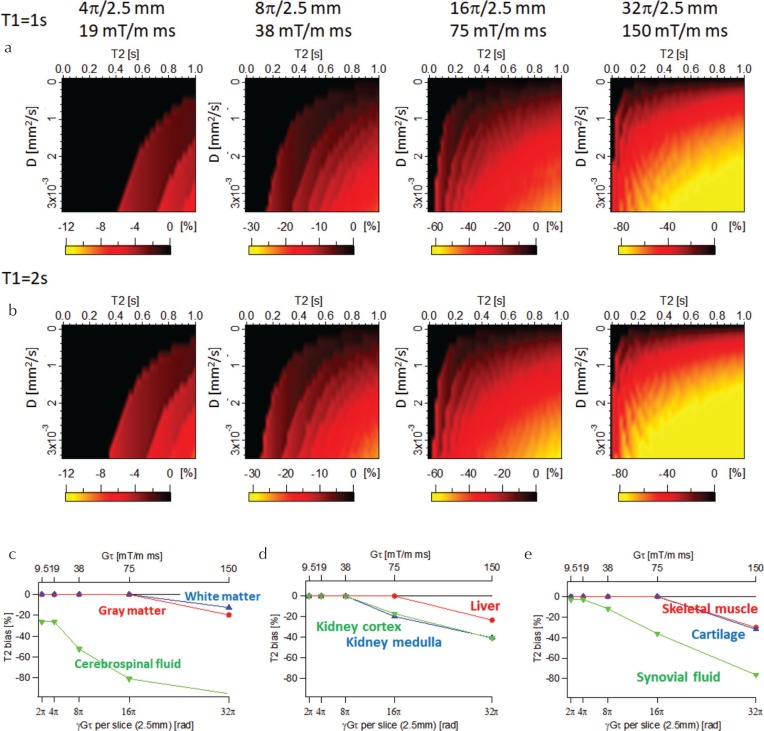
Figure 5 shows the theoretical T2 bias for different gradient moments calculated without including diffusion. At a fixed moment, the T2 underestimation became larger as the theoretical T2 and D values became larger. The T2 bias was almost independent of the true T1. Figures 5c and d show the T2 bias estimated for T1, T2, and D values of typical tissues15–28 (Table 1). For tissues with relatively short T2 and small D values (e.g., white matter and gray matter), the T2 bias was not severe even with the large moments, but those with long T2 and large D values showed severe T2 bias even with the small moment. For example, the T2 bias for cerebrospinal fluid (CSF) (T1 = 5000 ms, T2 = 2100 ms, and D = 3.2 × 10 −3 mm 2 /s) reached to −26% even for the moment of 19 mT/m×ms (4π/2.5 mm).
Fig. 5.
Theoretical T2 bias calculated without including diffusion. T2 bias maps for (a) T1 = 1 s and (b) T2 = 2 s. (c–e) T2 bias for typical tissues as a function of spoiler moment.
Table 1.
T1, T2, and D values used for simulation. The numbers in square brackets show reference numbers
| Tissue | T1 (ms) | T2 (ms) | D (× 10−3 mm2/s ) |
|---|---|---|---|
| Gray matter | 2000*1 (16–19) | 90*1 (16–19) | 0.83 (24) |
| White matter | 700*1 (16–19) | 70*1 (16–19) | 0.64 (24) |
| CSF | 5000*1 (16–19) | 2100*1 (16–19) | 3.2 (24) |
| Liver | 809*2 (20) | 34*2 (20) | 1.24 (25) |
| Kidney medulla | 1545*2 (20) | 81*2 (20) | 2.21 (26) |
| Kidney cortex | 1142*2 (20) | 76*2 (20) | 2.26 (26) |
| Skeletal muscle | 1017*2 (21,22) | 50*2 (21,22) | 2.2 (27) |
| Cartilage | 1015.6*2 (23) | 39.1*2 (23) | 1.088 (28) |
| Synovial fluid | 2564.7*2 (23) | 652.9*2 (23) | 1.84 (29) |
Measured at 1.5T,
Measured at 3T: CSF, cerebral spinal fluid.
In vivo study
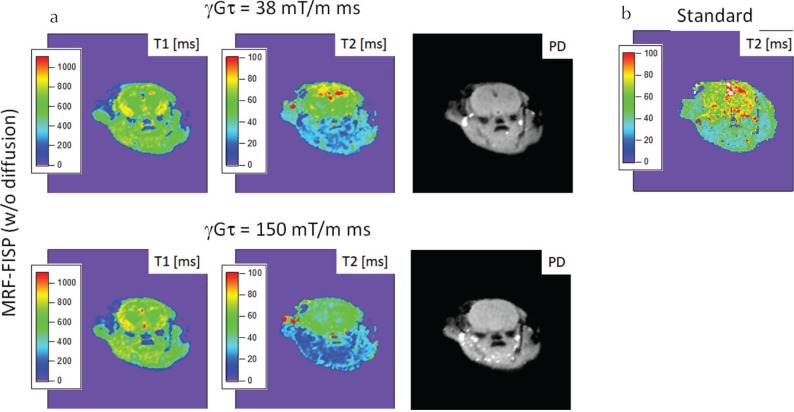
Figure 6 shows the MRF-FISP and MSE results for the in vivo mouse brain. T2 estimates from MRF-FISP excluding diffusion showed a reduced T2 value for the larger moment, especially in CSF and in the region outside the brain.
Fig. 6.
Results for in vivo mouse brain. (a) T1, T2, and proton density (PD) from magnetic resonance fingerprinting using fast imaging with steady-state precession (MRF-FISP) without including diffusion. (b) T2 from the standard method.
Discussion
We experimentally and theoretically validated the diffusion-weighting effect caused by spoiler gradients in MRF-FISP, which has been neglected in the MRF-FISP framework. In the phantom experiment, the T2 estimates from MRF-FISP excluding diffusion depended on the gradient moment, and decreased as the moment increased. The T2 bias negatively increased as T2 and ADC increased, agreeing with the theoretical results. The phantom results of MRF-FISP with the additional ADC map did not show the T2 underestimation (Fig. 4). These results reveal that the T2 underestimation resulted from the diffusion weighting caused by the spoiler gradients.
The diffusion weighting in MRF-FISP can be understood by considering signal pathways in the Fourier transformation space.9,10 For a FISP sequence in which TR and FA are fixed, echoes are formed through free induction decay (FID) and different refocusing pathways, which include those from configuration states with higher-order k. These higher-order states are affected by diffusion in a stronger way and contribute strongly to signal attenuation within each TR. Similarly, for an MRF-FISP in which pseudo-steady states were achieved by slightly varying TR and FA, higher-order states contribute to signal attenuation, leading to the underestimation of T2 when diffusion is not considered.
It should be noted that the calculation results indicate that the T2 bias is large for tissues with large T2 and D values. For example, a large T2 bias of CSF was observed even for moderate moments (Gτ = 19 mT/m×ms). This moment value was also used in the original MRF-FISP study,7 and was of a similar order of magnitude to those found in previous studies.29,30 The same tendency was observed for different acquisition parameters N, TR, and FA (Fig. 7). Although there are high degrees of freedom in designing an MRF-FISP and the T2 bias may depend on the acquisition scheme to varying degrees, care should be taken when tissues with large T2 and D values are estimated using MRF-FISP. T2 underestimation is especially pronounced when a much stronger spoiler gradient is required to alleviate strong banding artifacts caused by large field inhomogeneities. For example, when the moment exceeds 75 mT/m×ms, most tissues are affected by diffusion, resulting in significant T2 underestimation.
Fig. 7.
Theoretical T2 bias calculated without including diffusion using the same sequence parameters as used in Jiang et al.7 (N = 1200). T2 bias maps for (a) T1 = 1 s and (b) T2 = 2 s. (c–e) T2 bias for typical tissues as a function of spoiler moment.
In the conventional FISP, the diffusion sensitivity can be characterized by the diffusion time, which is defined as .31 The regime TR < T′ D < T 2 with the flip angle larger than the Ernst angle is the diffusion-sensitive regime in which the FID signal is highly sensitive to diffusion. Although FA and TR are varied, MRF-FISP would have the similar tendency, and thus T′ D would give a rough estimate of the diffusion sensitivity for different tissues. In MRF-FISP, TR < T′ D in most cases, and tissues with T 2 > T′ D would be strongly affected by diffusion. For TR = 12.5 ms and D = 2.0 × 10 −3 mm 2 /s, T′ D = 1.22s for the moderate moment of 38 mT/m×ms, and most tissues would be unaffected by diffusion. As the moment increases, T′ D decreases and the diffusion-sensitive regime becomes wider, and more tissues would be sensitive to diffusion. For the large moment of 150 mT/m×ms, T′ D reduces to 78.4 ms.
It can be expected that the diffusion weighting is also inherently present in MRF acquisitions using balanced gradients to varying degrees, because it is practically difficult to achieve fully balanced gradients because of eddy-current effects, concomitant fields, and other hardware imperfections resulting in gradient deviations.
The T2 bias could be alleviated by using dictionary D+ and incorporating the additionally measured ADC map into the matching process; we validated this approach with the phantom measurements. It should be noted that even using dictionary D+, if the ADC map was not incorporated, diffusion and T2 could not be accurately distinguished and estimated (data are not shown here). This is because the sequence used was sensitive to both diffusion and T2, and yielded similar signal evolutions for different T2 and D values. Similar problems are often seen in the MRF framework. For example, it has been shown that different pulse shapes used for slice selection produce different T2 values because the MRF sequences have similar sensitivities to B1 and T2. Although MRF sequences have near-infinite possibilities of identifying magnetic resonance parameters of interest, pulse sequence components should be designed and implemented to impart differential sensitivity to the parameters of interest, and MRF sequence design and implementation will continue to be a significant open area of research to meet this requirement.
Regardless of whether the diffusion effect was included or not, the MRF-FISP results showed T2 variation originating from banding artifacts when the spoiler gradient was weak. One simple way of alleviating T2 variation is to increase the strength of spoiler gradients, as was shown in Fig. 4. Another way is to use shorter TRs. In this study, we used relatively long TRs compared with the original studies, because of hardware limitations. Modern hardware could use shorter TRs and offer improved tolerance to field inhomogeneity. However, this approach would pose a limitation when the inhomogeneity is significantly large, such as in high field strengths and in an imaging volume where sharp susceptibility transitions exist. In such cases, the use of a stronger spoiler gradient is the practical solution to overcome the banding issues.
Another way of avoiding T2 bias in the MRF framework may be to use MRF based on a double-echo steady state (MRF-DESS32): to increase the diffusion sensitivity, the strength of the spoiler gradient is varied and both FID and echo signals are acquired. MRF-DESS is sensitive to both T2 and diffusion variations, and ADC values can also be estimated. MRF-DESS could be more efficient than MRF-FISP because it does not require the lengthy ADC measurements. Moreover, MRF-DESS uses a stronger spoiler gradient and hence is less susceptible to banding artifacts. However, MRF-DESS has several potential disadvantages compared with MRF-FISP. First, MRF-DESS requires high hardware performance to achieve fast switching of strong gradients with high fidelity within short TR intervals. Second, MRF-DESS tends to be less tolerant of systematic errors, because the echo signals are largely attenuated by the stronger spoiler gradients and the signal-to-noise ratios are reduced. Third, MRF-DESS has more complicated sensitivities to T2, D, and B1, and has the increased similarity between different signal evolutions. Therefore, special care should be taken to design the MRF-DESS sequence to differentiate the T2 and D values. The protocol optimization33 for DESS may serve to design the MRF-DESS sequence.
Our in vivo study has a limitation that we did not perform the ADC measurement because we needed to reduce the measurement time to keep the mouse alive. In the in vivo experiment, T2 estimates from MRF-FISP excluding diffusion were smaller in CSF and in the region outside the brain for the larger moment. This is probably because the diffusion coefficient was large in these regions, which could be confirmed by measuring the ADC map using a fast imaging method.
Conclusion
Diffusion weighting caused by spoiler gradients in MRF-FISP was validated experimentally and theoretically. Without considering diffusion, T2 from MRF-FISP was greatly underestimated for large gradient moments. The T2 underestimation was more prominent for tissues with large T2 and D values. The T2 bias was almost independent of the ADC value when we incorporated the diffusion effect of the spoiler gradients into the dictionary and incorporated the ADC maps. These results reveal that the T2 underestimation resulted from the diffusion weighting caused by the spoiler gradients.
Acknowledgments
We would like to thank Katsumi Kose and Tomoyuki Haishi for their help with developing the hardware and preparing the sample. This work was supported by JSPS KAKENHI Grant Number JP15K04719.
Footnotes
Conflicts of Interest
The authors or the authors’ institutions have no conflicts of interest.
References
- 1. Cheng HL, Stikov N, Ghugre NR, Wright GA. Practical medical applications of quantitative MR relaxometry. J Magn Reson Imaging 2012; 36: 805– 824. [DOI] [PubMed] [Google Scholar]
- 2. Koh DM, Collins DJ. Diffusion-weighted MRI in the body: applications and challenges in oncology. AJR Am J Roentgenol. 2007; 188: 1622– 1635. [DOI] [PubMed] [Google Scholar]
- 3. Subhawong TK, Jacobs MA, Fayad LM. Insights into quantitative diffusion-weighted MRI for musculoskeletal tumor imaging. AJR Am J Roentgenol 2014; 203: 560– 572. [DOI] [PubMed] [Google Scholar]
- 4. Jackson A, O’Connor J, Thompson G, Mills S. Magnetic resonance perfusion imaging in neuro-oncology. Cancer Imaging 2008; 8: 186– 199. [DOI] [PMC free article] [PubMed] [Google Scholar]
- 5. Henkelman RM, Stanisz GJ, Graham SJ. Magnetization transfer in MRI: a review. NMR Biomed. 2001; 14: 57– 64. [DOI] [PubMed] [Google Scholar]
- 6. Ma D, Gulani V, Seiberlich N, et al. Magnetic resonance fingerprinting. Nature 2013; 495: 187– 192. [DOI] [PMC free article] [PubMed] [Google Scholar]
- 7. Jiang Y, Ma D, Seiberlich N, Gulani V, Griswold MA. MR fingerprinting using fast imaging with steady state precession (FISP) with spiral readout. Magn Reson Med 2015; 74: 1621– 1631. [DOI] [PMC free article] [PubMed] [Google Scholar]
- 8. Terada Y. Initial implementation of magnetic resonance fingerprinting on a preclinical 14.1 T scanner. In Proceedings of the 25th Annual Meeting of the ISMRM, Honolulu, Hawaii, USA, 2017; 5220. [Google Scholar]
- 9. Wu E, Buxton R. Effect of diffusion on the steady-state magnetization with pulsed field gradients. J Magn Reson 1990; 90: 243– 253. [Google Scholar]
- 10. Buxton R. The diffusion sensitivity of fast steady-state free precession imaging. Magn Reson Med 1993; 29: 235– 243. [DOI] [PubMed] [Google Scholar]
- 11. Hargreaves BA. Rapid gradient-echo imaging. J Magn Reson Imaging 2012; 36: 1300– 1313. [DOI] [PMC free article] [PubMed] [Google Scholar]
- 12. Hashimoto S, Kose K, Haishi T. Comparison of analog and digital transceiver systems for MR imaging. Magn Reson Med Sci 2014; 13: 285– 291. [DOI] [PubMed] [Google Scholar]
- 13. Gao Y, Chen Y, Ma D, et al. Preclinical MR fingerprinting (MRF) at 7 T: effective quantitative imaging for rodent disease models. NMR Biomed 2015; 28: 384– 394. [DOI] [PMC free article] [PubMed] [Google Scholar]
- 14. Weigel M. Extended phase graphs: dephasing, RF pulses, and echoes - pure and simple. J Magn Reson Imaging 2015; 41: 266– 295. [DOI] [PubMed] [Google Scholar]
- 15. Deoni SC, Peters TM, Rutt BK. High-resolution T1 and T2 mapping of the brain in a clinically acceptable time with DESPOT1 and DESPOT2. Magn Reson Med 2005; 53: 237– 241. [DOI] [PubMed] [Google Scholar]
- 16. Vymazal J, Righini A, Brooks RA, et al. T1 and T2 in the brain of healthy subjects, patients with Parkinson Disease, and patients with multiple system atrophy: relation to iron content. Radiology 1999; 211: 489– 495. [DOI] [PubMed] [Google Scholar]
- 17. Whittall KP, MacKay AL, Graeb DA, Nugent RA, Li DK, Paty DW. In vivo measurement of T2 distributions and water contents in normal human brain. Magn Reson Med 1997; 37: 34– 43. [DOI] [PubMed] [Google Scholar]
- 18. Poon CS, Henkelman RM. Practical T2 quantitation for clinical applications. J Magn Reson Imaging 1992; 2: 541– 553. [DOI] [PubMed] [Google Scholar]
- 19. de Bazelaire CM, Duhamel GD, Rofsky NM, Alsop DC. MR imaging relaxation times of abdominal and pelvic tissues measured in vivo at 3.0 T: preliminary results. Radiology 2004; 230: 652– 659. [DOI] [PubMed] [Google Scholar]
- 20. Chen Y, Lee GR, Aandal G, et al. Rapid volumetric T1 mapping of the abdomen using three-dimensional through-time spiral GRAPPA. Mang Reson Med 2016; 75: 1457– 1465. [DOI] [PMC free article] [PubMed] [Google Scholar]
- 21. Stanisz GJ, Odrobina EE, Pun J, et al. T1, T2 relaxation and magnetization transfer in tissue at 3T. Magn Reson Med 2005; 54: 507– 512. [DOI] [PubMed] [Google Scholar]
- 22. Jordan CD, Saranathan M, Bangerter NK, Hargreaves BA, Gold GE. Musculoskeletal MRI at 3.0 T and 7.0 T: a comparison of relaxation times and image contrast. Eur J Radiol 2013; 82: 734– 739. [DOI] [PMC free article] [PubMed] [Google Scholar]
- 23. Le Bihan D, Mangin JF, Poupon C, et al. Diffusion tensor imaging: concepts and applications. J Magn Reson Imaging 2001; 13: 534– 546. [DOI] [PubMed] [Google Scholar]
- 24. Bruegel M, Holzapfel K, Gaa J, et al. Characterization of focal liver lesions by ADC measurements using a respiratory triggered diffusion-weighted single-shot echo-planar MR imaging technique. Eur Radiol 2008; 18: 477– 485. [DOI] [PubMed] [Google Scholar]
- 25. Sulkowska K, Palczewski P, Duda-Zysk A, et al. Diffusion-weighted MRI of kidneys in healthy volunteers and living kidney donors. Clin Radiol 2015; 70: 1122– 1127. [DOI] [PubMed] [Google Scholar]
- 26. Heemskerk AM, Damon BM. Diffusion tensor MRI assessment of skeletal muscle architecture. Curr Med Imaging Rev 2007; 3: 152– 160. [DOI] [PMC free article] [PubMed] [Google Scholar]
- 27. Aoki T, Watanabe A, Nitta N, Numano T, Fukushi M, Niitsu M. Correlation between apparent diffusion coefficient and viscoelasticity of articular cartilage in a porcine model. Skeletal Radiol 2012; 41: 1087– 1092. [DOI] [PMC free article] [PubMed] [Google Scholar]
- 28. Barendregt AM, Nusman CM, Hemke R, et al. Feasibility of diffusion-weighted magnetic resonance imaging in patients with juvenile idiopathic arthritis on 1.0-T open-bore MRI. Skeletal Radiol 2015; 44: 1805– 1811. [DOI] [PMC free article] [PubMed] [Google Scholar]
- 29. Ma D, Pierre EY, Jiang Y, et al. Music-based magnetic resonance fingerprinting to improve patient comfort during MRI examinations. Magn Reson Med 2016; 75: 2303– 2314. [DOI] [PMC free article] [PubMed] [Google Scholar]
- 30. Hamilton JI, Jiang Y, Chen Y, et al. MR fingerprinting for rapid quantification of myocardial T1, T2, and proton spin density. Magn Reson Med 2017; 77: 1446– 1458. [DOI] [PMC free article] [PubMed] [Google Scholar]
- 31. Freed DE, Scheven UM, Zielinski LJ, Sen PN, Hürlimann MD. Steady-state free precession experiments and exact treatment of diffusion in a uniform gradient. J Chem Phys 2001; 115: 4249. [Google Scholar]
- 32. Jiang Y, Ma D, Wright K, Seiberlich N, Gulani V, Griswold MA. Simultaneous T1, T2, diffusion and proton density quantification with MR fingerprinting. In Proceedings of the 22th Annual Meeting of the ISMRM, Milan, Italy, 2014; 0028. [Google Scholar]
- 33. Gras V, Farrher E, Grinberg F, Shah NJ. Diffusion-weighted DESS protocol optimization for simultaneous mapping of the mean diffusivity, proton density and relaxation times at 3 Tesla. Magn Reson Med 2017; 78: 130– 141. [DOI] [PubMed] [Google Scholar]


