

Abstract
The cars we drive, the homes we live in, the restaurants we visit, and the labs and offices we work in are all a part of the modern human habitat. Remarkably, little is known about the chemistry of such environments and how our own chemistries influence the chemistry of the human habitat and vice versa. We therefore set out to visualize the chemistry of five built human habitats, or modes of transport (bicycles and car), together with their occupants, to begin providing a snapshot of the diversity of chemistries to which humans are exposed on a daily basis. The chemistry was inventoried through LC-MS and MS/MS based untargeted analyzes of samples from 100+ different locations within each human habitats and from the people that occupy those habitats. By mapping MS-derived data on a 3D models, our results revealed that the surfaces that are frequently touched, such as handles (e.g. door, foosball, bicycle), resemble the molecular fingerprint of the human skin more closely than other surfaces that are less frequently in direct contact with humans (e.g. wall, outside of a car, bicycle frame). Overall, ~50% of the environmental MS/MS spectra were shared with people, indicating that a significant transfer of chemistry takes place between us and our built environment. Molecules annotated included personal care products, plasticizers, cleaning supplies, food, food additives and even medications that were found in the environment as well as modes of transport. Mass spectrometry-based 3D molecular cartography provided a spatial insight into the distributions at the single compound level, while source tracking, using the volunteers’ data from this study as reference, highlighted the origins of the chemistry for many locations within the human habitat. It is anticipated that a thorough understanding of the distributions of chemistries may ultimately impact the design of future human habitats and transport. We also anticipate that the workflows employed here can be extended to study molecular distributions for medical, forensic, and environmental applications.
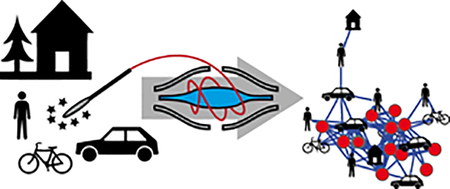
Graphical Abstract
INTRODUCTION
Humans interact, at the chemical level, with our surrounding built habitats. These habitats, in turn, influence the chemistry we find on our skin. Exposome research, a field that investigates human exposure to chemicals, has traditionally had a strong emphasis on harmful molecules.1–4 These harmful molecules include phthalates commonly used to make plastics, the disinfectant triclosan found in many sanitizers, and polybrominated phenyl ethers used as flame retardants that have been reported to affect fertility estrogen response and the nervous system.5–7 Locard’s exchange principle, coined in the 1930s, states that “every contact leaves a trace”, indicating that we influence the chemistry associated with the human habitat.8 While much emphasis has been placed on indoor air quality,9–11 an untargeted examination of the types of molecules present in human habitats and human transportation, and testing whether they originate from human interactions or from the environment, is not yet routinely performed. This has resulted in little chemical information about the human environment, preventing informed chemical decisions for the design of human-occupied buildings or transportation.
Mass spectrometry is a sensitive approach that reveals the chemical composition of a sample, and can be employed to profile the sample spatially. Spatial analysis of molecules by mass spectrometry (often referred to as imaging mass spectrometry) has become fairly common, but has been largely limited to small (0.5–5 cm) samples.12–14 Spatial resolution in the 10–100 μm range for MALDI, DESI and nanoDESI based ionizations are routine in imaging mass spectrometry,15 and resolution can be increased to 30 nm with SIMS.16 However, mass spectrometry profiling over tens of cm or even meters is needed for analyzing the human environment, the human body and human transportation.14,17–19 3D molecular cartography, a method that translates mass spectrometry features onto a 3D model of the sample that is investigated, where many samples are taken spatially, is one strategy to analyze profiling data at such large spatial scales.20 The other key challenge in analyzing the human environment is that one should expect an enormous diversity of chemistries detectable with mass spectrometry. For example, wood, metal, plastic, and soil on shoes and skin are all very different sample types, and a human environment may contain tens to hundreds of these different sample types. Each sample type will include its own set of molecules. Although many metabolomic workflows have been developed in the past few years,21–24 mostly to compare cohorts in clinical data, few tools can process and visualize the volume of data and the complexity of the different type of samples expected to be present in the human environment. Molecular networking is one such strategy, and visualizes the chemistry that is detected by mass spectrometry on a spectrum-by-spectrum basis.25 Molecular networking has now been implemented as a crowdsourced analysis infrastructure called Global Natural Product Social molecular networking (GNPS, at http://gnps.ucsd.edu).26 This infrastructure enables the visualization of MS/MS spectra, their annotation, and provides a measure of their relative similarity to produce a map of all chemicals detected in a single experiment or across a large number of experiments.
Here we take a snapshot of the chemistry we encounter in the human habitat and modes of transport. The mass spectrometry detectable chemistries are visualized with multivariate statistical analysis, as a molecular network, and by 3D molecular cartography. Finally, we assessed how well the chemistry in the built environment associated with the individuals occupying that environment.
EXPERIMENTAL SECTION
The detailed experimental procedure can be found in the supporting information of this article.
In summary, the surfaces of approximately 200 locations in five human habitats as well as body parts of human occupants and non-occupants (IRB approval number 130537X) were sampled with ethanol soaked cotton swabs and extracted in 96 well plates with 50% (v/v) ethanol/water. After non-targeted LC-MS/MS analysis, using reversed phase ultra-high performance chromatography (UHPLC) coupled to a Q-Exactive quadrupole orbital ion trap, the data was analyzed by spectra-library dereplication and molecular networking using GNPS.26 Peak areas from extracted ion chromatograms were used for relative quantification of the detected MS features and were displayed as extracted ion maps (EIM) on 3D models of the habitats and human body parts as previously described by Bouslimani et al.20 For the statistical analysis MS1 features were analyzed by principal coordinate analysis (PCoA)27 and by source tracking.28
RESULTS AND DISCUSSION
Sampling and Statistical Analysis.
We set out to assess the chemistry associated with the human habitat and modes of transport. We therefore sampled two bicycles, the environment where a social event is held weekly, a car, an apartment, a water fountain in a research building and nineteen human subjects associated with these environments. The social event environment and the water fountain were not routinely visited by any of the volunteers. However, for this study several volunteers interacted with those environments using their hands to see if molecules from the habitat could be detected on the hands afterwards in order to establish directionality of transfer of molecules between humans and their environment.
To assess the overall relationship between the chemistries, the features were extracted as m/z, retention time (RT) and intensity, then subjected to analysis in relation to “sample information” data collected for this study. For the principal coordinate analysis (PCoA), the signal intensities of the features were normalized to the total ion current, and the Bray-Curtis dissimilarity was calculated between all samples in the dataset. This measure quantifies the degree of dissimilarity between two samples based on the compositional makeup of multiple measured variables.29 Bray-Curtis is used to measure relationships between all chemical features detected within each sample and how those relationships compare to one another across the entire data set. The inferred sample relationships were visualized using PCoA plots.
The sample relationships revealed by the PCoA identified the expected separation between human and environment samples (Figure 1a), but not between male or female subjects (Figure 1b). Although most environment samples separated from human samples, several sample types from the human habitat were more similar to human samples (Figures 1a–c). Highlighting these sample types in the PCoA plot revealed that many of these were surfaces that receive significant contact with human skin, such as a guitar, bicycle handlebar, foosball table handles, and parts of a pool table (Figure 1c). This demonstrates that humans have a major impact on the chemistry of the surfaces they touch. Different human habitats and modes of transport also differ in their chemistry, particularly the car samples (Group 3, Figure 1e), and some clustering was observed by individual, indicating that person specific signatures were also detected in this data set (Figure 1f).
Figure 1: The relationships of the metabolomics data from the human habitat and the male/female volunteers as visualized using the first three principal coordinates from a Bray-Curtis dissimilarity matrix using Emperor.
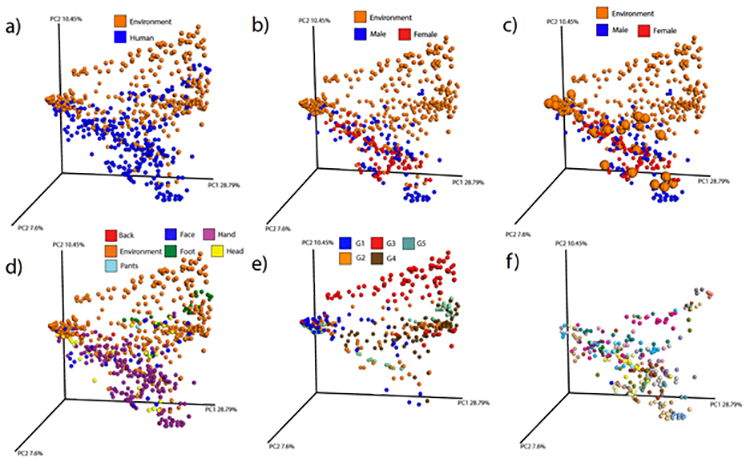
a) All data in this study highlighted by samples of human and environmental origin. b) Same PCoA, but only data from the environment and the hands of the volunteers are visualized and further colored by gender. c) Same plot as b), but samples from guitar, bicycle handle, foosball handle, and pool table enlarged to aid visualization of these sample types that have very extended interactions with human hands. d) Color resolution of samples from different human body locations. e) Environment data only, color coded by the five different human habitats sampled. f) Human data only, color-coded according to the 19 volunteers.
Molecular Networking and Annotation of Detected Molecules.
To provide molecular annotations, we then examined the data at the MS/MS level. To display the data at the MS/MS level we subjected the data to molecular networking.25 Molecular networking compares the similarity of all MS/MS spectra through spectral alignment. The relationships are then visualized as networks. In essence, in molecular networking, a spectral alignment network map of the mass spectrometry detectable chemical space is displayed as one image. In total, 1,655,109 of the 2,157,908 spectra passed filtering, (see methods). The precursor masses of ions that are included ranged from m/z 170 to 1200 (Supporting Figure 3). These formed 49,669 merged consensus spectra (nodes) and most of the unique MS/MS spectra had a mass below 400 Da (Supporting Figure 4). Rarefaction indicates that for these environments and experimental conditions, the diversity of MS/MS spectra has reached saturation (Supporting Figure 5). These molecular networks are made up 3743 molecular families and 18674 self-looped nodes that do not show spectral similarity to other MS/MS spectra within the dataset.30 Molecular families are clusters of nodes where the MS/MS spectra are very different from other MS/MS spectra. Molecular families contain MS/MS spectra of analogs of molecules with nearly identical structure (e.g. that separate by a methyl group, oxygen or a double bond), MS/MS spectra of molecules with similar substructures (e.g. glycosylations or fatty acid tails), different adducts when the fragmentation is similar and oftentimes source fragment ions are also detected within the molecular family. Indeed, most of the mass differences had mass shift of 2, 14, 16, 18, 28, 44, and 88 m/z units, consistent with mass shifts associated with oxidation, methylation, dimethylation or formylation, water addition, polymer or addition of CO2 but also mass shifts consistent with the addition of amino acids or sugars were also observed (Supporting Figure 6). Color-coding the networks based on the human habitat investigated revealed that each environment had a unique set of MS/MS spectra (and therefore unique chemistries) that were not detected in other environments, but also that more than 50% of the MS/MS spectra were shared between two or more environments. The distribution of nodes in the molecular networks among the environment samples and the people that are associated with each environment is shown in supporting Figure 7. This revealed that the largest percentage of shared MS/MS spectra (~75%) between people and habitat was found in the social gathering environment, while the least number of spectra were shared between the water fountain and the volunteers (~10%) that were a part of that habitat study.
With molecular networking, one can also add MS/MS reference libraries to provide annotations. For an annotation to be considered, we used a strict scoring scheme. The two key considerations for the annotations matching were considered. First, a minimum of 6 ions were required to match; second, the cosine score had to be greater than 0.7. With those scoring parameters, the GNPS community previously reported these parameters to provide 1% incorrect annotations, 4% insufficient information to assess if correct or not, 4% of annotations that are likely isomers or the correct annotation and 91% was deemed correctly annotated.26 In this work, the reference library consisted of about 220,000 reference spectra from the GNPS community,26 all three MassBanks (Japan http://www.massbank.jp/?lang=en, Massbank Europe http://massbank.eu/MassBank/ and North America http://mona.fiehnlab.ucdavis.edu/),31 ReSpect,32 HMDB,33 Dereplicator,34 CASMI challenge data (http://www.casmi-contest.org/2016/index.shtml),35 EMBL metabolomics library, NIST 2014 (http://www.sisweb.com/software/ms/nist.htm) and some additional reference spectra, including those sourced from companies (http://gnps.ucsd.edu/ProteoSAFe/libraries.jsp). The annotations that are obtained with precursor and MS/MS matching, as is done here, are considered level two annotations according to the 2007 metabolomics standards initiative.36 The annotations should be considered putative annotations. For all annotations obtained in GNPS and discussed in this paper, the data was manually inspected against the reference MS/MS spectrum to ensure that at least the precursor mass and MS/MS spectra were indeed correct. In these molecular networks 23.1% of the nodes were annotated, comprising a total of 37.5% of the MS/MS spectra.
The annotations give insight into the origins of some of the ions that are detected by mass spectrometry (links for all the annotations are provided in the methods section). The annotated molecules are derived from cleaning supplies (e.g. benzalkonium chloride, N-lauroyl sarcosine), medications (e.g. the antifungal terbinafine, the antibacterial erythromycin, the anthelmintic niclocide, and high potency corticosteroid, betamethasone dipropionate, used to treat inflammatory and pruritic dermatoses such as plaque psoriasis). We also observed plasticizers, plastics or polymers (e.g. tris(2-butoxyethyl) phosphate, nonaethylene glycol, decaethylene glycol, phthalates), and molecules from humans and other organisms (e.g. glycocholic acid - a bile acid, mono and di acyl-glycerols, small peptides, amino acids, and other lipids, such as hexadecenoic acid methyl ester and palmitelaidic acid, the most common fatty acid in human skin). We even detected molecules such as methylene blue, used to stain protein gels, and ketamine, used for sedation of animals, in the research environment. However, the most commonly annotated molecules, in both frequency and diversity, were used in personal care, such as ammonium glycyrrhizinate, sclareolide, dexpanthenol, cocamidopropyl betaine and the sunscreen avobenzone. In addition, there are many annotations that are associated with diet. Molecules from human food were detected including the flavonoids hesperidin, tangeritin, poncirin, nobilitin and isoquercetin that are common to citrus, epicatechin, found in chocolate, and molecules found in coffee and tea, including catechin, caffeine, astragalin, theobromine or theophylline. Especially in the social gathering environment annotations matched to miquelianin and procyanidin commonly found in wine, saponarin and xanthohumol, constituents of beer, and dihydrocapsaicin and piperine from peppers. Also detected were common food additives, such as the artificial sweeteners aspartame and sucralose, food flavoring such as 1-gamma decalactone and even food preservatives such as imazalil.
Figure 2b highlights four representative examples of molecular families with matching precursor and MS/MS spectra of known molecules. Some families have more than one annotation. For example, the cocaine molecular family has only two nodes, the parent molecule of cocaine and its ester hydrolysis product (the major form detected). This provides additional support for the annotation, while the detergent molecules collectively called cocamidopropyl-betaines, has seven annotations to different MS/MS spectra covering cocamidopropyl-betaines of the 30+ different nodes that were detected and all other nodes display related fragment ions of the same molecule but that have MS/MS spectra that are similar enough to network together but not merge by clustering as well as with different types of fatty tails (Figure 2b). Cocamidopropyl-betaines are very common and detected in almost every sample studied (Figure 2c). Indeed, cocamidopropyl-betaines are perhaps the most common surfactant used in cleaning, detergent and cosmetic supplies. Interestingly, cocaine was detected on two objects, but was not found on any of the volunteers. This molecule has also been found on 80–95% of bill currency in the US,37–40 indicating it is quite ubiquitous in the human environment.
Figure 2: The molecular networks characteristics of the entire study.
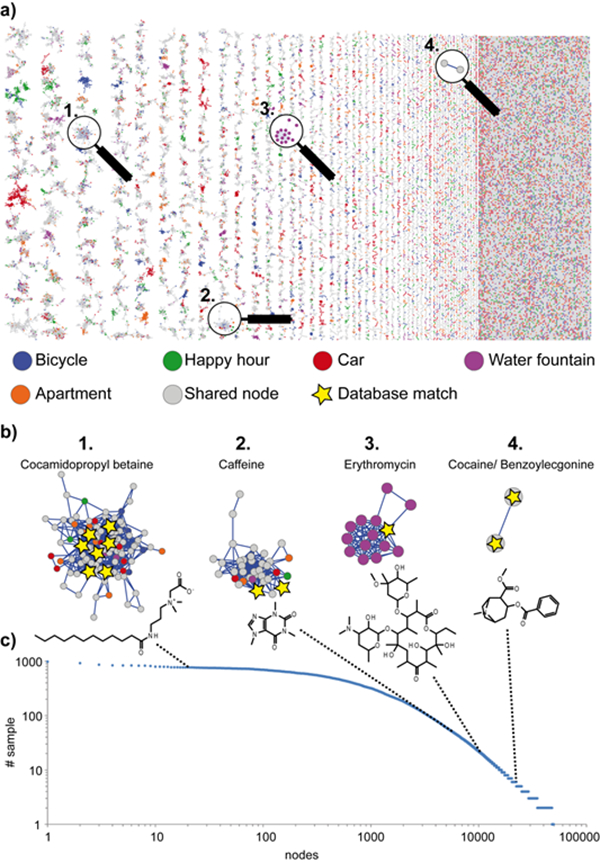
a) The molecular networks color coded by environment or mode of transport, b) a zoomed-in version of the network for four clusters where at least one of the MS/MS spectra is annotated, c) the number of samples that a specific MS/MS spectrum is shared. The figure displays the nodes vs. the number of samples a node is shared by. Node 1 is found in the data of all samples while the last nodes are only found in one sample.
Molecular 3D Cartography.
In order to investigate the spatial relevance of different chemistries, we set out to look at the distributions of the detected compounds using 3D molecular cartography. The extracted ion maps (EIM) of two bicycles (top of Figure 3) revealed the extent to which personal care products, workplace, and food related molecules are present in the daily transportation systems we us. Cocamidopropyl betaine was ubiquitous and abundant on all volunteers and both bicycles. This molecule was also found on may other volunteers and human habitats. Its ubiquity is likely due to its use in shampoos, body washes, conditioners, toothpaste and other personal care products. Dexpanthenol, another personal care product ingredient, was found in high levels on the hands of both cyclists, and in lower levels on the handlebars, the seat and the frame of one of the bicycles. This molecule is the alcohol analog of pantothenic acid (vitamin B5) and is commonly found in cosmetics. Ketamine is primarily an NMDA receptor antagonist used for induction and maintenance of anesthesia and sedation, with applications in clinical use for humans and animal research. This was detected primarily on volunteer 4’s hands and face. This volunteer works in animal research, and had recently used ketamine while conducting research. Caffeine is detected in three of the four individuals in this habitat with highest abundance on the hands but not on the bicycles. Volunteer 2 does not drink coffee or tea and avoids any sources of caffeine, explaining the absence of even trace amounts of this molecule. Caffeine is also detected on the bicycle handlebars, seat and helmet of volunteer 1, representing a molecule that is shared between this individual and their habitat. Aspartame is a non-saccharide artificial sweetener. Aspartame was found with high abundance on the hands and face of volunteer 3, and at lower abundance on volunteers 1, 2 and 4. It was not found on either bicycle or related equipment.
Figure 3: Molecular 3D cartography of the human habitats and transportation.

The extracted ion maps show the spatial abundance of different features detected. Relative ion intensities are shown as 3D heat maps through a color gradient from red (highest) to blue (lowest). The human models have enlarged body parts to enhance the visualization.
Analysis of the social gathering environment revealed how contact with food modifies the chemicals in the environment. We found a variety of molecules throughout this social gathering environment that were informative of the human-environment interaction. For example, dihydrocapsaicin is an analog of capsaicin present in chili peppers. It was only detected in one of the five microenvironments tested (bar). The likely source of this molecule was the curry that was served on the bar during the social gathering or the salsa that is commonly consumed in that location. Dexpanthenol was again detected and it was found on both humans and the environment. Because the hands of the volunteers were sampled before and then after the interaction with this habitat, one can begin to gain insight into the transfer of the detectable chemistries from the environment to people. Procyanidin B2 is a proanthocyanidin found in apples, potatoes, including chips, and other sources. It was detected in many samples from all five of the microenvironments tested, and was found on both humans and the environment. Relative to the other microenvironments, this molecule was highly enriched on the bar, the piano and the two individuals that interacted with these objects, highlighting the transfer of molecules that are present in the human habitat to people. Similarly, the feature with m/z 241.141 was found in two microenvironments sampled (the bar and the piano), but the highest signal was observed on the piano and the individual who interacted with the piano. This molecule was observed on the individual after, but not before, interaction with the piano and represents a feature transferred between the environment and individuals who interacted with it.
The feature with m/z 574.212 can be found on the EIMs of three microenvironments, but the highest intensities were found on the surface of the bar and hands of the individual who interacted with the bar.
The car environment had a unique chemical composition with respect to the other environments. This car is cleaned very thoroughly about once a month. Despite this frequent and intense cleaning, many molecules are directly shared with the person that owned the car but only in the driver seat area, floor by the gas pedals and the backseat. An intense signal of dibutyl phthalate was detected on the floor by the gas pedal. This molecule was only detected on shoes of individual 1 (the owner of the car). The feature with m/z 240.232 has no annotation in GNPS, but was mostly found in the EIMs of the face and hands of individual 1 as well as on the steering wheel and driver’s seat area. The feature with m/z 287.081 was found primarily on the upper and lower back of individual 1 as well as the driver’s seat of the car. The feature with m/z 501.209 was only found in the EIMs of individuals 2 and 3 but not in the one of the car. The distribution of the feature within the individual concentrated on the face, hands, and feet that may be consistent with a food or personal product associated molecule that is not used by volunteer one in this group.
The fourth environment, a two-bedroom apartment, revealed many lifestyle chemistries. The molecule terbinafine, an antifungal drug against dermatophyte group of fungi, is used to treat athlete’s foot. It was found in human and environmental samples; found on the right hand of person 2, on computer mouse of person 2, and on doorknob in common area. A compound with the m/z 495.830 has no hit in the GNPS library, but this compound was only found on the shoes of every test person and on the floor of the entire apartment suggesting environment to person transfer as two of the people sampled do not live in the apartment. Cocamidopropyl betaine was again found in both human and environmental samples with high abundance and ubiquitously throughout the apartment. The compound with the m/z 355.284 was not dereplicated in GNPS as a known metabolite, but was selected as a feature of interest due to its localization in the environment sampled. This feature was found only on the set of dumbbells (weight) and the doorknob in room 1 and the hands of volunteer 1, who is known to live in room 1. This illustrates a specific interaction between volunteer 1 and room 1, in which it is likely that volunteer 1 held the weights from room 1 in their hands, resulting in the transfer of metabolites between these two sampled surfaces. As mentioned above, cocaine was found on the front, back, and body of an electric guitar in room 2. Although both the electric and acoustic guitars were sampled, it was found primarily on the strings of the electric guitar, which was bought second hand. Molecular networking revealed that most of this molecule has been hydrolyzed, indicating it may have been on the object for a lengthy period of time. This may signify that cocaine can linger in environments for considerable periods of time. Benzoylecgonine is the more stable form, and is detected in drug tests.41
The final human habitat, the drinking fountain, revealed mainly food-derived and personal care product-associated molecules. Despite being a widely used molecule, cocamidopropyl betaine was found in low levels in the environment, but enriched on the hands of both human subjects. On the other hand, an MS/MS spectrum that is nearly identical to catechin flavonoid found in tea, chocolate and other foods. This was found on the lips and hands of both female and male volunteers and the walls and water fountains. 1-Palmitoyl-sn-glycero-3-phosphocholine is a component of eukaryotic lipid bilayers. It was found ubiquitously on the fountain and the walls of the fountain, but with lower intensity on human subject’s hands and mouths. Ammonium glycyrrhizinate is a licorice derivative with a sweet taste. It is a common additive to toothpaste and cosmetics. This was only found on the female subject’s mouth, and no evidence supported transfer of this molecule to the water fountain. Aspartame was found exclusively on the male subject’s tongue despite his avoidance of aspartame-containing products, and no transfer to the water fountain was detected for this molecule.
Molecular 3D cartography, as a method to analyze chemical distributions in human habitats, contributes to an understanding of how people interact with their environments at the molecular level. We can make three general observations. First, some of the molecules appear to linger for a long time in the environment. Second, it is likely the degree of interactions that matters. For example, the apartment hallway between the two doors had a similar molecular signature to the feet of the occupants of the apartment, but not to the feet of people who did not live there. Chemistry specific to the person that owned the car was present on the driver side of the car but not the passenger side. For the water fountain, our hands touch the knob but not the rest of the apparatus, reflected in the chemical signatures. In addition, the water fountains are regularly cleaned, and therefore few human-derived molecules were observed. It was interesting that Coomassie Brilliant Blue was detected in this habitat, consistent with the fact that this fountain is in a research environment containing molecular laboratories. Third, it is possible to use 3D molecular cartography to understand the nature of the chemical interactions between people and the environment. It may be possible to use chemical signatures of human habitats to pinpoint individuals who recently interacted with a specific habitat.
Methods for tracking human trace evidence on the human habitat have been developed for microbiome studies. SourceTracker, for example, was developed to trace the source of particular bacteria in a sample. This tool analyzes the presence and intensity of members of a microbial community obtained by DNA sequencing, and then compares those sequences between source and sink sample types28. Although SourceTracker has not been optimized for metabolomics, the same underlying principles apply. Therefore, we used this program to estimate proportions of metabolites in the environmental samples originating from the participants. SourceTracker describes each personal metabolomics chemical “community” as a composite of a number of “source” communities, including a component for an unknown source (which could, in this case, be people, cleaning supplies, dirt or other sources). In order to achieve this, it initially assumes an uninformative prior where all sources are considered equally likely, where the sources are represented as a Dirichlet multinomial (DM) model trained on example input communities, taking into account the variability in the input communities. A Markov Chain Monte Carlo (MCMC) procedure is then used to derive the optimal posterior probability of the components of each DM source in each sink community. For example, trained on a set of hand, mouth and stool samples as sources, SourceTracker could assign an unknown swab as a mixture of these three communities, plus “unknown”.
Applying the SourceTracker algorithm to this dataset revealed some interesting matches that link specific people to specific environmental samples. For the bicycle habitat, source tracking correctly identified that person 1 was the most likely person to have interacted more significantly with the bicycles, but incorrectly matched this person to both bicycles, possibly due to the use of similar personal care products. Person 4 matched the person’s seat with bicycle 2 (Supporting Figure 9, B), but could not match person 1 to seat 1 and the chemistry was labeled as unknown source (Supporting Figure 9, C). SourceTracker also identified much of the bicycle data as of unknown origin. The chemistry on the handlebars matched the hands of the person, but no other parts of the bicycle and therefore the chemistry on the bicycle must come from other locations of the human subject (Supporting Figure 9). In the car habitat, person 1, the owner of the vehicle, was the most likely person that interacted with this environment (Supporting Figure 9, D), but much of the chemical sources were unknown (F). Person 3, who was a passenger before the study matched to the passenger’s door and the backseat (E). For the apartment, there were only significant matches between the people that occupy the environment (G and H), and essentially no matches were obtained for the two people that were also sampled in that environment, but do not live there. The desk was correctly matched to person 1 and person 2. For the social event gathering, both the piano and the bar had similar molecules on them, and matched well with person 1 and 2 (J). The hands of person 2 had a significant match to the tap handle (K), another location where direct contact with human skin is frequent (Supporting Figure 9). The high attendance of this social bar event likely resulted in many molecules being shared among people and the environment. This is also reflected that most of the table signatures and the bar signatures matched to an unknown source (L). The source tracking for the water fountain mostly matched to one person and unknown sources, but not person 2 (M, N and O). This proof-of-principle analysis using source tracking methods designed for microbiology studies, demonstrate that it is indeed possible to track the person that contributes to the chemistry in the human habitat, as defined by Locard’s exchange principle. Future analysis method can be optimized for body part locations and their respective interactions, and may benefit from the development of metabolomics-specific models.
CONCLUSION
Here we provided insight into the diversity of chemistry present in the human habitat. The most common molecules for which we could define the origin were from personal care products and food, but the origin of the vast majority of molecules remains unidentified. People and the human habitat share significant chemistries, but each habitat has its own distinct chemical diversity. Some environmental sites have a significant chemical impact from human interactions. In fact, this shared metabolomics signature was so significant that some of the data from samples of the human habitat resembled human skin metabolomics signatures more than other samples of non-human objects. These chemical signatures, especially combined with 3D molecular cartography and source tracking, can be used to understand how molecules are transferred and migrate within the human habitat.
This study found that >75% of all high-quality spectra obtained from the human habitat to date are unannotated, revealing a significant need to better characterize chemistry of human environments. In order to gain a deep understanding of the chemistry that we are exposed to on a daily basis, we need improved capacity to annotate and to track the origin of the chemistries. Accordingly, chemical databases such as the human metabolome data bank,42 drugbank,43 food data bank (http://foodb.ca/) need to be expanded to other areas for improved analysis of our chemical environment. This must be complemented by a community-wide metabolomics analysis and knowledge capture infrastructure, with reference data sets from building materials, cleaning supplies, representative soil, food, and personal care products, as well as from humans, pets, arthropods, plants, fungi, and other organisms inhabiting the built environment, and that can be integrated with DNA sequence information. Together with proper analysis infrastructure, this significantly expanded data resource would significantly facilitate visualizing and understanding the chemistry of the human habitat. This infrastructure would also enable tracking of chemistries that we cannot yet annotate, and would not only assist architects and engineers in designing buildings, but also aid in clinical studies, forensics, military and built environment microbiome studies as well as in monitoring the health of our planet.
Supplementary Material
ACKNOWLEDGEMENTS
This project is supported in part by the Sloan foundation and the European Union’s Horizon2020 program (grant 634402). The work described in this paper was a part of a UCSD course on system wide mass spectrometry. We thank Mr. Koby Arbely and Mrs. Lingli Zhu for their help with constructing the 3D model of the apartment and Aaron W. Puri University of Washington Dept. of Chemical Engineering for participating is sample collection during his visit to UCSD. The majority of authors are faculty or students of that course. Finally, thanks to Kathleen Dorrestein for reading the manuscript prior to submission.
Footnotes
ASSOCIATED CONTENT
Supporting Information is available free of charge on the ACS Publications website.
REFERENCES
- (1).In Use of Metabolomics to Advance Research on Environmental Exposures and the Human Exposome: Workshop in Brief: Washington (DC), 2016. [PubMed]
- (2).Nieuwenhuijsen MJ Environ Health 2016, 15 Suppl 1, 38. [DOI] [PMC free article] [PubMed] [Google Scholar]
- (3).Putignani L; Dallapiccola B J Proteomics 2016, in press. doi: 10.1016/j.jprot.2016.04.033 [DOI] [PubMed] [Google Scholar]
- (4).Siroux V; Agier L; Slama R Eur Respir Rev 2016, 25, 124–129. [DOI] [PMC free article] [PubMed] [Google Scholar]
- (5).Kuriyama SN; Talsness CE; Grote K; Chahoud I Environ Health Perspect 2005, 113, 149–154. [DOI] [PMC free article] [PubMed] [Google Scholar]
- (6).Whyatt RM; Liu X; Rauh VA; Calafat AM; Just AC; Hoepner L; Diaz D; Quinn J; Adibi J; Perera FP; Factor-Litvak P Environ Health Perspect 2012, 120, 290–295. [DOI] [PMC free article] [PubMed] [Google Scholar]
- (7).Stoker TE; Gibson EK; Zorrilla LM Toxicol Sci 2010, 117, 45–53. [DOI] [PubMed] [Google Scholar]
- (8).Locard E The American journal of police science 1930, 1, 276–298. [Google Scholar]
- (9).Zhou L; Hiltscher M; Gruber D; Puttmann W Environ Sci Pollut Res Int 2016, in press. doi: 10.1007/s11356-016-6902-z [DOI] [PubMed] [Google Scholar]
- (10).Fu M; Fernandez E; Martinez-Sanchez JM; San Emeterio N; Quiros N; Sureda X; Ballbe M; Munoz G; Riccobene A; Centrich F; Salto E; Lopez MJ Environ Res 2016, 148, 421–428. [DOI] [PubMed] [Google Scholar]
- (11).Singh A; Kamal R; Mudiam MK; Gupta MK; Satyanarayana GN; Bihari V; Shukla N; Khan AH; Kesavachandran CN PLoS One 2016, 11, e0148641. [DOI] [PMC free article] [PubMed] [Google Scholar]
- (12).Tao S; Lu X; Levac N; Bateman AP; Nguyen TB; Bones DL; Nizkorodov SA; Laskin J; Laskin A; Yang X Environ Sci Technol 2014, 48, 10993–11001. [DOI] [PubMed] [Google Scholar]
- (13).Yoshimura Y; Goto-Inoue N; Moriyama T; Zaima N Food Chem 2016, 210, 200–211. [DOI] [PubMed] [Google Scholar]
- (14).Rivas D; Ginebreda A; Perez S; Quero C; Barcelo D Sci Total Environ 2016, 566-567, 27–33. [DOI] [PubMed] [Google Scholar]
- (15).Spengler B Anal Chem 2014, 87, 64–82. [DOI] [PubMed] [Google Scholar]
- (16).Touboul D; Brunelle A Bioanalysis 2016, 8, 367–369. [DOI] [PubMed] [Google Scholar]
- (17).Caprioli RM Proteomics 2016, n press. doi: 10.1002/pmic.201600133 [DOI] [Google Scholar]
- (18).Wu C; Dill AL; Eberlin LS; Cooks RG; Ifa DR Mass Spectrom Rev 2013, 32, 218–243. [DOI] [PMC free article] [PubMed] [Google Scholar]
- (19).Watrous JD; Dorrestein PC Nat Rev Microbiol 2011, 9, 683–694. [DOI] [PMC free article] [PubMed] [Google Scholar]
- (20).Bouslimani A; Porto C; Rath CM; Wang M; Guo Y; Gonzalez A; Berg-Lyon D; Ackermann G; Moeller Christensen GJ; Nakatsuji T; Zhang L; Borkowski AW; Meehan MJ; Dorrestein K; Gallo RL; Bandeira N; Knight R; Alexandrov T; Dorrestein PC Proc Natl Acad Sci U S A 2015, 112, E2120–2129. [DOI] [PMC free article] [PubMed] [Google Scholar]
- (21).Mahieu NG; Spalding JL; Patti GJ Bioinformatics 2016, 32, 268–275. [DOI] [PMC free article] [PubMed] [Google Scholar]
- (22).Gowda H; Ivanisevic J; Johnson CH; Kurczy ME; Benton HP; Rinehart D; Nguyen T; Ray J; Kuehl J; Arevalo B; Westenskow PD; Wang J; Arkin AP; Deutschbauer AM; Patti GJ; Siuzdak G Anal Chem 2014, 86, 6931–6939. [DOI] [PMC free article] [PubMed] [Google Scholar]
- (23).Grapov D; Wanichthanarak K; Fiehn O Bioinformatics 2015, 31, 2757–2760. [DOI] [PMC free article] [PubMed] [Google Scholar]
- (24).Barupal DK; Haldiya PK; Wohlgemuth G; Kind T; Kothari SL; Pinkerton KE; Fiehn O BMC Bioinformatics 2012, 13, 99. [DOI] [PMC free article] [PubMed] [Google Scholar]
- (25).Watrous J; Roach P; Alexandrov T; Heath BS; Yang JY; Kersten RD; van der Voort M; Pogliano K; Gross H; Raaijmakers JM; Moore BS; Laskin J; Bandeira N; Dorrestein PC Proc Natl Acad Sci U S A 2012, 109, E1743–1752. [DOI] [PMC free article] [PubMed] [Google Scholar]
- (26).Wang MC, Jeremy; Phelan Vanessa; Sanchez Laura; Garg Neha; Peng Yao, Nguyen Don; Watrous Jeramie; Pieter Dorrestein C.; Bandeira Nuno; et al. Nat Biotechnol 2016, accepted. [Google Scholar]
- (27).Vazquez-Baeza Y; Pirrung M; Gonzalez A; Knight R Gigascience 2013, 2, 16. [DOI] [PMC free article] [PubMed] [Google Scholar]
- (28).Knights D; Kuczynski J; Charlson ES; Zaneveld J; Mozer MC; Collman RG; Bushman FD; Knight R; Kelley ST Nat Methods 2011, 8, 761–763. [DOI] [PMC free article] [PubMed] [Google Scholar]
- (29).Faith DP; Minchin PR; Belbin L Vegetatio 1987, 69, 57–68. [Google Scholar]
- (30).Nguyen DD; Wu CH; Moree WJ; Lamsa A; Medema MH; Zhao X; Gavilan RG; Aparicio M; Atencio L; Jackson C; Ballesteros J; Sanchez J; Watrous JD; Phelan VV; van de Wiel C; Kersten RD; Mehnaz S; De Mot R; Shank EA; Charusanti P; Nagarajan H; Duggan BM; Moore BS; Bandeira N; Palsson BO; Pogliano K; Gutierrez M; Dorrestein PC Proc Natl Acad Sci U S A 2013, 110, E2611–2620. [DOI] [PMC free article] [PubMed] [Google Scholar]
- (31).Horai H; Arita M; Kanaya S; Nihei Y; Ikeda T; Suwa K; Ojima Y; Tanaka K; Tanaka S; Aoshima K; Oda Y; Kakazu Y; Kusano M; Tohge T; Matsuda F; Sawada Y; Hirai MY; Nakanishi H; Ikeda K; Akimoto N; Maoka T; Takahashi H; Ara T; Sakurai N; Suzuki H; Shibata D; Neumann S; Iida T; Funatsu K; Matsuura F; Soga T; Taguchi R; Saito K; Nishioka T J Mass Spectrom 2010, 45, 703–714. [DOI] [PubMed] [Google Scholar]
- (32).Sawada Y; Nakabayashi R; Yamada Y; Suzuki M; Sato M; Sakata A; Akiyama K; Sakurai T; Matsuda F; Aoki T Phytochemistry 2012, 82, 38–45. [DOI] [PubMed] [Google Scholar]
- (33).Forsythe IJ; Wishart DS Curr Protoc Bioinformatics 2009, Chapter 14, Unit14 18. [DOI] [PubMed] [Google Scholar]
- (34).Mohimani HG, Alexey; Mikheenko Alla; Garg Neha; Nothias Louis-Felix; Ninomiya Akihiro; Takada Kentaro; Dorrestein Pieter C.; Pevzner Pavel A. Nature Chemical biology 2016, accepted. [DOI] [PMC free article] [PubMed] [Google Scholar]
- (35).Nishioka T; Kasama T; Kinumi T; Makabe H; Matsuda F; Miura D; Miyashita M; Nakamura T; Tanaka K; Yamamoto A Mass Spectrom (Tokyo) 2014, 3, S0039. [DOI] [PMC free article] [PubMed] [Google Scholar]
- (36).Sumner LW; Amberg A; Barrett D; Beale MH; Beger R; Daykin CA; Fan TW; Fiehn O; Goodacre R; Griffin JL; Hankemeier T; Hardy N; Harnly J; Higashi R; Kopka J; Lane AN; Lindon JC; Marriott P; Nicholls AW; Reily MD; Thaden JJ; Viant MR Metabolomics 2007, 3, 211–221. [DOI] [PMC free article] [PubMed] [Google Scholar]
- (37).Jourdan TH; Veitenheimer AM; Murray CK; Wagner JR J Forensic Sci 2013, 58, 616–624. [DOI] [PubMed] [Google Scholar]
- (38).Zuo Y; Zhang K; Wu J; Rego C; Fritz J J Sep Sci 2008, 31, 2444–2450. [DOI] [PubMed] [Google Scholar]
- (39).Dixon SJ; Brereton RG; Carter JF; Sleeman R Analytica Chimica Acta 2006, 559, 54–63. [Google Scholar]
- (40).Armenta S; De la Guardia M TrAC Trends in Analytical Chemistry 2008, 27, 344–351. [Google Scholar]
- (41).Castiglioni S; Bagnati R; Melis M; Panawennage D; Chiarelli P; Fanelli R; Zuccato E Water research 2011, 45, 5141–5150. [DOI] [PubMed] [Google Scholar]
- (42).Wishart DS; Jewison T; Guo AC; Wilson M; Knox C; Liu Y; Djoumbou Y; Mandal R; Aziat F; Dong E; Bouatra S; Sinelnikov I; Arndt D; Xia J; Liu P; Yallou F; Bjorndahl T; Perez-Pineiro R; Eisner R; Allen F; Neveu V; Greiner R; Scalbert A Nucleic Acids Res 2013, 41, D801–807. [DOI] [PMC free article] [PubMed] [Google Scholar]
- (43).Wishart DS; Knox C; Guo AC; Shrivastava S; Hassanali M; Stothard P; Chang Z; Woolsey J Nucleic Acids Res 2006, 34, D668–672. [DOI] [PMC free article] [PubMed] [Google Scholar]
Associated Data
This section collects any data citations, data availability statements, or supplementary materials included in this article.