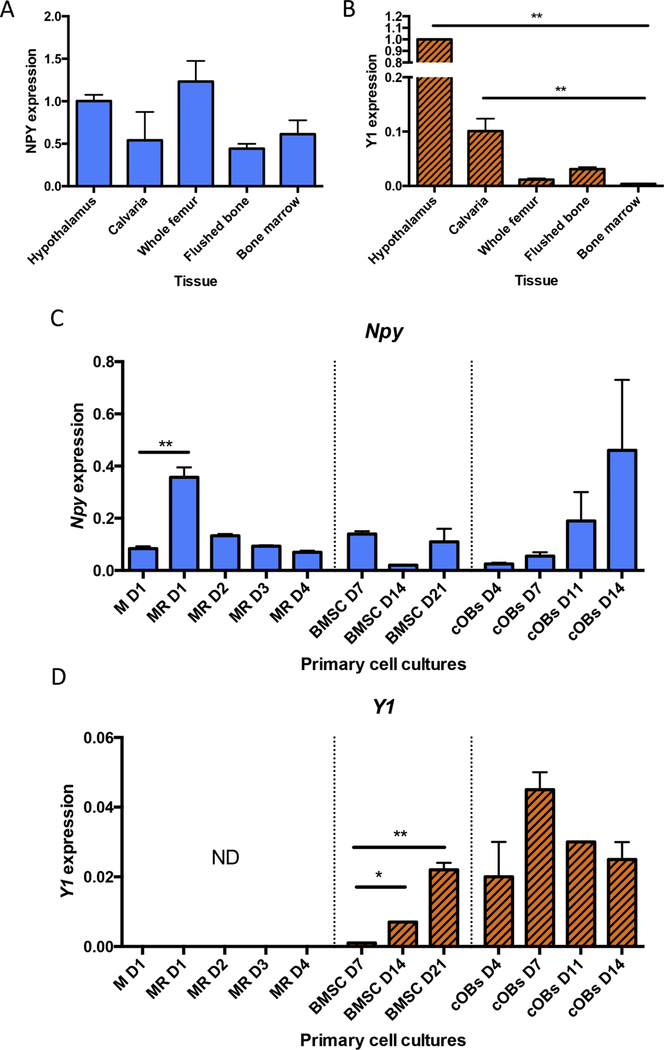
Figure 2: NPY and Y1 are locally expressed in bone tissue.
NPY (A) and Y1 expression (B) in hypothalamus and bone tissue. NPY (C) and Y1 (D) expression in primary cell cultures of bone marrow monocytes/macrophages (BMMs) stimulated with mCSF only (day 1) and in response to mCSF and RANKL stimulation (M+R; days 1–4), bone marrow stromal cells (BMSCs) undergoing differentiation (days 7, 14, 21) and calvarial osteoblasts (cOB) (day 4, 7, 11, 14). Mean±SEM. All samples were normalized to hypothalamic levels. Expression was not detectable (ND) by qPCR. Statistical analyses: one-way ANOVA, where *p<0.05 and **p<0.01. BMM cultures – n = 3; BMSC culture – n = 2; calvarial osteoblasts – n =2.

