Abstract
The upper airways play important roles in respiratory defensive reflexes. Although solitary chemosensory cells and chemosensory cell clusters have been reported in the laryngeal mucosa of mammalian species, the distribution and cellular morphology of chemosensory cells remain unclear. In the present study, the distribution and morphology of solitary chemosensory cells and chemosensory cell clusters were examined by immunofluorescence for GNAT3 on whole‐mount preparations of the rat laryngeal mucosa. Electrophysiological experiments were performed to analyze the respiratory reflexes evoked by bitter stimuli to the laryngeal cavity. In the whole area of the laryngeal mucosa, the numbers of GNAT3‐immunoreactive solitary chemosensory cells and chemosensory clusters were 421.0 ± 20.3 and 62.7 ± 6.9, respectively. GNAT3‐immunoreactive solitary chemosensory cells were mainly distributed in the mucosa overlying epiglottic and arytenoid cartilage, and chemosensory clusters were mainly distributed on the edge of the epiglottis and aryepiglottic fold. GNAT3‐immunoreactive solitary chemosensory cells were slender with elongated processes or had a flask‐like/columnar shape. The number of GNAT3‐immunoreactive cells in chemosensory clusters was 6.1 ± 0.4, ranging between 2 and 14 cells. GNAT3‐immunoreactive cells in the cluster were variform and the tips of apical processes gathered at one point at the surface of the epithelium. The tips of apical cytoplasmic processes in solitary chemosensory cells and cells in the cluster were immunoreactive for espin, and faced the laryngeal cavity. Physiological experiments showed that the application of 10 mm quinine hydrochloride to the laryngeal cavity decreased respiratory frequency. The present results revealed the chemosensory field of the larynx and the morphological characteristics of the laryngeal chemosensory system for respiratory depression.
Keywords: chemosensory cells, GNAT3, immunohistochemistry, larynx, respiratory depression
Introduction
Various sensory receptors for mechanical and chemical stimuli have been reported to play roles in protective reflexes in the airways of various mammalian species, including rats (for reviews, see Sant'Ambrogio et al. 1995; Widdicombe, 2001; Lee & Yu, 2014). Chemosensory cells are widely distributed from the nasal cavity to the trachea; solitary sensory cells in the nasal cavity and larynx as well as the trachea (for reviews, see Krasteva & Kummer, 2012; Tizzano & Finger, 2013), and taste bud‐like chemosensory cell clusters in the pharynx and larynx (Idé & Munger, 1980; Travers & Nicklas, 1990; Sweazey et al. 1994; Nishijima & Atoji, 2004; Sbarbati et al. 2004b). A previous study reported that airway chemosensory cells express one of the taste receptors, Tas1R3 (Tizzano et al. 2011). They also contain taste transduction molecules, such as GNAT3 (α‐gustducin), phospholipase C, β2‐subunit (PLCβ), inositol 1,4,5‐trisphosphate receptor type 3 (IP3R3), and TRPM5 (Finger et al. 2003; Sbarbati et al. 2004a,b; Merigo et al. 2005; Tizzano et al. 2011). Functionally, chemosensory cells in the nasal mucosa treated with denatonium benzoate, a bitter stimulant, were found to have elevated intracellular calcium ion concentrations (Gulbransen et al. 2008). When the nasal mucosa of rats was perfused with saline containing bitter stimulants, i.e. denatonium benzoate, quinine hydrochloride (QHCl), and cycloheximide, the activity of the trigeminal nerve increased and apnea was induced (Finger et al. 2003). Additionally, quorum‐sensing molecules also stimulate nasal chemosensory cells (Tizzano et al. 2010). Therefore, chemosensory cells in the airways are a sensory structure for the respiratory defensive reflexes causing respiratory depression or apnea.
Sbarbati et al. (2004a) reported that solitary chemosensory cells were distributed at the base of the aryepiglottic fold and interarytenoidal region in the larynx. Chemosensory cell clusters are also distributed on the laryngeal surface of the epiglottis and aryepiglottic fold. Solitary chemosensory cells in the laryngeal mucosa are generally ‘flask‐shaped’ or ‘bipolar’ with apical cytoplasmic processes (Sbarbati et al. 2004a; Merigo et al. 2005; Takahashi et al. 2016). However, the distribution and morphology of laryngeal solitary chemosensory cells has not been reported in detail because previous findings were based on thin histological sections. Chemosensory cell clusters in the laryngeal mucosa were lower in height and smaller in diameter, but resembled lingual taste buds (Sbarbati et al. 2004b). Furthermore, the basal processes of chemosensory cells in these clusters are poorly developed (Sbarbati et al. 2004b). Similar to solitary chemosensory cells, the distribution and morphology of chemosensory cell clusters has not yet been examined in detail. The larynx may be an important sensory structure for respiratory defensive reflexes to avoid aspiration pneumonitis, as suggested by Bradley (2000). Thus, information on the morphological basis of laryngeal chemosensory function will contribute to a better understanding of laryngeal function in respiratory reflexes.
In the present study, the distribution and morphology of solitary chemosensory cells and chemosensory cell clusters in the laryngeal mucosa were examined using whole‐mount preparations with GNAT3 immunoreactivity. We also investigated respiratory reflexes evoked by the bitter stimulant QHCl, applied to the laryngeal cavity in electrophysiological experiments.
Materials and methods
Animal procedure
All procedures for animal handling were performed in accordance with the guidelines of the local Animal Ethics Committee of Iwate University (accession number: A201610). Male Wistar rats (8–10 weeks old; n = 18) were purchased from Japan SLC, Inc. (Slc: Wistar, Japan SLC, Hamamatsu, Japan).
Immunohistochemistry
Details of the antibodies used in the present study and their combinations are shown in Tables 1 and 2, respectively.
Table 1.
Primary and secondary antibodies used in the present study
| No. | Antibody against | Antigen | Manufacturer; host; catalog number; RRID | Dilution | Function; Immunohistochemical marker for |
|---|---|---|---|---|---|
| Primary antibodies | |||||
| 1 | GNAT3 | Synthetic peptide (KNQFLDLNLKKEDKE), 304–318 amino acid sequence of human GNAT3 | Abcam (Cambridge, UK); goat; ab113664; AB_10866449 | 1,2,000 | Taste signaling protein; Chemosensory cells |
| 2 | Synaptosomal‐associated protein 25 kD (SNAP25) | Crude human synaptic immunoprecipitated (Characterized by Honer et al. 1993) | Bio‐Rad (Hercules, CA, USA); mouse (monoclonal); MCA1308; AB_322417 | 1:2,000 | SNARE protein; Neuroendocrine cells and certain nerve fibers |
| 3 | Espin | Recombinant protein (SMPAWRRDLLRKKLEEEREQKRKEEERQKQEELRREKEQSEKLRTLGYDESKLAPWQRQVILKK), 123–182 amino acid sequence of human espin | Novus Biologicals (Littleton, CO, USA); rabbit; NBP1‐90588; AB_11015490 | 1:100 | Actin‐binding protein; Certain microvilli |
| 4 | P2X3 ATP receptor (P2X3) | Synthetic peptide (VEKQSTDGAYSIGH),383–397 amino acid sequence of rat P2X3 | Neuromics (Edina, MN, USA); rabbit; RA10109; AB_2157930 | 1:4,000 | Ionotropic ATP receptor; Certain sensory nerves |
| Secondary antibodies | |||||
| a | Alexa Fluor 488‐labeled anti‐goat IgG | Jackson ImmunoResearch (West Grove, PA, USA); donkey; 705‐545‐147; AB_2336933 | 1:200 | ||
| b | Alexa Fluor 488‐labeled anti‐rabbit IgG | Jackson ImmunoResearch (West Grove, PA, USA); donkey; 711‐545‐152; AB_2313584 | 1:200 | ||
| c | Cy3‐labeled anti‐mouse IgG | Jackson ImmunoResearch (West Grove, PA, USA); donkey; 715‐165‐151; AB_2315777 | 1:100 | ||
| d | Cy3‐labeled anti‐rabbit IgG | Jackson ImmunoResearch (West Grove, PA, USA); donkey; 711‐165‐152; AB_2307443 | 1:100 | ||
| e | Cy3‐labeled anti‐goat IgG | Jackson ImmunoResearch (West Grove, PA, USA); donkey; 705‐165‐147; AB_2307351 | 1:100 | ||
| f | Alexa Fluor 647‐labeled anti‐mouse IgG | Jackson ImmunoResearch (West Grove, PA, USA); donkey; 715‐605‐150; AB_2340862 | 1:100 | ||
The antibody numbers and symbols in this table are also used in Table 2.
Table 2.
Combinations of antibodies for immunofluorescence
| Combination | Primary antibody 1 | Secondary antibody 1 | Primary antibody 2 | Secondary antibody 2 | Primary antibody 3 | Secondary antibody 3 | |
|---|---|---|---|---|---|---|---|
| GNAT3 | 1 | a | – | – | – | – | Figs 3A‐C, 4B‐F, 5, 6A‐C |
| GNAT3/SNAP25 | 1 | a | 2 | c | – | – | Figs 4Aa, 6D,E |
| GNAT3/Espin | 1 | a | 3 | d | – | – | Fig 7 |
| GNAT3/P2X3 | 1 | a | 4 | d | – | – | Fig. 8A‐E |
| GNAT3/P2X3/SNAP25 | 1 | e | 4 | b | 2 | f | Fig. 8F‐H |
Regarding whole‐mount preparations, rats (n = 6) were euthanized by exsanguination from the abdominal aorta under deep anesthesia by an intraperitoneal pentobarbital injection (150 mg kg−1). Larynges were dissected out, opened at the dorsal midline with fine scissors, and pinned on a silicone board. Preparations were fixed with 4% paraformaldehyde in 0.1 m phosphate buffer (PB; pH 7.4) at 4 °C for 12–18 h. After washing with phosphate‐buffered saline (PBS; pH 7.4), laryngeal cartilage and muscles were removed using fine tweezers under a binocular dissecting microscope to obtain a preparation of the laryngeal mucosa. Whole‐mount preparations were incubated with primary antibodies at 4 °C for at least three nights. They were then incubated with secondary antibodies at room temperature for 3 h, followed by an incubation with DAPI solution (1 μg mL−1, Dojindo, Kumamoto, Japan). Preparations were mounted on glass slides and coverslipped with aqueous mounting medium (Fluoromount, Diagnostic Biosystems, Pleasanton, CA, USA).
Regarding cryostat sections, rats (n = 6) were anesthetized by an intraperitoneal injection of pentobarbital (150 mg kg−1), and transcardially perfused with Ringer's solution (300 mL) followed by 4% paraformaldehyde in 0.1 m PB (pH 7.4; 300 mL). Larynges were dissected out and further fixed at 4 °C for 12–18 h. Tissues were soaked in PBS containing 30% sucrose and frozen at −80 °C with compound medium (Tissue‐Tek O.C.T. compound, Sakura Finetech, Tokyo, Japan), and were then serially sectioned in transversal planes at a thickness of 30 μm from cricoid cartilage to the tip of the epiglottis. These sections were mounted on glass slides coated with chrome‐alum gelatin and dried. After being incubated with normal donkey serum (1 : 50) at room temperature for 30 min, sections were then incubated with the primary antibody at 4 °C for 12 h. Sections were subsequently incubated with secondary antibodies at room temperature for 90 min after rinsing with PBS. Preparations were then incubated with DAPI solution for nuclear staining. Sections were coverslipped with aqueous mounting medium.
Observations
Preparations were examined with a confocal scanning laser microscope (C1, Nikon, Tokyo, Japan). Images of Alexa488, Cy3, and DAPI were captured and colored using computer software (NIS‐Elements, Nikon). Projection images were made from z‐stacks of confocal images (10–40 series at 0.5‐ to 1‐μm intervals) using the same software. Other images were reconstructed to a three‐dimensional view from intact confocal images of z‐stack series (Fig 8G,H) or binary images converted from the original (Figs 5A‐2, 5B‐2, 5C‐3, 6D‐3, 6D‐4, 6E‐3, 6E‐4 and 8B,E). Digital section views (Figs 6D‐2, 6E‐2, 7C‐2, 7D‐2 and 8F‐2) and lateral projection views (Fig. 7A‐2,B‐2) were also taken.
Figure 8.
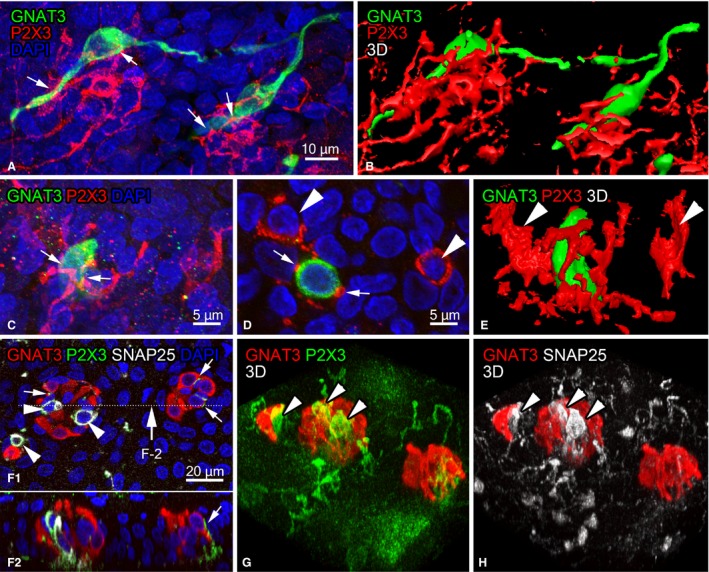
P2X3‐immunoreactive nerve endings around GNAT3‐immunoreactive solitary chemosensory cells (A‐E) and chemosensory clusters (F‐H). (A,B) Projection view and three‐dimensional reconstruction view of P2X3‐immunoreactive nerve endings (red) around GNAT‐immunoreactive cells with lateral processes (green) in the epiglottis. P2X3‐immunoreactive nerve endings contact with GNAT3‐immunoreactive cells at the arrows in (A). (C‐E) P2X3‐immunoreactive nerve endings (red) around columnar GNAT3‐immunoreactive cells (green) in the vocal process. (C) Projection view, (D) one plane from a z‐stack, and (E) three‐dimensional reconstruction view, respectively. Arrows in (C,D) indicate P2X3‐immunoreactive nerve endings in contact with GNAT3‐immunoreactive cells. Arrowheads in (D,E) are P2X3‐immunoreactive nerve endings surrounding cells negative for GNAT3. (F‐H) P2X3‐immunoreactive nerve endings (green) within cell clusters containing GNAT3‐immunoreactive chemosensory cells (red) and SNAP25‐immunoreactive diffuse neuroendocrine cells (white). (F‐1) Projection view of z stacks. (F‐2) Sectional view at the line indicated in (F‐2). (G,H) Three‐dimensional views of (F) showing GNAT3‐immunoreactive cells and P2X3‐immunoreactive nerve endings (G), and GNAT3‐ and SNAP25‐immunoreactive cells (H). Small arrows in (F) indicate P2X3‐immunoreactive nerve endings in contact with GNAT3‐immunoreactive cells. Arrowheads in (F‐H) show the terminals of P2X3‐immunoreactive nerve endings thoroughly surrounding some SNAP25‐immunoreactive cells.
Morphometry
Three of six whole‐mount preparations were used in the analysis of the densities of solitary chemosensory cells and chemosensory cell clusters. Since the remaining three preparations were partly damaged by handling for staining, they were excluded from morphometrical analyses. Whole‐mount preparations with GNAT3 immunofluorescence were photographed with an epifluorescent microscope (Eclipse 80i, Nikon, Tokyo, Japan) using a ×20 objective lens. Photographs were merged into one figure using computer software (photoshop CS5) and the total area of the laryngeal mucosa was measured using imagej software (https://imagej.nih.gov/ij/). Solitary chemosensory cells and chemosensory cell clusters were then plotted on the merged figure and counted, and their densities were calculated. The densities of these structures were also measured. The areas for counting were selected based on three line segments, as shown in Fig. 1: (1) the line segment from the tip of the epiglottis to the base of epiglottic cartilage at the midline, (2) the line segment from the tip of the epiglottis to the tip of the corniculate process, (3) the line segment from the tip of the corniculate process to the ventral edge of the vocal process (Fig. 1). The definitions of each area are shown in Fig. 1 and were as follows: (1) the edge of the epiglottis, 1 × 0.5‐mm rectangles at the first quartile point of line 2 at both sides; (2) laryngeal surface of the epiglottis, 1 × 1 mm square from the midpoint of line 1; (3) aryepiglottic fold, 0.5 × 0.5 mm rectangles from the third quartile point of line 2 at both sides; (4) the tip of the corniculate process of arytenoid cartilage, 0.5 × 1‐mm rectangles from the start point of line 3 at both sides; (5) the base of the corniculate process, 0.5 × 1‐mm rectangles at the midpoint of line 3 at both sides; 6) the vocal process of arytenoid cartilage, 1 × 0.5 mm rectangles at the endpoint of line 3 at both sides. The densities of solitary chemosensory cells and chemosensory clusters in each area were statistically analyzed by the Kruskal–Wallis test.
Figure 1.
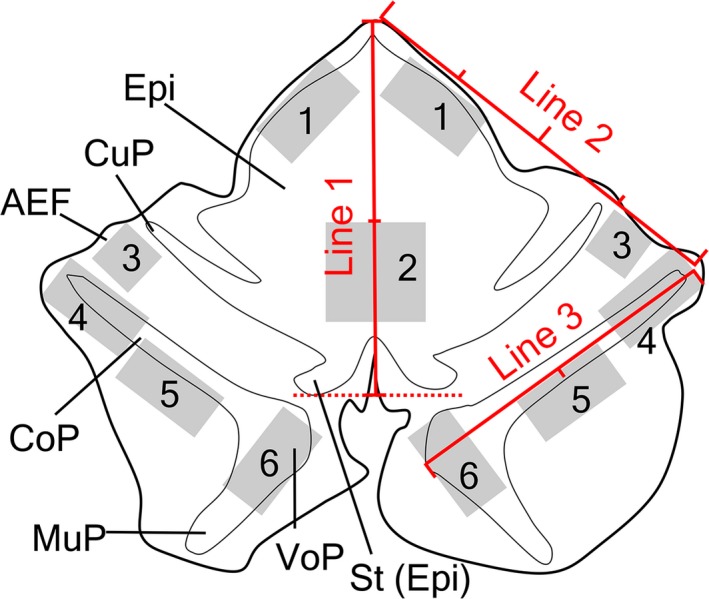
Areas subjected to a morphometric analysis. 1, Edge of the epiglottis; 2, laryngeal surface of the epiglottis; 3, aryepiglottic fold; 4, tip of the corniculate process of arytenoid cartilage; 5, base of the corniculate process; 6, vocal process of arytenoid cartilage. AEF, aryepiglottic fold; CoP, corniculate process of arytenoid cartilage; CuP, cuneiform process of epiglottic cartilage; Epi, epiglottis; MuP, muscular process of arytenoid cartilage; St, stalk of epiglottic cartilage; VoP, vocal process of arytenoid cartilage. Details are described in Materials and methods.
Electrophysiology
Three rats were used to record the respiratory reflexes evoked by the application of QHCl to the laryngeal cavity (Fig. 2). Rats (n = 6) were anesthetized by an intraperitoneal injection of urethane (1.0 g kg−1 bodyweight). The midline of the neck was incised to expose the larynx and trachea. In three of six rats, the superior laryngeal nerve (SLN) on both sides was severed near the larynx. A polyethylene cannula was inserted into the trachea to secure tracheal breathing. The cannula was connected to a respiratory flow head (MLA1L, AD Instruments, Dunedin, New Zealand) attached to a spirometer pod (ML311, AD Instruments) to detect airflow changes associated with respiration. A concentric electrode (NM‐320T, Nihon Koden, Tokyo, Japan) was set to the diaphragm from the right intercostal space, and connected to a bioamplifier (MEG‐5100, Nihon Koden) to record electromyograms. Regarding the stimulation, two cannulas connected to Tygon tubes (inner diameter of 0.89 mm) were inserted into a small incision in thyroid cartilage to reach the base of the epiglottis (inlet) and into an incision in cricoid cartilage to reach the subglottis (outlet). Hepes‐Ringer solution (pH 7.3) with or without 10 mm QHCl was perfused from the inlet to outlet for 30 s at 1 mL min−1 by infusion pumps (Masterflex 77120‐42, Cole‐Parmer, Chicago, IL, USA). The spirometer pod and bioamplifier were connected to an analog‐to‐digital converter (PowerLab, PL3504, AD Instruments), and respiratory flow changes and an electromyogram of the diaphragm were recorded on a computer using labchart 7 (AD Instruments). Time‐dependent changes in respiratory frequencies were calculated from airflow waves on the same software. In intact and SLN‐severed rats, the mean respiratory frequency was calculated for three experimental periods: (1) the control period 30 s before perfusion, (2) the perfusion period during perfusion for 30 s, and (3) the post‐perfusion period 30 s after perfusion. Values were statistically analyzed using a correlated t‐test.
Figure 2.
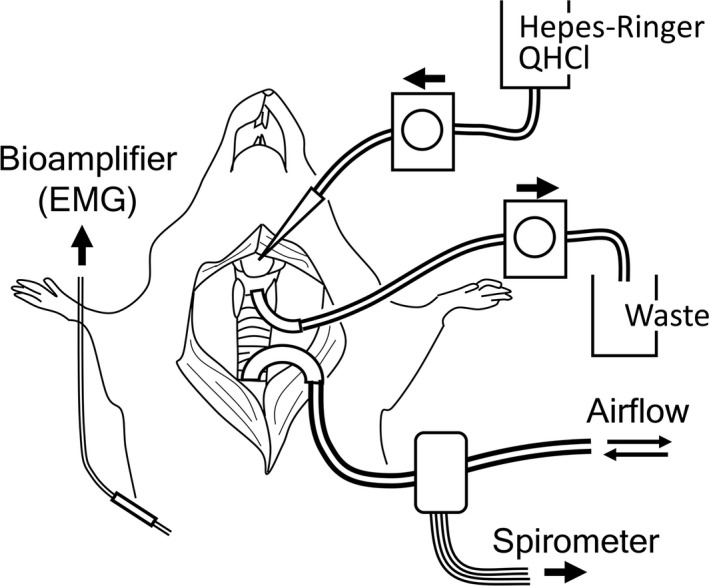
Schematic drawing of physiological experiments. Details are described in Materials and methods.
Results
Distribution of solitary chemosensory cells and chemosensory cell clusters
In whole‐mount preparations with immunofluorescence for GNAT3, variform solitary chemosensory cells and chemosensory clusters were detected in the laryngeal mucosa (Fig. 1). In the epiglottis, slender GNAT3‐immunoreactive cells with elongated cytoplasmic processes in a lateral direction were distributed on the laryngeal surface (Fig. 3A), and chemosensory cell clusters existed at the edge of the epiglottis. In the mucosa covering the arytenoid cartilage, GNAT3‐immunoreactive solitary chemosensory cells were flask‐like or columnar in shape, with short lateral processes in addition to slender cells (Fig. 3B). Numerous chemosensory cell clusters with GNAT3 immunoreactivity and few solitary chemosensory cells were observed in the aryepiglottic fold (Fig. 3C). In the whole area of the laryngeal mucosa, the numbers of GNAT3‐immunoreactive solitary chemosensory cells and chemosensory clusters were 421.0 ± 20.3 and 62.7 ± 6.9, respectively (n = 3). GNAT3‐immunoreactive solitary chemosensory cells were mainly distributed in the mucosa overlying epiglottic and arytenoid cartilage, whereas chemosensory clusters were mainly distributed at the edge of the epiglottis and aryepiglottic fold (Fig. 3D), and were not found in the mucosa of the vocal folds. The densities of chemosensory cells differed among regions (Fig. 3E, Table 3; Kruskal–Wallis test, P < 0.05). Densities in the laryngeal surface of the epiglottis, the base of the corniculate process, and the vocal process of the arytenoid cartilage were higher than in other parts. The density of chemosensory clusters also differed among regions (Fig. 3F, Table 3; Kruskal–Wallis test, P < 0.05). Regions containing a small number of chemosensory cells showed a higher density of chemosensory clusters. Higher chemosensory cluster densities were noted at the edge of the epiglottis, the aryepiglottic fold, and the tip of corniculate process of arytenoid cartilage.
Figure 3.
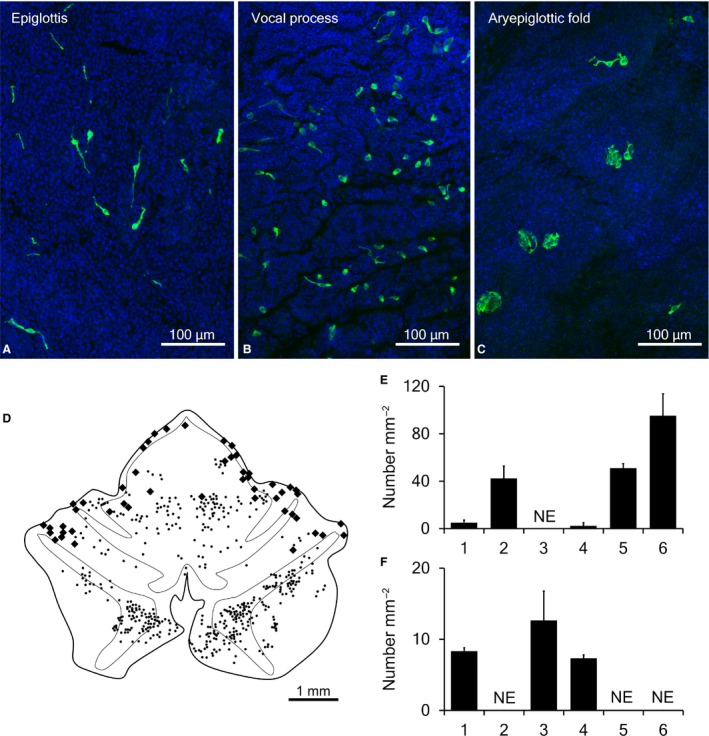
Distribution of GNAT3‐immunoreactive cells. Low magnification views showed slender solitary chemosensory cells with lateral elongated processes, flask‐like cells, and chemosensory cell clusters in the epiglottis (A), vocal process (B), and aryepiglottic fold (C). (A‐C) The nuclei of epithelial cells are labeled by DAPI. (D) Distribution of solitary chemosensory cells (small dots) and chemosensory cell clusters (large dots) in a whole‐mount preparation of the laryngeal mucosa. (E,F) Number of GNAT3‐immunoreactive solitary chemosensory cells (E) and chemosensory cell clusters (F) in each area of the laryngeal mucosa. 1, Edge of the epiglottis; 2, laryngeal surface of the epiglottis; 3, aryepiglottic fold; 4, tip of the corniculate process of arytenoid cartilage; 5, base of the corniculate process; 6, vocal process of arytenoid cartilage. Area numbers are indicated in Fig. 1. NE, Structures were not examined.
Table 3.
Number and density of solitary chemosensory cells and chemosensory cell clusters with GNAT3 immunoreactivity in whole‐mount preparations of the rat laryngeal mucosa
| Animal number | Total number | Density (number mm2)a | |||||
|---|---|---|---|---|---|---|---|
| 1 | 2 | 3 | 4 | 5 | 6 | ||
| Solitary chemosensory cellsb | |||||||
| 1 | 407 | 2 | 57 | ND | ND | 55 | 70 |
| 2 | 395 | 7 | 35 | ND | 1 | 46 | 113 |
| 3 | 461 | 6 | 35 | ND | 6 | 52 | 103 |
| Average ± SE | 421.0 ± 20.3 | 5.0 ± 1.5 | 42.3 ± 7.3 | – | 2.3 ± 1.9 | 51.0 ± 2.6 | 95.3 ± 13.0 |
| Chemosensory cell clustersb | |||||||
| 1 | 68 | 8 | ND | 12 | 7 | ND | ND |
| 2 | 71 | 8 | ND | 18 | 7 | ND | ND |
| 3 | 49 | 9 | ND | 8 | 8 | ND | ND |
| Average ± SE | 62.7 ± 6.9 | 8.3 ± 0.3 | – | 12.7 ± 2.9 | 7.3 ± 0.3 | – | – |
Numbers are different areas in the laryngeal mucosa as indicated in Fig. 1.
Kruskal–Wallis test, P < 0.05. ND, Not detected. 1, Edge of the epiglottis; 2, laryngeal surface of the epiglottis; 3, aryepiglottic fold; 4, tip of the corniculate process of arytenoid cartilage; 5, base of the corniculate process; 6, vocal process of arytenoid cartilage.
Solitary chemosensory cells
The morphology of GNAT3‐immunoreactive cells was clearly visible in confocal laser microscopic views of whole‐mount preparations. Slender GNAT3‐immunoreactive cells were observed in the stratified cuboidal epithelium in the epiglottis (Fig. 4A,B). These slender cells appeared in the spherical perinuclear region with elongated processes in a lateral direction. Elongated processes were located in the basal part of the epithelial layer, were 50–100 μm in length, and were sometimes branched. These cells generally had small apical cytoplasmic processes facing the larynx (Fig. 4B). In the pseudostratified epithelium overlying arytenoid cartilage, GNAT3‐immunoreactive chemosensory cells were flask‐like or columnar in shape without lateral cytoplasmic processes (Fig. 4C,D). In rare cases, GNAT3‐immunoreactive cells with multiple thin lateral processes were observed, as shown in Fig. 4E,F. Furthermore, three‐dimensional views from z‐stacks showed GNAT3‐immunoreactive solitary chemosensory cells with various morphologies (Fig. 5). In some solitary chemosensory cells with GNAT3 immunoreactivity, apical processes arose from lateral cytoplasmic processes (Fig. 5A). In Fig. 5B, apical cytoplasmic processes lay in small swellings connected to lateral processes. Occasionally, two apical processes were derived from a single cell (Fig. 5C).
Figure 4.
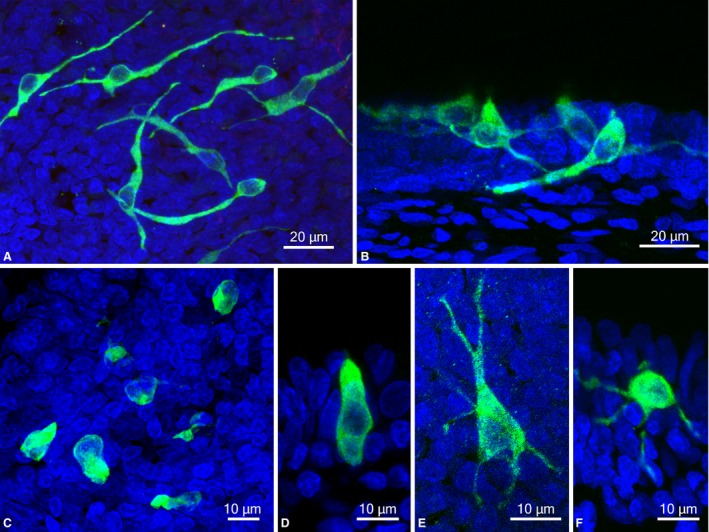
Morphology of GNAT3‐immunoreactive cells in the laryngeal mucosa. (A,B) Slender GNAT3‐immunoreactive cells with elongated lateral processes in the epiglottis. (C,D) Flask‐like or columnar GNAT3‐immunoreactive cells in the mucosa overlying the vocal process of arytenoid cartilage. (E,F) GNAT3‐immunoreactive cells with multiple thin processes in the epiglottis. (A,C,E) Projection view of maximum intensity from z stacks of whole‐mount preparations. (B,D,F) Projection view from z stacks of cryostat sections. Nuclei are labeled by DAPI.
Figure 5.
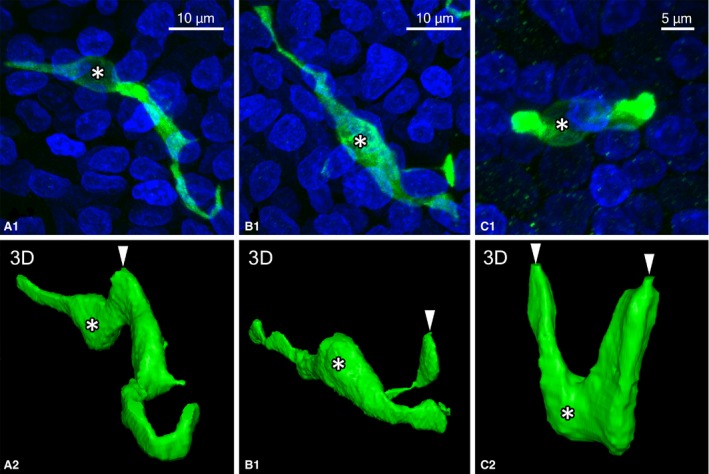
Examples of rarely observed cells with GNAT3 immunoreactivity. (A) Apical processes (arrowhead) were observed in the lateral cytoplasmic processes of GNAT3‐immunoreactive cells in the epiglottis. (B) Apical cytoplasmic processes (arrowhead) were derived from small swellings of GNAT3‐immunoreactive cells in the epiglottis. (C) Two apical processes (arrowheads) facing the laryngeal cavity were derived from GNAT3‐immunoreactive cells in the vocal process. (A‐1,B‐1,C‐1) Projection views of z‐stack images. Nuclei were stained by DAPI. (A‐2,B‐2,C‐2) Three‐dimensional views reconstructed from binary images of (A‐1), (B‐1), and (C‐1), respectively. Asterisks show regions of the nuclei of GNAT3‐immunoreactive cells.
Chemosensory cell clusters
Chemosensory cell clusters were mainly observed at the edge of the epiglottis and aryepiglottic mucosa and were of various sizes (Fig. 6A–C). The numbers of GNAT3‐immunoreactive cells in the clusters were 5.6 ± 0.8, 6.3 ± 0.8, and 6.6 ± 0.7 in the epiglottis, aryepiglottic fold, and arytenoid region, respectively (total, 6.1 ± 0.4). Cell numbers in the clusters did not significantly differ among regions (Kruskal–Wallis test; P > 0.05) and ranged between 2 and 14 cells. Three‐dimensional views from z‐stacks of whole‐mount preparations revealed variform GNAT3‐immunoreactive cells in the cluster. In Fig. 6D, flattened or coiled cytoplasmic processes arose from the perinuclear region of two GNAT3‐immunoreactive cells and surrounded SNAP25‐immunoreactive cells in the small cluster that consisted of two GNAT3‐immunoreactive cells and one SNAP25‐immunoreactive cell. The apical tips of cytoplasmic processes gathered at one point of the surface of the epithelium. In the larger cluster shown in Fig. 6E, variform GNAT3‐immunoreactive cells were clustered with SNAP25‐immunoreactive cells, similar to smaller clusters. The shapes of the cytoplasmic processes of individual cells were variform, and the tips of apical processes gathered at one point at the surface of the epithelium. Certain nerve fibers were also immunoreactive to SNAP25 around and within the chemosensory cell clusters (Fig. 6D,E).
Figure 6.
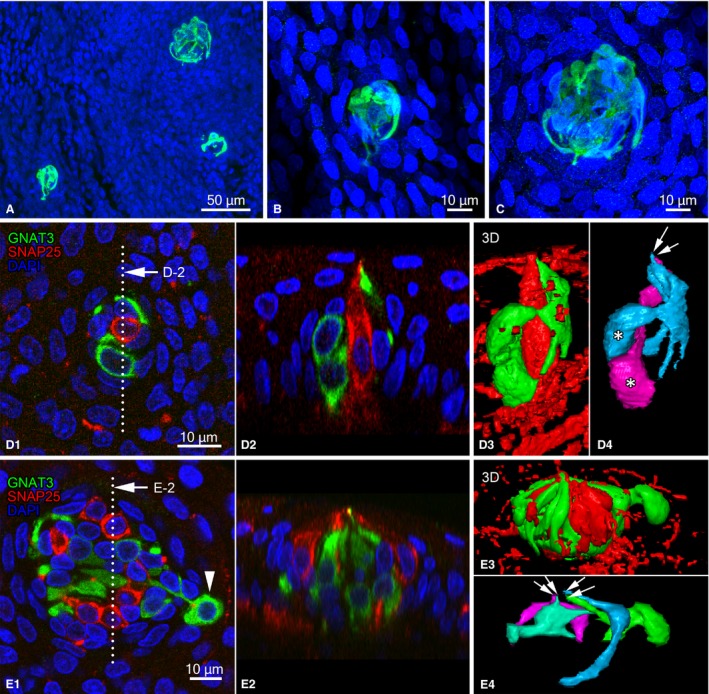
Morphology of clusters of chemosensory cells in the laryngeal mucosa. (A‐C) Clusters containing GNAT3‐immunoreactive cells in the epiglottis. (B,C) Enlarged views of (A). Clusters in (B) and (C) contained 5 and 11 GNAT3‐immunoreactive cells, respectively. (D) Small chemosensory cluster in the epiglottis. Cluster containing two GNAT3‐immunoreactive cells (green) and one SNAP25‐immunoreactive cell (red). (D‐1) Projection view from the laryngeal cavity and (D‐2) sectional view at the dotted line indicated in (D‐1). (D‐3,D‐4) Three‐dimensional reconstruction views from a binary image of panel (D‐1) showing GNAT3‐immunoreactive‐ and SNAP25‐immunoreactive cells (D‐3) and only GNAT3‐immunoreactive cells (D‐4), respectively. (D‐4) Two GNAT3‐immunoreactive cells are shown in different colors. (E) A cluster containing 12 GNAT3‐immunoreactive cells (green) and 7 SNAP25‐immunoreactive cells (red). (E‐1) Projection view and (E‐2) digitalized sectional view at the line indicated in (E‐1). (E‐3, E‐4) Three‐dimensional reconstruction views of panel (E‐1) showing GNAT3‐immunoreactive‐ and SNAP25‐immunoreactive cells (E‐3) and only 4 of 12 GNAT3‐immunoreactive cells (E‐4), respectively. Apical tips of GNAT3‐immunoreactive cells gathered in the laryngeal lumen (arrows in E‐4). SNAP25‐immunoreactive nerve fibers are also visible in (D3) and (E3). DAPI‐labeled nuclei are shown in (A‐C) and (F‐H).
Double immunofluorescence for GNAT3 and espin
The tips of apical cytoplasmic processes were immunoreactive to espin in slender and columnar GNAT3‐immunoreactive solitary chemosensory cells, indicating the existence of espin‐immunoreactive microvilli in the luminal surface (Fig. 7A,B). Espin immunoreactivity was also found in all apical cytoplasmic processes of GNAT3‐immunoreactive cells in chemosensory cell clusters, and these apical processes gathered at one spot at the surface of the laryngeal epithelium (Fig. 7C,D). The apical surface of brush cells without GNAT3 immunoreactivity was also immunoreactive for espin, as reported previously (Fig. 7B; Yamamoto et al. 2018).
Figure 7.
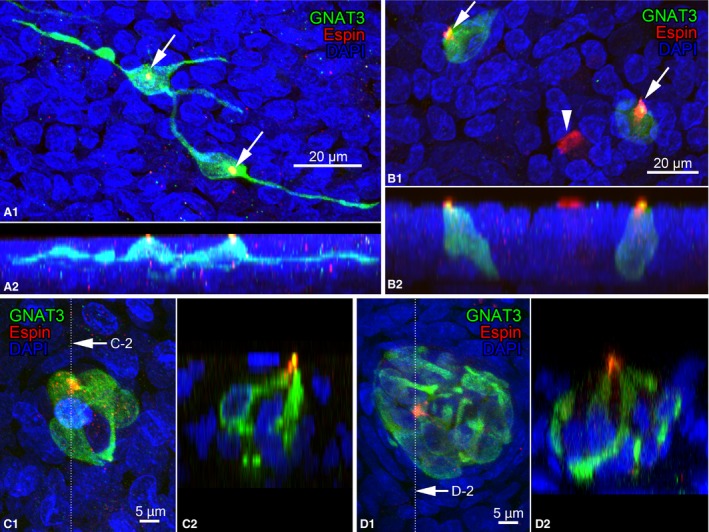
Double immunofluorescence for GNAT3 and espin. (A,B) Espin immunoreactivity is shown at the tips of the apical cytoplasmic processes (arrows; red) of GNAT3‐immunoreractive slender cells in the epiglottis (A) and columnar cells in the vocal process (B). (A‐1,B‐1) Projection views from the laryngeal cavity. (A‐2,B‐2) Lateral projection views. Arrowheads indicate brush cells. (C,D) Double immunofluorescence for GNAT3 and espin in chemosensory cell clusters of the epiglottis (C) and aryepiglottic fold (D). Espin‐immunoreactive apical tips (red) of GNAT3‐immunoreactive cells gathered at the lumen of the laryngeal cavity. Clusters in (C) and (D) contained 3 and 12 GNAT3‐immunoreactive cells, respectively. (C‐1,D‐1) Projection views and (C‐2,D‐2) digitalized sectional views at the lines indicated in (G‐1) and (G‐2).
Distribution of P2X3‐immunoreactive nerves around chemosensory cells
P2X3‐immunoreactive nerve endings closely contacted with GNAT3‐immunoreactive chemosensory cells, which is consistent with our previous findings (Takahashi et al. 2016). Whole‐mount preparations clearly showed an interrelationship between GNAT3‐immunoreactive chemosensory cells and P2X3‐immunoreactive nerve endings. The axon terminals of P2X3‐immunoreactive nerve endings were wrapped or in close contact with the perinuclear regions and elongated cytoplasmic processes of GNAT3‐immunoreactive cells in the epiglottis (Fig. 8A,B). Some branches from these endings ran towards epithelial cells without GNAT3 immunoreactivity. Similar to the arytenoid region, P2X3‐immunoreactive nerve endings surrounded the perinuclear region of cells with or without GNAT3 immunoreactivity (Fig. 8C–E). In the chemosensory cell cluster, P2X3‐immunoreactive nerve fibers intruded into the cluster, and branched and contacted with GNAT3‐immunoreactive cells (Fig. 8F,G). The axon terminals of P2X3‐immunoreactive nerve endings completely surrounded some SNAP25‐immunoreactive cells (Fig. 8F,H).
Reflex evoked by the application of QHCl to the laryngeal cavity
In intact rats, the perfusion of QHCl (10 mm, 30 s) to the laryngeal cavity induced the depression of tracheal breathing and decreased electromyogram activity in the diaphragm of all animals examined (Fig. 9A). Our experiments did not induce apnea in any of the rats used. The average respiratory frequencies in the control, perfusion, and post‐perfusion periods were 118.9 ± 11.5, 85.9 ± 12.9, and 109.3 ± 11.3 breaths min−1, respectively. The ratio of the perfusion vs. control and post‐perfusion vs. control periods were 71.2 ± 4.4 and 92.1 ± 4.1%, respectively. When the SLN was severed, QHCl did not induce any respiratory changes (Fig. 9B). In rats with severed SLN, the average respiratory frequencies in the control, perfusion, and post‐perfusion periods were 141.2 ± 17.1, 138.0 ± 16.9, and 138.7 ± 18.0 breaths min−1, respectively. The ratios of perfusion vs. control and post‐perfusion vs. control periods were 97.8 ± 0.4 and 98.0 ± 0.9%, respectively. A significant difference was observed in respiratory frequencies between the control phase and QHCl perfusion in intact rats, but not in rats with severed bilateral SLN (correlation t‐test; P < 0.05; Fig. 10). The application of Hepes‐Ringer buffer did not cause any respiratory changes in either group. The results obtained are shown in Table 4.
Figure 9.
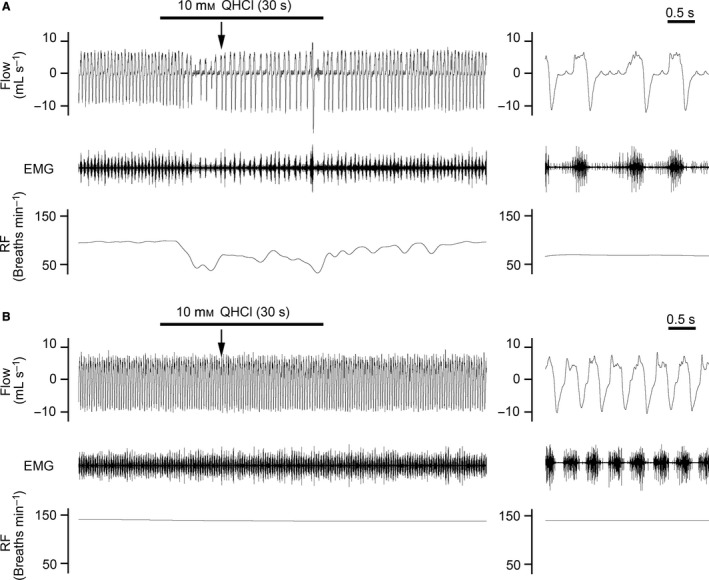
Changes in respiratory flow (Flow), electromyographic activity of the diaphragm (EMG), and respiratory frequency (RF) when QHCl was applied to the laryngeal cavity of intact rats (A) and rats with a severed bilateral superior laryngeal nerve (B). Left‐hand panels are enlarged views of arrows in the right‐hand panels. (A) Perfusion of QHCl (10 mm, 30 s) into the laryngeal cavity of intact rats induced the depression of tracheal breathing and decreased EMG. RF decreased during the perfusion of QHCl. (B) No changes were noted in RR or EMG during the perfusion of QHCl in rats with a severed superior laryngeal nerve.
Figure 10.
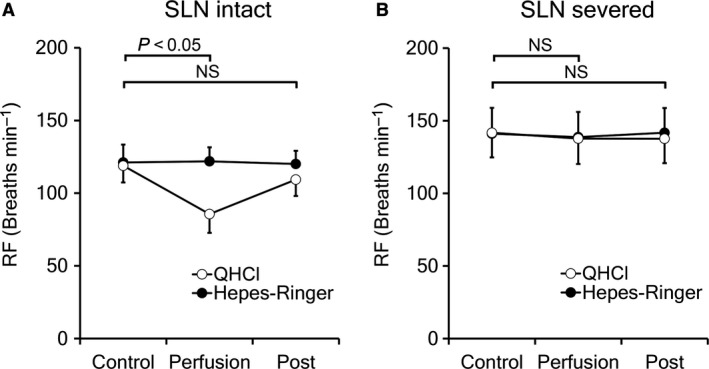
Average respiratory frequency (RF) in control, perfusion, and post‐perfusion periods after the application of QHCl or Hepes‐Ringer buffer. Significant differences (P < 0.05) were shown in RF between the control phase and QHCl perfusion in intact rats (A) but not in rats with a severed bilateral superior laryngeal nerve (B). In the control, the application of Hepes‐Ringer buffer did not cause any changes in RF in either group.
Table 4.
Changes in respiratory frequencies during the perfusion of 10 mm QHCl or Hepes‐Ringer buffer for 30 s
| Animal number | QHCl perfusion (breaths min−1) (Ratio vs. control period; %) | Hepes‐Ringer perfusion (breaths min−1) (Ratio vs. control period; %) | ||||
|---|---|---|---|---|---|---|
| Control | Perfusion | Post | Control | Perfusion | Post | |
| SLN intact | ||||||
| 1 | 96.0 | 59.9 | 90.7 | 103.2 | 103.3 | 102.0 |
| – | (62.4) | (94.5) | – | (100.0) | (98.8) | |
| 2 | 132.7 | 99.5 | 129.6 | 144.6 | 135.6 | 130.3 |
| – | (74.9) | (97.6) | – | (93.8) | (90.1) | |
| 3 | 128.0 | 97.5 | 107.7 | 115.6 | 126.7 | 128.0 |
| – | (76.2) | (84.1) | – | (109.6) | (110.7) | |
| Average ± SE | 118.9 ± 11.5 | 85.6 ± 12.9 | 109.3 ± 11.3 | 121.1 ± 12.3 | 121.9 ± 9.7 | 120.1 ± 9.1 |
| – | (71.2 ± 4.1) | (92.1 ± 4.1) | – | (101.2 ± 4.6) | (99.9 ± 6.0) | |
| SLN severed | ||||||
| 1 | 170.2 | 167.3 | 169.8 | 167.1 | 164.8 | 166.6 |
| – | (98.3) | (99.7) | – | (98.7) | (99.7) | |
| 2 | 111.0 | 108.8 | 107.4 | 108.1 | 107.5 | 107.5 |
| – | (98.0) | (96.7) | – | (99.4) | (99.5) | |
| 3 | 142.2 | 137.9 | 138.9 | 136.9 | 138.4 | 144.2 |
| – | (97.0) | (97.7) | – | (101.2) | (105.4) | |
| Average ± SE | 141.2 ± 17.1 | 138.0 ± 16.9 | 138.7 ± 18.0 | 137.4 ± 17.0 | 136.9 ± 16.6 | 139.4 ± 17.2 |
| – | (97.8 ± 0.4) | (98.0 ± 0.9) | – | (99.7 ± 0.7) | (101.5 ± 1.9) | |
Control, control period (30 s before perfusion); Perfusion, perfusion period (30 s); Post, post‐perfusion period (30 s after perfusion).
Discussion
In the present study, we demonstrated the morphology, distribution, and innervation of solitary chemosensory cells and chemosensory cell clusters in the laryngeal mucosa using whole‐mount preparations with immunofluorescence for GNAT3. Furthermore, we recorded laryngeal reflexes that may have been induced by the activation of chemosensory cells.
Distribution of chemosensory cells in the laryngeal mucosa
The distribution of solitary chemosensory cells and chemosensory clusters in the rat laryngeal mucosa was observed in whole‐mount preparations with GNAT3‐immunohistochemistry. Sbarbati et al. (2004a) previously identified the epithelium containing solitary chemosensory cells as a specific laryngeal sensory epithelium (SLSE), and divided it into two parts: lateral SLSE (lSLSE) and interarytenoidal SLSE (iaSLSE). They reported that lSLSE and iaSLSE were located in the ventrolateral wall of the larynx at the bases of the aryepiglottic fold and interarytenoidal region, respectively. These areas may correspond to the base of the corniculate process (area 5 in Fig. 1) and vocal process of arytenoid cartilage (area 6 in Fig. 1) in the present study. These parts of the laryngeal mucosa may play an important role in respiratory reflexes because physiological experiments revealed that the receptors for laryngeal chemoreflexes were concentrated in the interarytenoid notch in human infants (Pickens et al. 1989). In addition to the mucosa covering arytenoid cartilage, a moderate number of GNAT3‐immunoreactive chemosensory cells were found at the base of the epiglottis (area 2 in Fig. 1). The mucosa overlying epiglottic cartilage may also be a receptive field for chemical stimuli.
Chemosensory cell clusters have been reported as laryngeal taste buds in various species (Travers & Nicklas, 1990; Sweazey et al. 1994; Shrestha et al. 1995; Nishijima & Atoji, 2004; Sbarbati et al. 2004b). Chemosensory clusters are mainly distributed in the laryngeal surface of the epiglottis and aryepiglottic fold in the rat larynx (Nishijima & Atoji, 2004; Sbarbati et al. 2004b). Shrestha et al. (1995) demonstrated that only a few ‘taste buds’ were distributed near the edge of the oral surface of the epiglottis. In contrast, in the present study, chemosensory cell clusters were concentrated at the anterior border of the larynx, including the edge of the epiglottis, aryepiglottic fold, and mucosa covering arytenoid cartilage. GNAT3‐immunoreactive chemosensory clusters at the anterior edge of the larynx appear to be activated by food or fluid passing from the oral cavity to the esophagus. Physiological experiments also showed that the receptive field of chemosensory nerve fibers in the cat SLN corresponded to the distributional area of ‘taste buds’, i.e. the epiglottis and arytenoid region (Stedman et al. 1980). On the other hand, chemosensory clusters were only distributed in the squamous stratified epithelium found in the anterior part of the larynx. Thus, the type of epithelium may be related to the formation of chemosensory cell clusters.
Based on these results, the distribution of solitary chemosensory cells and chemosensory cell clusters indicates that the entrance of the larynx is the most important sensory field for laryngeal chemoreflexes.
Morphology of solitary chemosensory cells
Solitary chemosensory cells showed a wide range of morphological variations. Previous studies reported that laryngeal solitary chemosensory cells with immunoreactivity for GNAT3 or PLCβ had a columnar shape with apical processes facing the laryngeal lumen by microvilli (Sbarbati et al. 2004a; Merigo et al. 2005; Takahashi et al. 2016). Flask‐like or columnar cells with GNAT3 immunoreactivity were also observed in the present study; however, their distribution was restricted to the arytenoid region covered with a pseudostratified epithelium. In contrast, slender chemosensory cells with elongated processes existed in the mucosa covering the epiglottis and arytenoid cartilage. These cells appeared to resemble the solitary chemosensory cells found in the rat nasal mucosa in whole‐mount preparations with immunofluorescence for GNAT3 (Finger et al. 2003) or that from TRPM5‐GFP transgenic mice (Lin et al. 2008). In the present study, the tips of apical cytoplasmic processes were immunoreactive for espin in the slender and columnar types. Espin is an actin‐binding protein in microvilli that exists in microvillus structures in various cells (Sekerková et al. 2004, 2006). Thus, all GNAT3‐immunoreactive cells face the laryngeal cavity for direct activation by luminal chemical stimuli via espin‐immunoreactive microvilli.
In the human sinonasal epithelium, denatonium benzoate has been shown to increase intracellular Ca2+ concentrations in chemosensory cells, and the activity of chemosensory cells was transmitted to adjacent cells via gap junctions (Lee & Cohen, 2014). In laryngeal solitary chemosensory cells, activation by chemical stimuli appears to occur in apical cytoplasmic processes, and intracellular signals may then be transmitted to elongated processes in slender cells or the lateral cytoplasmic membrane in columnar cells in order to regulate the surrounding epithelial cells in addition to the activation of afferent nerve endings. We also observed an unexpected morphology of GNAT3‐immunoreactive cells – apical projections from elongated processes and double apical projections. Since the derivation and development of solitary chemosensory cells has not yet been investigated in the respiratory mucosa, the morphogenesis of solitary chemosensory cells warrants further study.
Morphology of chemosensory clusters
Chemosensory clusters containing GNAT3‐immunoreactive cells were distributed in the stratified squamous/cuboidal epithelium covering the peripheral region of the epiglottis, aryepiglottic fold, and tip of the corniculate process of arytenoid cartilage. Since lingual taste buds contain 50–100 taste cells (Chaudhari & Roper, 2010; Roper, 2013), laryngeal chemosensory clusters may be smaller than lingual taste buds. In the present study, SNAP25‐immunoreactive cells also existed in these clusters. SNAP25 is a molecular marker for type III taste cells in lingual taste buds (Yang et al. 2000); therefore, the cellular components of laryngeal chemosensory clusters appear to be similar to those of the lingual taste buds. An electron microscopic study of sheep laryngeal ‘taste buds’ showed that type III cells were absent (Sweazey et al. 1994). The present results are inconsistent with these findings but are supported by those from the rat larynx (Nishijima & Atoji, 2004). Individual GNAT3‐immunoreactive cells appear to be variform, similar to solitary chemosensory cells. Although Sbarbati et al. (2004b) reported that the basal processes of chemosensory cells are not well‐developed, whole‐mount preparations revealed that chemosensory cells in clusters have pleomorphic, branched, and twisted basal processes. This complex morphology may be difficult to identify in histological sections. On the other hand, apical processes with espin‐immunoreactive microvilli appeared to gather at one point. We concluded that the morphology of the laryngeal chemosensory cell clusters are fundamentally the same structures as the lingual taste buds, although it is unknown whether they are involved with cognition of the taste or not.
In lingual taste buds, the development of taste buds was affected by neurotrophin brain‐derived neurotrophic factor (BDNF) and its receptor TrkB. In an ontogenetic analysis, the number and volume of lingual taste buds were decreased in Bdnf−/−/NT4−/− mice and TrkB−/− mice (Huang et al. 2015). In CreERT2 Bdnf lox/− mice without BDNF in taste cells, the number of cells per taste bud was reduced and the cells less innervated (Meng et al. 2015). Our previous study revealed that TrkB was expressed in laryngeal chemosensory cell clusters, even in the postnatal rats (Yamamoto et al. 2011). The neurotrophic effects of BDNF may be one of the important factors for development of the chemosensory cell clusters in the larynx.
Distribution of P2X3‐immunoreactive nerve fibers on chemosensory cells
GNAT3‐immunoreactive solitary sensory cells were in close contact with the terminals of P2X3‐immunoreactive nerves, which is consistent with our previous findings (Takahashi et al. 2016). Moreover, whole‐mount preparations showed that lateral elongated processes in slender cells were densely innervated by P2X3‐immunoreactive nerves. Thus, the activation of GNAT3‐immunoreactive cells may be transmitted to afferent nerve fibers by ATP released from solitary chemosensory cells, particularly lateral elongated processes. Moreover, branches of P2X3‐immunoreactive nerve endings also surrounded epithelial cells without GNAT3 immunoreactivity. In the lingual taste buds, P2X2 purinoceptor is also expressed in the afferent fibers (Yang et al. 2000; Finger et al. 2005; Ishida et al. 2009). We previously reported that P2X3‐immunoreactive nerve endings also express P2X2 (Takahashi et al. 2016), and therefore the innervation of the laryngeal chemosensory cells seems to be similar to that of the lingual taste buds. Furthermore, P2X3‐immunoreactive nerve endings in the laryngeal mucosa contained vesicular glutamate transporters (vGLUTs), i.e. vGLUT1, vGLUT2, and vGLUT3 (Takahashi et al. 2016), as reported in the lingual gustatory fibers (Vandenbeuch et al. 2010). Therefore, P2X3‐immunoreactive nerve endings may regulate laryngeal epithelial cells by glutamate in an axon‐reflex manner. Thus, solitary chemosensory cells and the chemosensory cells in clusters may indirectly activate non‐chemosensory cells via sensory fibers, in addition to direct activation by gap junctions.
On the other hand, solitary chemosensory cells in the nasal respiratory mucosa and vomeronasal organ were densely innervated by nerve fibers containing substance P (SP) and/or calcitonin gene‐related peptide (CGRP; Finger et al. 2003; Lin et al. 2008; Ogura et al. 2010; Tizzano et al. 2010, 2011). Since some nerve fibers immunoreactive for SP and CGRP were also distributed around laryngeal solitary chemosensory cells (Tizzano et al. 2011; Takahashi et al. 2016), peptidergic nerve fibers may take part in laryngeal chemoreception in cooperation with nerve endings with P2X3 immunoreactivity.
In lingual taste buds, signals generated by taste cells may be transmitted to P2X3‐immunoreactive nerves (see review, Kinnamon & Finger, 2013). In the present study, P2X3‐immunoreactive nerve endings were distributed within laryngeal chemosensory cell clusters in whole‐mount preparations, as previously reported in cryostat sections (Takahashi et al. 2016). Chemosensory cells in the clusters appeared to contact with P2X3‐immunoreactive nerve endings, which is consistent with our previous findings. Similar to solitary chemosensory cells, chemosensory cells in clusters may activate P2X3‐immunoreactive nerve endings to evoke respiratory reflexes.
Laryngeal reflex caused by QHCl
Chemosensory cells in the airways express various molecules for taste transduction, including the taste receptors Tas1R2, Tas1R3, and Tas2Rs as well as GNAT3, PLCβ, IP3R3, and TRPM5 (Tizzano et al. 2011). Bitter and sweet tastes are detected respectively by Tas2Rs and by a functional heterodimer of Tas1R2/Tas1R3 (for a review, see Lindemann, 2001). Thus, chemosensory cells in the airways are expected to respond to a bitter taste. In previous experiments, the perfusion of saline containing denatonium benzoate, QHCl or cycloheximide induced apnea in rats and mice (Finger et al. 2003; Tizzano et al. 2010). In the present study, the respiratory depression by a bitter taste stimulation to the laryngeal cavity appeared to be evoked via chemosensory cells in the laryngeal mucosa. Moreover, the respiratory reflex induced by stimulation to laryngeal mucosa was completely inhibited by denervation of the SLN. Thus, the SLN may have crucial role in the afferent pathway from supraglottic laryngeal mucosa to evoke respiratory depression. The application of QHCl to the laryngeal mucosa may induce the activation of P2X3‐expressing nerve endings in the SLN to depress respiration. On the other hand, the activity of the SLN evoked by 10 mm QHCl was not reduced in P2X2/P2X3 double knockout mice (Ohkuri et al. 2012). Nerve endings other than P2X3‐immunoreactive nerves may also be involved in the laryngeal reflex evoked by bitter stimuli. Peptidergic nerves, such as SP‐ and/or CGRP‐containing nerves, have been suggested to participate in the perception of QHCl in the larynx, in addition to nerve endings containing P2X purinoreceptors.
Functional considerations
In electrophysiological analyses, the SLN was intensely activated by the addition of distilled water rather than other taste stimuli to the laryngeal mucosa of the mouse, rat and hamster (Shingai, 1980; Shingai & Beidler, 1985; Smith & Hanamori, 1991). Since it has been reported that acid‐sensing taste cells are activated by water (Zocchi et al. 2017), laryngeal chemosensory cell clusters may serve as the receptive end organ for this response. Furthermore, chemoreceptors in the laryngeal mucosa have been suggested to be activated by HCl and QHCl because the stimulation of the rat laryngeal mucosa by these stimulants induced the activation of neurons in the lateral parabrachial nucleus (Miyaoka et al. 1998). On the other hand, an RT‐PCR analysis of the larynx showed the expression of several Tas2R bitter receptors (Tizzano et al. 2011). Therefore, in the laryngeal mucosa, solitary chemosensory cells and cells in chemosensory cell clusters may be activated by bitter stimuli such as QHCl, and transmit signals to the central nervous system. In the nasal mucosa, solitary chemosensory cells are considered to have additional functions. The nasal perfusion of the bacterial quorum‐sensing molecules, acyl‐homoserine lactones, such as LasI and EsaI, induced respiratory depression in wild‐type mice, but not in TrpM5 knockout or Gα‐gustducin knockout mice, suggesting that nasal solitary chemosensory cells are also activated by bacterial signals as well as bitter stimuli (Tizzano et al. 2010). Moreover, one of the bitter stimuli, denatonium benzoate, induced the release of the antimicrobial peptides, β‐defensin 1 and β‐defensin 2, from a human sinonasal air–liquid interface culture preparation, which suggested that chemosensory cells regulate innate immunity in the upper airways (Lee & Cohen, 2014). Laryngeal chemosensory cells may also play a role in protecting the mucosa from bacterial infections.
Conflict of interest
The authors declare no conflict of interests.
Acknowledgements
This work was partly supported by JSPS KAKENHI: Grant Number 15K07759 (to Y.Y.) from the Japan Society for the Promotion of Science (JSPS), Japan.
References
- Bradley RM (2000) Sensory receptors of the larynx. Am J Med 108, 47S–50S. [DOI] [PubMed] [Google Scholar]
- Chaudhari N, Roper SD (2010) The cell biology of taste. J Cell Biol 190, 285–296. [DOI] [PMC free article] [PubMed] [Google Scholar]
- Finger TE, Bottger B, Hansen A, et al. (2003) Solitary chemoreceptor cells in the nasal cavity serve as sentinels of respiration. Proc Natl Acad Sci USA 100, 8981–8986. [DOI] [PMC free article] [PubMed] [Google Scholar]
- Finger TE, Danilova V, Barrows J, et al. (2005) ATP signaling is crucial for communication from taste buds to gustatory nerves. Science 310, 1495–1499. [DOI] [PubMed] [Google Scholar]
- Gulbransen BD, Clapp TR, Finger TE, et al. (2008) Nasal solitary chemoreceptor cell responses to bitter and trigeminal stimulants in vitro. J Neurophysiol 99, 2929–2937. [DOI] [PMC free article] [PubMed] [Google Scholar]
- Huang T, Ma L, Krimm RF (2015) Postnatal reduction of BDNF regulates the developmental remodeling of taste bud innervation. Dev Biol 405, 225–236. [DOI] [PMC free article] [PubMed] [Google Scholar]
- Idé C, Munger BL (1980) The cytologic composition of primate laryngeal chemosensory corpuscles. Am J Anat 158, 193–209. [DOI] [PubMed] [Google Scholar]
- Ishida Y, Ugawa S, Ueda T, et al. (2009) P2X2‐ and P2X3‐positive fibers in fungiform papillae originate from the chorda tympani but not the trigeminal nerve in rats and mice. J Comp Neurol 514, 131–144. [DOI] [PubMed] [Google Scholar]
- Kinnamon SC, Finger TE (2013) A taste for ATP: neurotransmission in taste buds. Front Cell Neurosci 7, 264. [DOI] [PMC free article] [PubMed] [Google Scholar]
- Krasteva G, Kummer W (2012) ‘Tasting’ the airway lining fluid. Histochem Cell Biol 138, 365–383. [DOI] [PubMed] [Google Scholar]
- Lee RJ, Cohen NA (2014) Bitter and sweet taste receptors in the respiratory epithelium in health and disease. J Mol Med 92, 1235–1244. [DOI] [PMC free article] [PubMed] [Google Scholar]
- Lee L‐Y, Yu J (2014) Sensory nerves in lung and airways. Compr Physiol 4, 287–324. [DOI] [PubMed] [Google Scholar]
- Lin W, Ogura T, Margolskee RF, et al. (2008) TRPM5‐expressing solitary chemosensory cells respond to odorous irritants. J Neurophysiol 99, 1451–1460. [DOI] [PubMed] [Google Scholar]
- Lindemann B (2001) Receptors and transduction in taste. Nature 413, 219–225. [DOI] [PubMed] [Google Scholar]
- Meng L, Ohman‐Gault L, Ma L, et al. (2015) Taste bud‐derived BDNF is required to maintain normal amounts of innervation to adult taste buds. eNeuro 2, 0097‐15. [DOI] [PMC free article] [PubMed] [Google Scholar]
- Merigo F, Benati D, Tizzano M, et al. (2005) α‐Gustducin immunoreactivity in the airways. Cell Tissue Res 319, 211–219. [DOI] [PubMed] [Google Scholar]
- Miyaoka Y, Shingai T, Takahashi Y, et al. (1998) Responses of neurons in the parabrachial region of the rat to electrical stimulation of the superior laryngeal nerve and chemical stimulation of the larynx. Brain Res Bull 45, 95–100. [DOI] [PubMed] [Google Scholar]
- Nishijima K, Atoji Y (2004) Taste buds and nerve fibers in the rat larynx: an ultrastructural and immunohistochemical study. Arch Histol Cytol 67, 195–209. [DOI] [PubMed] [Google Scholar]
- Ogura T, Krosnowski K, Zhang L, et al. (2010) Chemoreception regulates chemical access to mouse vomeronasal organ: role of solitary chemosensory cells. PLoS One 5, e11924. [DOI] [PMC free article] [PubMed] [Google Scholar]
- Ohkuri T, Horio N, Stratford JM, et al. (2012) Residual chemoresponsiveness to acids in the superior laryngeal nerve in ‘taste‐blind’ (P2X2/P2X3 double‐KO) mice. Chem Senses 37, 523–532. [DOI] [PMC free article] [PubMed] [Google Scholar]
- Pickens DL, Schefft GL, Thach BT (1989) Pharyngeal fluid clearance and aspiration preventive mechanisms in sleeping infants. J Appl Physiol 66, 1164–1171. [DOI] [PubMed] [Google Scholar]
- Roper SD (2013) Taste buds as peripheral chemosensory processors. Semin Cell Dev Biol 24, 71–79. [DOI] [PMC free article] [PubMed] [Google Scholar]
- Sant'Ambrogio G, Tsubone H, Sant'Ambrogio FB (1995) Sensory information from the upper airway: role in the control of breathing. Respir Physiol 102, 1–16. [DOI] [PubMed] [Google Scholar]
- Sbarbati A, Merigo F, Benati D, et al. (2004a) Identification and characterization of a specific sensory epithelium in the rat larynx. J Comp Neurol 475, 188–201. [DOI] [PubMed] [Google Scholar]
- Sbarbati A, Merigo F, Benati D, et al. (2004b) Laryngeal chemosensory clusters. Chem Senses 29, 683–692. [DOI] [PubMed] [Google Scholar]
- Sekerková G, Zheng L, Loomis PA, et al. (2004) Espins are multifunctional actin cytoskeletal regulatory proteins in the microvilli of chemosensory and mechanosensory cells. J Neurosci 24, 5445–5456. [DOI] [PMC free article] [PubMed] [Google Scholar]
- Sekerková G, Zheng L, Loomis PA, et al. (2006) Espins and the actin cytoskeleton of hair cell stereocilia and sensory cell microvilli. Cell Mol Life Sci 63, 2329–2341. [DOI] [PMC free article] [PubMed] [Google Scholar]
- Shingai T (1980) Water fibers in the superior laryngeal nerve of the rat. Jpn J Physiol 30, 305–307. [DOI] [PubMed] [Google Scholar]
- Shingai T, Beidler LM (1985) Response characteristics of three taste nerves in mice. Brain Res 335, 245–249. [DOI] [PubMed] [Google Scholar]
- Shrestha R, Hayakawa T, Das G, et al. (1995) Distribution of taste buds on the epiglottis of the rat and house shrew, with special reference to air and food pathways. Okajimas Folia Anat Jpn 72, 137–148. [DOI] [PubMed] [Google Scholar]
- Smith DV, Hanamori T (1991) Organization of gustatory sensitivities in hamster superior laryngeal nerve fibers. J Neurophysiol 65, 1098–1114. [DOI] [PubMed] [Google Scholar]
- Stedman HM, Bradley RM, Mistretta CM, et al. (1980) Chemosensitive responses from the cat epiglottis. Chem Senses 5, 233–245. [Google Scholar]
- Sweazey RD, Edwards CA, Kapp BM (1994) Fine structure of taste buds located on the lamb epiglottis. Anat Rec 238, 517–527. [DOI] [PubMed] [Google Scholar]
- Takahashi N, Nakamuta N, Yamamoto Y (2016) Morphology of P2X3‐immunoreactive nerve endings in the rat laryngeal mucosa. Histochem Cell Biol 145, 131–146. [DOI] [PubMed] [Google Scholar]
- Tizzano M, Finger TE (2013) Chemosensors in the nose: guardians of the airways. Physiology (Bethesda) 28, 51–60. [DOI] [PMC free article] [PubMed] [Google Scholar]
- Tizzano M, Gulbransen BD, Vandenbeuch A, et al. (2010) Nasal chemosensory cells use bitter taste signaling to detect irritants and bacterial signals. Proc Natl Acad Sci USA 107, 3210–3215. [DOI] [PMC free article] [PubMed] [Google Scholar]
- Tizzano M, Cristofoletti M, Sbarbati A, et al. (2011) Expression of taste receptors in solitary chemosensory cells of rodent airways. BMC Pulm Med 11, 3. [DOI] [PMC free article] [PubMed] [Google Scholar]
- Travers SP, Nicklas K (1990) Taste bud distribution in the rat pharynx and larynx. Anat Rec 227, 373–379. [DOI] [PubMed] [Google Scholar]
- Vandenbeuch A, Tizzano M, Anderson CB, et al. (2010) Evidence for a role of glutamate as an efferent transmitter in taste buds. BMC Neurosci 11, 77. [DOI] [PMC free article] [PubMed] [Google Scholar]
- Widdicombe J (2001) Airway receptors. Respir Physiol 125, 3–15. [DOI] [PubMed] [Google Scholar]
- Yamamoto Y, Hashiguchi M, Yamaguchi‐Yamada M (2011) Morphological development and expression of neurotrophin receptors in the laryngeal sensory corpuscles. Anat Rec (Hoboken) 294, 694–705. [DOI] [PubMed] [Google Scholar]
- Yamamoto Y, Ozawa Y, Yokoyama T, et al. (2018) Immunohistochemical characterization of brush cells in the larynx. J Mol Histol 49, 63–73. [DOI] [PubMed] [Google Scholar]
- Yang R, Crowley HH, Rock ME, et al. (2000) Taste cells with synapses in rat circumvallate papillae display SNAP‐25‐like immunoreactivity. J Comp Neurol 424, 205–215. [DOI] [PubMed] [Google Scholar]
- Zocchi D, Wennemuth G, Oka Y (2017) The cellular mechanism for water detection in the mammalian taste system. Nat Neurosci 20, 927–933. [DOI] [PubMed] [Google Scholar]


