Abstract
Background
The aim of this study was to identify the clinical characteristics, treatment usage, and health outcomes of US adults diagnosed with neuropathic pain (NeP) by experienced physicians.
Methods
Adults with scores exceeding the threshold for probable NeP (painDETECT ≥19) and diagnosed with NeP by a qualified physician completed a questionnaire that included comorbid conditions, pain symptoms and experiences, medication use, health status (3-level EuroQol 5 Dimensions (EQ-5D-3L]: health utilities index and visual analog scale), pain severity and interference with functioning (Brief Pain Inventory), and work and activity impairment (Work Productivity and Activity Impairment questionnaire). Descriptive analyses were performed for each NeP subtype.
Results
Participants (n=295) were predominantly female (64.4%), middle-aged (53.9%), and white (51.5%). Chronic low back pain was the most frequently diagnosed major NeP syndrome (n=166), followed by diabetic peripheral neuropathy (n=58), post-trauma neuropathy (n=47), post-surgical neuropathy (n=28), and central NeP (n=23). An additional 45 participants were diagnosed, but did not meet the criteria for the aforementioned subtypes. Participants could be diagnosed with multiple subtypes. Across each NeP subtype, patients reported high rates of comorbid disease, including arthritis (range: 39.1%–64.3%) and high blood pressure (range: 26.1%–69.0%), as well as symptomology that included numbness (range: 68.1%–91.4%) and changes in muscular strength (range: 24.1%–65.2%). The majority of patients reported back pain (range: 77.8%–95.7%) and arthritis/joint pain (range: 68.1%–78.6%). The most commonly reported types of NeP pain medication were non-steroidal anti-inflammatory drugs (range: 43.1%–70.2%), weak opioids (range: 22.2%–39.3%), and strong opioids (range: 8.7%–28.6%). All six NeP groups generally reported similar levels of dysfunction on all self-report measures. The most notable finding was that the EuroQol-5D-3L health utilities index scores for each of the six groups were lower than the US norms by a clinically important amount.
Conclusion
These exploratory findings indicate that patients with NeP across different etiologies are medically complex and experience impaired function across multiple domains.
Keywords: activity impairment, functional status, health-related quality of life, neuropathic pain, pain medication use, physician diagnosis, work impairment
Introduction
Neuropathic pain (NeP) is defined as “pain arising as a direct consequence of a lesion or disease of the somatosensory system”.1 NeP can result from a variety of underlying etiologies, such as metabolic disease, infection, malignancy, AIDS, medications, and toxins, manifesting in a broad range of symptoms, which makes it difficult to correctly diagnose because there are no standardized diagnostic criteria. This has resulted in under-diagnosis and under-treatment.2 A 2014 systematic review of 21 studies from around the world estimated that the general prevalence ranges from 6.9% to 10.0%.3 A prevalence of 10.0% has also been identified in the USA.4
Patients with NeP experience a range of painful sensory symptoms including, but not limited to, allodynia, hyperalgesia, paresthesia, and sensations of burning or freezing,5 which have a detrimental effect on health-related quality of life (HRQoL) and contribute to a decreased ability to perform daily activities and poorer health status.6,7 A systematic review of articles published between 1999–2012 found that as NeP pain severity increased so did work impairment (eg, unemployment and absenteeism) and health-care resource utilization.7 In addition, a retrospective chart review found that the annual estimated work productivity loss was $19,000 per person and the associated health-care costs per person were $2,219 per year,8 further indicating that NeP is both multifaceted and burdensome.
NeP syndromes are highly variable and are likely to have diverse underlying mechanisms. They include a range of syndromes, such as diabetic peripheral neuropathy (DPN) and chronic low back pain with a neuropathic component (CLBP-NeP). To date, the literature has largely focused on clearly defining syndromes and/or their epidemiology,9–12 but it is not clear whether they are associated with differing degrees of burden. Whereas few studies have compared NeP syndromes, a meta-analysis found that patients with central neuropathic pain (CNP) reported lower health utilities than those with DPN, post-herpetic neuralgia, or mixed NeP.13
Another cross-sectional retrospective study compared six NeP syndromes (DPN, HIV-related NeP, post-surgical/post-trauma NeP (PSN/PTN), spinal cord injury-related NeP, CLBP-NeP, and small-fiber neuropathy) and found that individuals with PSN/PTN and those with DPN incurred the highest and lowest annualized per-patient costs, respectively.8 Sadosky et al reported high levels of pain and associated impairment among 112 patients with DPN,14 while Parsons et al reported similar burden among those with diagnosed with PSN and PTN.15
The aim of the current prospective study of US data is to replicate real-world conditions by having physicians experienced in diagnosing NeP determine whether patients with probable NeP, as indicated on the painDETECT questionnaire,16 actually have the condition. The burden associated with the five most often diagnosed syndromes, DPN, CLBP-NeP, PTN, PSN, and CNP, was examined across self-reported measures of health status, pain severity and interference, and work and activity impairment. In addition, a small number of patients who were diagnosed with other less common syndromes were included in a single “other neuropathic pain” (ON) group.
Methods
Participants and procedure
Participants (n=1,053), aged 18 years or older, were recruited by internet, telephone, and mail. More details about the initial recruitment can be found elsewhere.4 They completed an initial online survey, which included completing a brief questionnaire and the painDETECT, an NeP screening tool.16 Those who screened positive for probable NeP (n=775, 73.6%; painDETECT scores ≥19) and were located within 1 hour’s driving distance or less than 48 km (30 miles) from one of 30 sites in 21 cities throughout the USA (Figure 1) were invited for an examination conducted by participating licensed physicians (n=55). These physicians were either primary care providers/internists with a sub-specialty training in pain medicine or pain specialists (neurologist, anesthesiologist, endocrinologist, diabetologist, physical medicine/rehabilitation specialist, orthopedist), who had been practicing for at least 3 years at the time of study, spent at least 25% of their time treating patients, and felt confident diagnosing NeP and the specific syndromes of DPN, CNP, CLBP-NeP, PTN, and PSN.
Figure 1.

Sites of physical exams.
Note: Copyright ©2018 Zee source. Reproduced from https://www.zeemaps.com.
To replicate real-world conditions, physicians followed their own procedures for collecting patients’ history and conducting a physical exam, within the confines of the examination being conducted in a non-interventional fashion, to ascertain whether a diagnosis of NeP was warranted. Specifically, physicians were instructed not to include any type of laboratory, radiographic, or other invasive testing in their assessment, which are not a part of the International Association for the Study of Pain’s1 guidelines for NeP diagnosis. Of the 462 evaluated participants, physicians diagnosed 295 participants (63.8%) with one of the five NeP syndromes or other condition (ON). These patients also completed an additional 20-minute survey that included questions regarding sociodemographics, NeP-related symptoms and pains, pain medication use, and instruments measuring HRQoL, impairment to work productivity and daily activities, sleep, and the impact of pain on their lives. The study protocol was approved by the Sterling Institutional Review Board (Atlanta, GA, USA), and written informed consent was obtained from all participating patients. Patients received $100 for participating. Physicians received $250–350 per patient evaluation regardless of the diagnosis. In addition, site fees were paid for each patient examined.
Measures
Patient-reported information
NeP screening
The painDETECT questionnaire is a 13-item instrument that was used to ascertain whether patients had probable NeP. It includes three domains (pain course pattern, pain radiation, and sensory symptoms). A total score was generated for each respondent by assigning a value to items 7–13 (0 = “never” to 5 = “very strongly”) and summating the result. This subtotal was then adjusted, based on responses to items 4 and 5 (eg, if radiating pain was selected in item 5, then the subtotal was increased by 2 points).
The properties of the instrument were originally tested on a sample of lower-back pain patients and found to have a sensitivity and specificity >80%.16 Additional psychometric analyses indicate that it can be used in a number of NeP subpopulations including CLBP-NeP,16 peripheral nerve damage,17 HIV,18–20 PTN/PSN,18–20 spinal cord injury,18–20 small-fiber neuropathy,18–20 neck and shoulder pain,17 and osteoarthritis of the knee,21 as well as a heterogeneous NeP sample.22,23 The painDETECT has also been shown to be appropriate for use in both online and paper-and-pencil forms,16 to possess satisfactory test–retest reliability up to 3 weeks following baseline assessment,24 and to demonstrate good internal consistency across a range of NeP syndromes.19 Furthermore, this measure has been shown to be able to distinguish between different degrees of pain severity at the item level for patients with NeP.25 Research using the scale for other neuropathic syndromes has suggested a range of optimal cut-off points resulting in a varying level of sensitivity and specificity.26–30 In the current study, we used a cut-off score of 19 or higher, which was previously identified in the original validation studies to indicate probable NeP.16
Patient information
All participants reported their gender, age, and race/ethnicity. Those diagnosed with NeP also reported their employment and insurance status, education and income, NeP pain, and pain medication used to treat NeP. Height and weight were also collected and used to calculate body mass index (BMI [kg/m2]: underweight [<18.50], normal weight [18.50–24.99], overweight [25–29.99], and obese [≥30]).
Health status
The 3-level EuroQol 5 Dimensions (EQ-5D-3L) was used to assess HRQoL. It is composed of two parts. The EQ-5D health utility assesses five dimensions of: mobility, self-care, usual activities, pain/discomfort, and anxiety/depression, and respondents report their level of impairment using a three-point Likert scale: experiencing no problems, some problems, or extreme problems.31 The second component includes the EQ visual analog scale (EQ VAS), which asks respondents to rate their current general health on a scale from 0 (worst imaginable health state) to 100 (best imaginable health state). The US population mean for the EQ-5D health utility is 0.87 and a minimally important difference (MID) from a clinical perspective is 0.074.32,33
Pain severity and interference
The Brief Pain Inventory (BPI) was used to assess the severity of pain and its impact on functioning.23 The BPI asks respondents to rate the intensity of the pain they are currently experiencing, as well as the intensity of pain experienced within the previous 24 hours, at the worst, at the least, and on average, using response options ranging from 0 (no pain) to 10 (pain as bad as you can imagine). The BPI also asks respondents to rate on a scale from 0 (does not interfere) to 10 (interferes completely) the degree to which their pain interferes with functioning status in seven domains: general activity, walking, mood, sleep, work, relations with other persons, and enjoyment of life.
Work and activity impairment
The Work Productivity and Activity Impairment (WPAI) questionnaire was used to measure the effect of pain on work and leisure activities.34 The WPAI has six items measuring absenteeism (percentage of time missed from work due to one’s health in the past 7 days), presenteeism (percentage of impairment while at work due to one’s health in the past 7 days), overall work impairment (a combination of absenteeism and presenteeism), and activity impairment (percentage of daily activity impairment due to one’s health in the past 7 days). Scores on the WPAI can range from 0% to 100%; higher scores signify greater impairment. Only participants employed for pay answered the work impairment questions, whereas all participants answered the activity impairment question.
Physician-reported information
As noted previously, in an attempt to replicate real-world circumstances, physicians followed their own procedures for collecting patients’ histories and conducting non-interventional exams to ascertain whether an NeP diagnosis was warranted. Physicians, however, were asked to report certain information, including whether patients had been diagnosed with a condition that was included on a list of 53 items (eg, cancer, cirrhosis, psoriasis, osteoarthritis). They were also asked to report whether patients had a significant NeP component to their presentation. If so, physicians then reported the presence of NeP symptoms (eg, areas of numbness, allodynia) and whether patients were diagnosed with a syndrome (CNP, DPN, CLBP-NeP, PTN, PSN), as defined by the International Association for the Study of Pain.1 For example, “CLBP with neuropathic pain, defined as subjects with low back pain persisting for at least 3 months with a confirmed neuropathic pain component (eg, pain that radiates down the leg, below the knee, and often to the ankle).”1 Physicians were also given the option of reporting diagnoses that did not conform to one of the aforementioned syndromes in a free-text section of the questionnaire. Patients indicated to have NeP, but not one of these aforementioned syndromes, were analyzed as part of the ON group.
Statistical analyses
PainDETECT scores were calculated to identify respondents with probable NeP. Descriptive statistics, counts and percentages for categorical data, and means (M) and SD for continuous data, were reported for all variables. Gender, age, and ethnicity/race were reported for both those diagnosed with NeP and those not diagnosed with the condition. Other sociodemographic (eg, income) variables, height, and weight were solely collected for those diagnosed with NeP. Additional descriptive information for each major NeP syndrome and the ON group were reported. Variables included gender, age, race, NeP symptoms, pains experienced, medication use, and the subscales of the EQ-5D-3L (which were also compared to US norms), the WPAI, and the BPI. All analyses reported were performed using SAS version 9.3.
Results
Of the 472 patients evaluated by clinicians, 295 (62.5%) were diagnosed with an NeP condition and 167 (37.5%) were not. Both groups were mostly female (diagnosed: n=190, 64.4%; not diagnosed: n=99, 59.3%) and tended to be middle aged (diagnosed: M=52.63, SD=12.93; not diagnosed: M=48.95, SD=13.93). White women were over-represented in the diagnosed population (n=154, 52.2%) and under-represented in the non-diagnosed population (n=66, 39.5%) (data not shown). Of those diagnosed with NeP, almost half (46.8%) were obese, less than half were employed, and most had public insurance (53.9%). The vast majority of those diagnosed with NeP reported at least some college education (78.0%) and 38.3% of participants reported an income <$25,000 (Table 1).
Table 1.
Demographic characteristics for those diagnosed with NeP (n=295)
| Categorical variables | NeP respondents
|
|---|---|
| n (%) | |
| Gender | |
| Female | 190 (64.4) |
| Race/ethnicity | |
| White | 152 (51.5) |
| Hispanic or Latino | 40 (13.6) |
| Black or African American | 76 (25.8) |
| Asian or Pacific Islander | 13 (4.4) |
| Mixed or other | 14 (4.7) |
| BMI category (kg/m2) | |
| Underweight (<18.50) | 4 (1.4) |
| Normal (18.50–24.99) | 64 (21.7) |
| Overweight (25–29.99) | 82 (28.4) |
| Obese (≥30) | 140 (46.8) |
| Employment status | |
| Employed | 135 (45.8) |
| Insurance cover | |
| Private | 79 (26.8) |
| Public | 159 (53.9) |
| Both private and public | 19 (6.4) |
| Education | |
| At least some college | 230 (78.0) |
| Income (US $/year) | |
| <24,999 | 113 (38.3) |
| 25,000–49,999 | 77 (26.1) |
| 50,000–99,999 | 59 (20.0) |
| ≥100,000 | 28 (9.5) |
| Continuous variable | |
| Mean ± SD | |
| Age (years) | 52.63±12.93 |
Abbreviation: NeP, neuropathic pain.
A comparison of demographic variables (Table 2) showed that patients with four of the five most often diagnosed NeP syndromes (CNP, DPN, CLBP-NeP, and PSN) were predominantly female (range: 58.4%–69.6%) and middle aged (range: 48.96–59.07 years). However, those with PTN were demographically different from those with other syndromes. They tended to be male (59.6%) and younger (M=48.81, SD=12.47).
Table 2.
Patient demographics by major NeP syndrome
| Characteristic | CNP
|
DPN
|
CLBP-NeP
|
PSN
|
PTN
|
ON
|
|
|---|---|---|---|---|---|---|---|
| n (%) | n (%) | n (%) | n (%) | n (%) | n (%) | ||
| Gender | Female | 16 (69.6) | 34 (58.6) | 97 (58.4) | 19 (67.9) | 19 (40.4) | 34 (75.6) |
| Male | 7 (30.4) | 24 (41.4) | 69 (41.6) | 9 (32.1) | 28 (59.6) | 11 (24.4) | |
|
| |||||||
| Race | White | 14 (60.9) | 29 (50.0) | 75 (45.2) | 15 (53.6) | 20 (42.6) | 30 (66.7) |
| Black | 4 (17.4) | 16 (27.6) | 50 (30.1) | 8 (28.6) | 12 (25.5) | 8 (17.8) | |
| Hispanic | 3 (13.0) | 8 (13.8) | 24 (14.5) | 4 (14.3) | 12 (25.5) | 6 (13.3) | |
| Other | 2 (8.7) | 5 (8.6) | 17 (10.2) | 1 (3.6) | 3 (6.4) | 1 (2.2) | |
|
| |||||||
| Mean (SD) | Mean (SD) | Mean (SD) | Mean (SD) | Mean (SD) | Mean (SD) | ||
|
| |||||||
| Age | 48.96 (11.04) | 59.07 (9.96) | 52.15 (13.36) | 55.04 (9.23) | 48.81 (12.47) | 52.24 (14.80) | |
| Total n | 23 | 58 | 166 | 28 | 47 | 45 | |
Note: Patients could be diagnosed with multiple subtypes; hence, totals add up to more than 100%.
Abbreviations: CLBP-NeP, chronic lower back pain with a neuropathic component; CNP, central neuropathic pain; DPN, diabetic peripheral neuropathy; NeP, neuropathic pain; ON, other neuropathic pain; PSN, post-surgical neuropathy; PTN, post-trauma neuropathy.
CLBP-NeP (n=166) was the most common syndrome diagnosed, followed by DPN (n=58), PTN (n=47), PSN (n=28), and CNP (n=23). Among those diagnosed, 193 participants (64.5%) were diagnosed with one NeP syndrome, 54 (18.1%) were diagnosed with two NeP syndromes, and seven (2.3%) were diagnosed with three NeP syndromes. In addition, 45 participants were diagnosed as having NeP but did not meet the criteria for the aforementioned syndromes. Most participants in the ON group were not given a specific diagnosis (n=28, 62.2%), but those that had a diagnosis were most commonly diagnosed with cervical neuropathy (n=6, 13.3%), focal neuropathies (n=5, 11.1%), and peripheral neuropathies not classified as DPN (n=4, 8.9%) (Table S1).
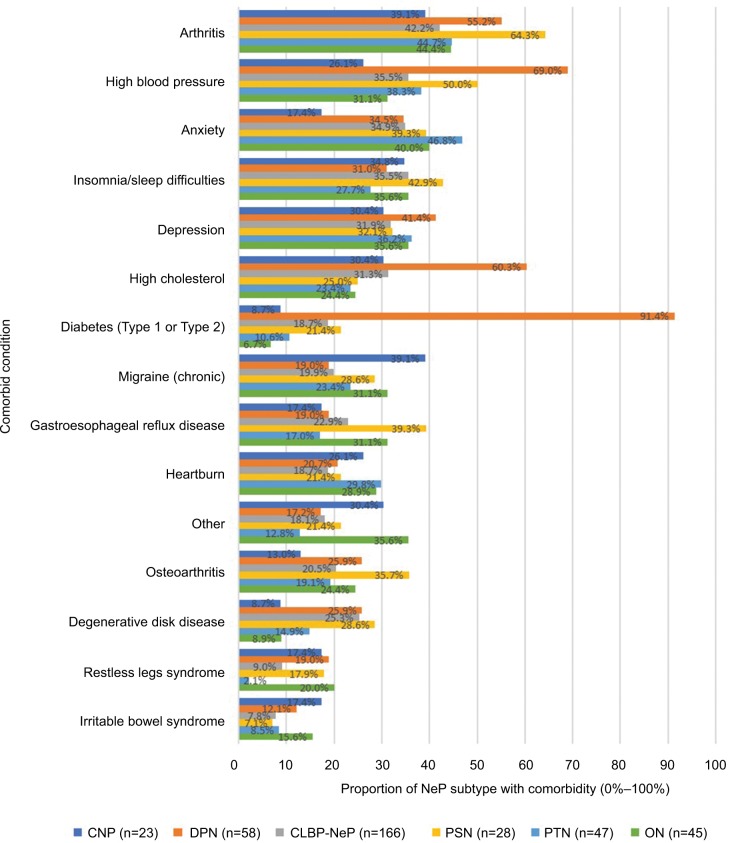
Across all NeP groups, arthritis was consistently in the top most reported comorbid conditions and the most common for patients with CNP (n=9, 39.1%), CLBP-NeP (n=70, 42.2%), PSN (n=18, 64.3%), and ON (n=20, 44.4%) (Figure 2). Anxiety was the most common comorbidity reported by patients with PTN (n=22, 46.8%). Across each group, diabetes (type 1 or type 2) was less frequently reported, except by those with DPN (n=53, 91.4%) where it was the most frequently reported comorbid condition. Of the patients diagnosed with NeP, three (1.0%) reported no comorbidities, 37 (12.5%) reported one comorbidity, 35 (11.7%) reported two comorbidities, 32 (10.8%) reported three comorbidities, and 192 (63.7%) reported four or more comorbidities.
Figure 2.
The top 15 comorbid conditions reported by patients diagnosed with NeP.
Note: Patients could be diagnosed with multiple subtypes; hence, totals add up to more than 100%.
Abbreviations: CLBP-NeP, chronic lower back pain with a neuropathic component; CNP, central neuropathic pain; DPN, diabetic peripheral neuropathy; NeP, neuropathic pain; PSN, post-surgical neuropathy; PTN, post-trauma neuropathy; ON, other neuropathic pain.
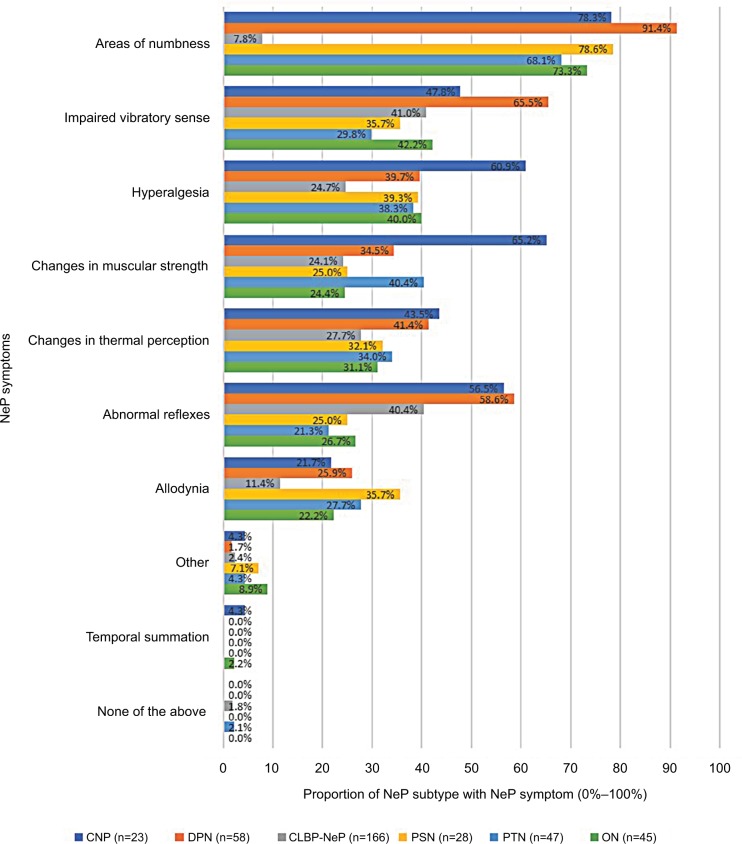
Areas of numbness was the most commonly reported symptom for all five major NeP syndromes and ON patients (Figure 3), with over 68% of patients in each subgroup reporting this symptom and 91.4% of DPN patients reporting numbness. Impaired vibration, hyperalgesia, and changes in muscular strength were the second most commonly reported symptoms for the DPN/CLBP-NeP/ON, PSN, and CNP/PTN patient groups, respectively.
Figure 3.
NeP symptoms exhibited by physician-confirmed NeP patient during the exam.
Note: Patients could be diagnosed with multiple subtypes; hence, totals add up to more than 100%.
Abbreviations: CLBP-NeP, chronic lower back pain with a neuropathic component; CNP, central neuropathic pain; DPN, diabetic peripheral neuropathy; NeP, neuropathic pain; PSN, post-surgical neuropathy; PTN, post-trauma neuropathy; ON, other neuropathic pain.
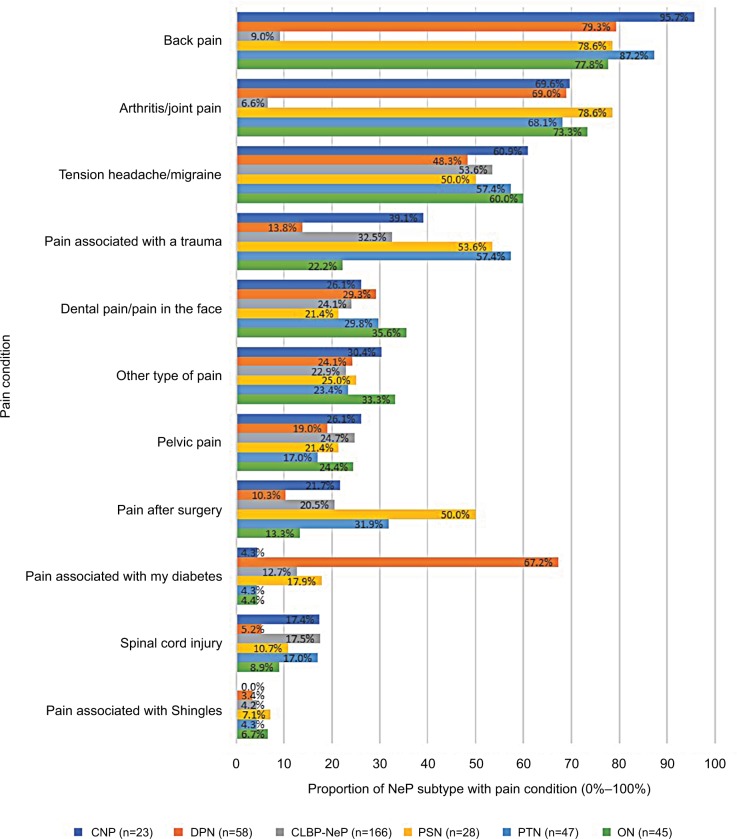
The top most commonly reported pain for each group was back pain, and arthritis/joint pain was the second most commonly reported pain for each group. Tension headache/migraine, pain associated with trauma, and pain associated with diabetes were the third most frequently reported symptom for CNP/CLBP-NeP/ON, PSN, and DPN, respectively, with tension headache/migraine and post-surgical pain tying for third in the PSN group (Figure 4).
Figure 4.
Pain conditions reported by patients diagnosed with NeP.
Note: Patients could be diagnosed with multiple subtypes; hence, totals add up to more than 100%.
Abbreviations: CLBP-NeP, chronic lower back pain with a neuropathic component; CNP, central neuropathic pain; DPN, diabetic peripheral neuropathy; NeP, neuropathic pain; PSN, post-surgical neuropathy; PTN, post-trauma neuropathy; ON, other neuropathic pain.
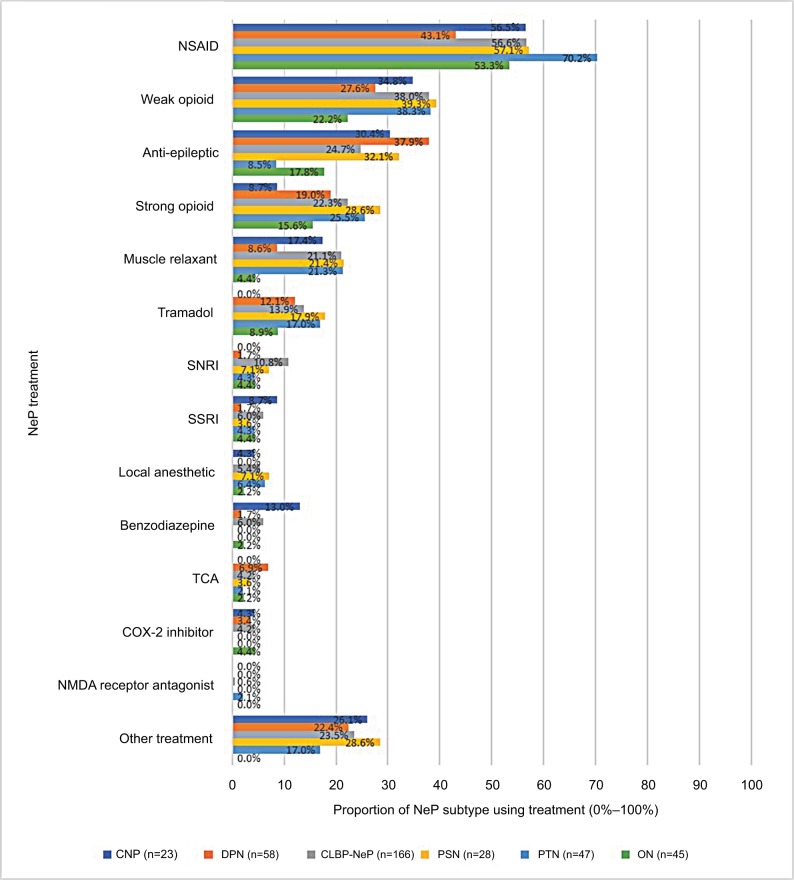
The most commonly reported medication used to treat pain, across all groups, was non-steroidal anti-inflammatory drugs (NSAIDs): CNP (n=13, 56.5%), DPN (n=25, 43.1%), CLBP (n=94, 56.6%), PSN (n=16, 57.1%), PTN (n=33, 70.2%), and ON (n=24, 53.3%) (Figure 5). Weak opioids and anti-epileptics were in the top three most commonly reported treatments for all groups, except in patients with PTN, where anti-epileptics were less common and strong opioids were among the top three medications used (n=12, 25.5%).
Figure 5.
Clinical features of NeP and the clinical profile of patients for each NeP syndrome: medication use for NeP.
Note: Patients could be diagnosed with multiple subtypes; hence, totals add up to more than 100%.
Abbreviations: CLBP-NeP, chronic lower back pain with a neuropathic component; CNP, central neuropathic pain; COX-2, cyclooxygenase-2; DPN, diabetic peripheral neuropathy; ON, other neuropathic pain; NeP, neuropathic pain; NMDA, N-methyl-D-aspartate; NSAID, non-steroidal anti-inflammatory drug; PSN, post-surgical neuropathy; PTN, post-trauma neuropathy; SNRI, serotonin and norepinephrine reuptake inhibitor; SSRI, selective serotonin reuptake inhibitor; TCA, tricyclic antidepressant.
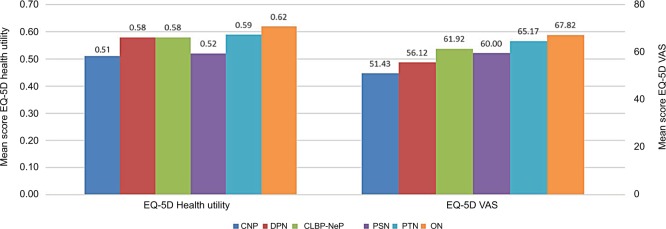
Results of measures assessing patient-reported function were generally similar across subgroups (Figure 6); however, ON patients reported the highest score on the EQ-5D-3L health utilities index (M=0.62, SD=0.21) and the EQ VAS (M=67.82, SD=17.46). CNP and PSN groups, on average, had the lowest scores on these measures (CNP EQ-5D-3L health utilities index: M=0.51, SD=0.23; PSN EQ VAS: M=51.43, SD=21.86). The mean scores for these two groups were substantially lower than the US norms, by an amount that is considered to be clinically meaningful (ie, the MID) for the measure. Furthermore, a comparison of these scores across the NeP syndromes found that differences between three pairs of variables exceeded the MID. These were CNP and PTN (mean difference =0.08), CNP and ON (mean difference =0.11), and PSN and ON (mean difference =0.10).32,33,35,36
Figure 6.
Means on health status and economic burden of patients for each NeP subtype: EQ-5D.
Abbreviations: CLBP-NeP, chronic lower back pain with a neuropathic component; CNP, central neuropathic pain; DPN, diabetic peripheral neuropathy; EQ-5D, EuroQol 5 Dimensions; NeP, neuropathic pain; PSN, post-surgical neuropathy; PTN, post-trauma neuropathy; ON, other neuropathic pain.
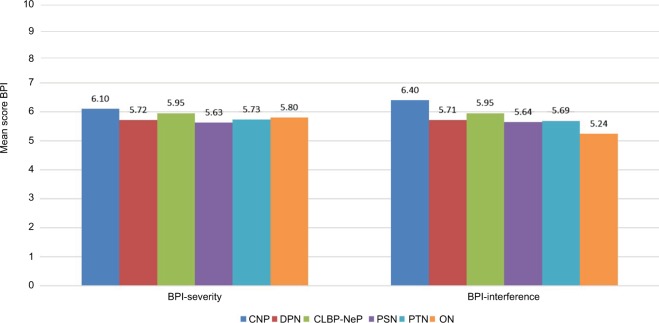
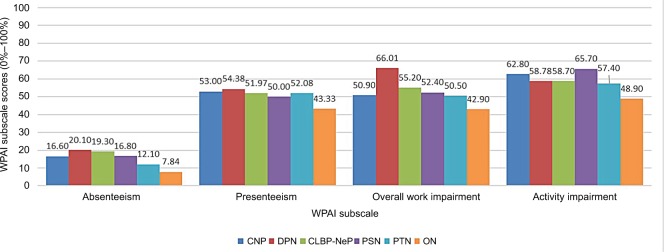
All syndromes tended to report similar levels of BPI-Severity and BPI-Interference, with scores within 1 SD of each other. Those with CNP, on average, reported the highest scores on the BPI (BPI-Severity: M=6.10, SD=1.89; BPI-Interference: M=6.40, SD=1.89) (Figure 7), while those with PSN, on average, had the lowest BPI-Severity score (M=5.63, SD=1.66) and the ON group, on average, possessed the lowest score on BPI-Interference (M=5.24, SD=2.32). Work productivity scores (Figure 8) demonstrated a relatively low level of absenteeism across the groups compared to presenteeism, and overall work impairment. Social activity impairment was about the same level for each group. Participants diagnosed with DPN reported slightly higher levels of impairment in all categories except for activity impairment, whereas the ON group reported the lowest impairment across all measures.
Figure 7.
Means on health status and economic burden of patients for each NeP subtype: BPI.
Abbreviations: BPI, Brief Pain Inventory; CLBP-NeP, chronic lower back pain with a neuropathic component; CNP, central neuropathic pain; DPN, diabetic peripheral neuropathy; NeP, neuropathic pain; PSN, post-surgical neuropathy; PTN, post-trauma neuropathy; ON, other neuropathic pain.
Figure 8.
Economic and activity burden for each NeP syndrome: WPAI.
Abbreviations: CLBP-NeP, chronic lower back pain with a neuropathic component; CNP, central neuropathic pain; DPN, diabetic peripheral neuropathy; NeP, neuropathic pain; ON, other neuropathic pain; PSN, post-surgical neuropathy; PTN, post-trauma neuropathy; WPAI, Work Productivity and Impairment.
Discussion
Individuals diagnosed with NeP by a physician reported a high degree of disease burden across all syndromes. Previous research has typically focused on a single major NeP syndrome.8–12 The direct comparisons made in the current study support the similarity of patient burden across syndromes. The majority (63.4%) of patients with painDE-TECT scores ≥19 were diagnosed with NeP by a physician, although this is somewhat lower than the positive predictive value found in other studies. The most likely explanation is that the prevalence of NeP in our general patient population was lower4 than that used in the original sample of back pain and other potential NeP subpopulations.26–30 This resulted in a lower positive predictive value for the same level of sensitivity and specificity.
CLBP-NeP was the most common syndrome, followed by DPN, PTN, ON, PSN, and CNP. Our results generally support previous epidemiological research that showed that those diagnosed with DPN, PTN, PSN, and CNP tended to include less educated, older women who reported poorer overall health,6 while those with PTN were predominantly younger and male; a group that is more likely to report trauma-related NeP resulting from injuries sustained from violence, traffic accidents, and industrial accidents.37,38 More than 90% of patients diagnosed by physicians with DPN reported a diagnosis of diabetes. As expected, self-reported back pain was high in patients diagnosed with CLBP-NeP by physicians. One possible explanation for these high rates is that both DPN and CLBP-NeP regularly interfere with physical function and the ability to engage in tasks, and/or require constant monitoring, and treatment, such that patients are likely to think about them on a regular basis and thus accurately report this information.
Importantly, means scores on the EQ-5D-3L for all six groups were substantially lower than the US norms for both components of the scale and greater than the MID for the health utilities index scores, indicating the NeP patients report a high degree of impairment.32,33,35,36 Although scores were generally similar across subgroups, those with CNP reported the lowest scores overall for health status. These findings generally align with a meta-analysis which found that those with CNP had much lower mean health utilities than individuals with most other NeP syndromes.13
Specifically, those with CNP also reported the highest BPI scores, suggesting that these participants experienced more severe pain and greater pain interference with functioning. Examination of work productivity outcomes found a substantial degree of impairment across all six groups, but those with DPN reported slightly higher levels than all other groups in this study and more impairment than has previously been reported in other research on this same NeP syndrome.14 Those with PSN reported a slightly higher degree of activity impairment in this study, consistent with previous reports in a cross-sectional survey of PSN/PTN patients.15
Despite differences in HRQoL and functioning, the clinical features and profile of NeP were similar across major NeP syndromes. A previous cross-sectional observational study found that psychiatric comorbidities and sleep difficulties were experienced by between 35% and 42% of those with central or peripheral NeP in the aggregate,39 in line with the estimates provided in the current study. In addition, and consistent with previous epidemiological research,5 a variety of abnormal sensory symptoms were common among patients, with areas of numbness most often reported by those with NeP in this study.
There were also similarities regarding pharmacological treatment patterns for NeP. Specifically, all six groups reported high use of NSAIDs and weak opioids, even though they are not the mainstay for treating NeP. These findings are consistent with previous studies.4,14,15,40 While anti-convulsants were also commonly used, the other frontline medications, as indicated in the most recent and comprehensive guideline,41 of tricyclic antidepressants, and serotonin and norepinephrine reuptake inhibitors were less commonly used.
One potential explanation for this disparity is the co-occurrence of nociceptive pain, which is frequently reported by NeP patients;8,14,15,39,42,43 however, this information was not collected in the current study. Another possibility is that providers are not prescribing guideline-driven treatment regimens.44 Should this be the case, this suggests that awareness of NeP and the appropriate treatment of this condition need to be improved, especially among physicians.
Limitations
There are several important limitations that should be considered in interpreting the results of this paper. As with any patient-reported study, survey responses were subject to recall and self-reporting biases, which could introduce additional measurement error. While all participating physicians and staff underwent training to ensure that the data collection process was standardized across sites, physician examinations were not standardized, thereby potentially leading to some variability in the assessments that may bias the results. It is important to note, however, that chronic pain syndromes remain a clinical diagnosis, and that there are no objective diagnostic tests for NeP conditions.
Although participants were not from a randomly selected population, they were sampled from a geographically and demographically diverse sample of adults, and their diagnosis was made by a physician. Nonetheless, only those who were located within a reasonable proximity of at least one of the study sites (ie, within 1-hour driving distance or about 30 miles were eligible to participate, which may have restricted the generalizability.
Finally, the time and effort involved in patients seeing a physician for the evaluation could explain the high number of unemployed participants who engaged in the study, making our sample less representative of the general population, although the mean age of the sample was representative. Thus, it is possible that the results may not generalize to the population of US adults with NeP who live outside the metropolitan areas, or who are employed.
Conclusions
This relatively large study on the characteristics and consequences of NeP found that CLBP-NeP is the most prevalent major NeP syndrome, with NSAIDs or opioids being most frequently used by participants for chronic pain relief. In general, patients reported similar levels of impairment across a range of domains. Ultimately, the results of this exploratory cross-sectional study may provide insights into the extent of the patient burden attributed to common NeP syndromes in the US.
Supplementary material
Table S1.
Patients diagnosed with other neuropathic pain syndromes
| Classification/diagnosis | n (%) |
|---|---|
| Cervical neuropathy | |
| Cervical radiculopathy | 5 (11.1) |
| Neck | 1 (2.2) |
| Focal neuropathies | |
| Carpal tunnel/median neuropathy | 3 (6.7) |
| Brachial plexopathy | 1 (2.2) |
| Ulnar neuropathy | 1 (2.2) |
| Peripheral neuropathies not classified as diabetic | 4 (8.9) |
| peripheral neuropathy | |
| Cancer | 1 (2.2) |
| Not reported | 28 (62.2) |
|
| |
| Total | 45 |
Note: This information was reported as free text; therefore, some of the syndromes are not optimally reported.
Acknowledgments
The authors wish to acknowledge the literature review and editing assistance of Martine C Maculaitis, PhD, Errol J Philip, PhD, and Shawna R Calhoun, MPH, on behalf of Kantar Health. The study described in this manuscript was funded by Pfizer, Inc. The abstract of this paper was presented at the meeting of the American Pain Society, Pittsburgh, PA, USA, as a poster presentation with interim findings. The poster’s abstract was published in “Poster Abstracts” in the Journal of Pain: http://dx.doi.org/10.1016/j.jpain.2017.02.274.
Footnotes
Disclosure
MH, JCC, AS, BP, PH, AHA, and MD are employees of Pfizer, Inc, which funded the current study. KK-C and RL are employees of Kantar Health, which received funding from Pfizer, Inc for conducting and reporting on the current study, and for manuscript development. IK was employed by Kantar Health at the time this study was conducted. MD was a Kantar employee during study conduct and is a current employee of Pfizer and was involved in manuscript development as a Pfizer employee. BRS, JDM, and JTF were investigators for this study. They were not financially compensated for their collaborative efforts or publication-related activities, but JTF and JDM have previously served as study design consultants for Pfizer and have received investigator-initiated grant funding for studies of pain unrelated to this study. JDM has served as a consultant to: Editas Medicine, Flexion Therapeutics, Quark, Quartet, Collegium, Purdue, Biogen, Novartis, Aptinyx, Nektar, Plasmasurgical, Allergan, Grunenthal , Eli Lilly, Depomed, Jansen, Teva, Kempharm, Abbott, Plasmasurgical, Chromocell, Convergence, Inspirion, Pfizer, Sanofi, Diacchi Sankyo, and Trevena. JDM has also received a research grant from Pfizer. The authors report no other conflicts of interest in this work.
References
- 1.International Association for the Study of Pain (IASP) Neuropathic pain. 2014. [Accessed July 3, 2014]. Available from: http://www.iasp-pain.org/Education/Content.aspx?ItemNumber=1698&navItemNumber=576.
- 2.Haanpää ML, Backonja MM, Bennett MI, et al. Assessment of neuropathic pain in primary care. Am J Med. 2009;122(10 Suppl):S13–S21. doi: 10.1016/j.amjmed.2009.04.006. [DOI] [PubMed] [Google Scholar]
- 3.van Hecke O, Austin SK, Khan RA, Smith BH, Torrance N. Neuropathic pain in the general population: a systematic review of epidemiological studies. Pain. 2014;155(4):654–662. doi: 10.1016/j.pain.2013.11.013. [DOI] [PubMed] [Google Scholar]
- 4.Dibonaventura MD, Sadosky A, Concialdi K, et al. The prevalence of probable neuropathic pain in the US: results from a multimodal general-population health survey. J Pain Res. 2017;10:2525–2538. doi: 10.2147/JPR.S127014. [DOI] [PMC free article] [PubMed] [Google Scholar]
- 5.Smith BH, Torrance N. Neuropathic pain. In: Croft P, Blyth FM, van der Windt D, editors. Chronic Pain Epidemiology. New York: Oxford University Press; 2010. pp. 209–234. [Google Scholar]
- 6.Smith BH, Torrance N. Epidemiology of neuropathic pain and its impact on quality of life. Curr Pain Headache Rep. 2012;16(3):191–198. doi: 10.1007/s11916-012-0256-0. [DOI] [PubMed] [Google Scholar]
- 7.Andrew R, Derry S, Taylor RS, Straube S, Phillips CJ. The costs and consequences of adequately managed chronic non-cancer pain and chronic neuropathic pain. Pain Pract. 2014;14(1):79–94. doi: 10.1111/papr.12050. [DOI] [PubMed] [Google Scholar]
- 8.Schaefer C, Sadosky A, Mann R, et al. Pain severity and the economic burden of neuropathic pain in the United States: BEAT Neuropathic Pain Observational Study. Clinicoecon Outcomes Res. 2014;6:483–496. doi: 10.2147/CEOR.S63323. [DOI] [PMC free article] [PubMed] [Google Scholar]
- 9.Argoff CE, Cole BE, Fishbain DA, Irving GA. Diabetic peripheral neuropathic pain: clinical and quality-of-life issues. Mayo Clin Proc. 2006;81(4 Suppl):S3–S11. doi: 10.1016/s0025-6196(11)61474-2. [DOI] [PubMed] [Google Scholar]
- 10.Casellini CM, Vinik AI. Clinical manifestations and current treatment options for diabetic neuropathies. Endocr Pract. 2007;13(5):550–566. doi: 10.4158/EP.13.5.550. [DOI] [PubMed] [Google Scholar]
- 11.Davies M, Brophy S, Williams R, Taylor A. The prevalence, severity, and impact of painful diabetic peripheral neuropathy in type 2 diabetes. Diabetes Care. 2006;29(7):1518–1522. doi: 10.2337/dc05-2228. [DOI] [PubMed] [Google Scholar]
- 12.van Acker K, Bouhassira D, de Bacquer D, et al. Prevalence and impact on quality of life of peripheral neuropathy with or without neuropathic pain in type 1 and type 2 diabetic patients attending hospital outpatients clinics. Diabetes Metab. 2009;35(3):206–213. doi: 10.1016/j.diabet.2008.11.004. [DOI] [PubMed] [Google Scholar]
- 13.Doth AH, Hansson PT, Jensen MP, Taylor RS. The burden of neuropathic pain: a systematic review and meta-analysis of health utilities. Pain. 2010;149(2):338–344. doi: 10.1016/j.pain.2010.02.034. [DOI] [PubMed] [Google Scholar]
- 14.Sadosky A, Schaefer C, Mann R, et al. Burden of illness associated with painful diabetic peripheral neuropathy among adults seeking treatment in the US: results from a retrospective chart review and cross-sectional survey. Diabetes Metab Syndr Obes. 2013;6:79–92. doi: 10.2147/DMSO.S37415. [DOI] [PMC free article] [PubMed] [Google Scholar]
- 15.Parsons B, Schaefer C, Mann R, et al. Economic and humanistic burden of post-trauma and post-surgical neuropathic pain among adults in the United States. J Pain Res. 2013;6:459–469. doi: 10.2147/JPR.S44939. [DOI] [PMC free article] [PubMed] [Google Scholar]
- 16.Freynhagen R, Baron R, Gockel U, Tölle TR. painDETECT: a new screening questionnaire to identify neuropathic components in patients with back pain. Curr Med Res Opin. 2006;22(10):1911–1920. doi: 10.1185/030079906X132488. [DOI] [PubMed] [Google Scholar]
- 17.Timmerman H, Wilder-Smith O, van Weel C, Wolff A, Vissers K. Detecting the neuropathic pain component in the clinical setting: a study protocol for validation of screening instruments for the presence of a neuropathic pain component. BMC Neurol. 2014;14:94. doi: 10.1186/1471-2377-14-94. [DOI] [PMC free article] [PubMed] [Google Scholar]
- 18.Cappelleri JC, Bienen EJ, Koduru V, Sadosky A. Measurement properties of painDETECT by average pain severity. Clinicoecon Outcomes Res. 2014;6:497–504. doi: 10.2147/CEOR.S68997. [DOI] [PMC free article] [PubMed] [Google Scholar]
- 19.Cappelleri JC, Koduru V, Bienen EJ, Sadosky A. A cross-sectional study examining the psychometric properties of the painDETECT measure in neuropathic pain. J Pain Res. 2015;8:159–167. doi: 10.2147/JPR.S80046. [DOI] [PMC free article] [PubMed] [Google Scholar]
- 20.Cappelleri JC, Koduru V, Bienen EJ, Sadosky A. Characterizing neuropathic pain profiles: enriching interpretation of painDETECT. Patient Relat Outcome Meas. 2016;7:93–99. doi: 10.2147/PROM.S101892. [DOI] [PMC free article] [PubMed] [Google Scholar]
- 21.Moreton BJ, Tew V, das Nair R, Wheeler M, Walsh DA, Lincoln NB. Pain phenotype in patients with knee osteoarthritis: classification and measurement properties of painDETECT and self-report Leeds assessment of neuropathic symptoms and signs scale in a cross-sectional study. Arthritis Care Res. 2015;67(4):519–528. doi: 10.1002/acr.22431. [DOI] [PMC free article] [PubMed] [Google Scholar]
- 22.de Andrés J, Pérez-Cajaraville J, Lopez-Alarcón MD, et al. Cultural adaptation and validation of the painDETECT scale into Spanish. Clin J Pain. 2012;28(3):243–253. doi: 10.1097/AJP.0b013e31822bb35b. [DOI] [PubMed] [Google Scholar]
- 23.Cleeland CS, Ryan KM. Pain assessment: global use of the Brief Pain Inventory. Ann Acad Med Singapore. 1994;23(2):129–138. [PubMed] [Google Scholar]
- 24.Keller T, Freynhagen R, Tölle TR, et al. A retrospective analysis of the long-term test-retest stability of pain descriptors of the painDETECT questionnaire. Curr Med Res Opin. 2016;32(2):343–349. doi: 10.1185/03007995.2015.1125869. [DOI] [PubMed] [Google Scholar]
- 25.Sadosky A, Koduru V, Bienen EJ, Cappelleri JC. Characterizing individual painDETECT symptoms by average pain severity. Clinicoecon Outcomes Res. 2016;8:361–366. doi: 10.2147/CEOR.S105402. [DOI] [PMC free article] [PubMed] [Google Scholar]
- 26.Bennett MI, Rayment C, Hjermstad M, Aass N, Caraceni A, Kaasa S. Prevalence and aetiology of neuropathic pain in cancer patients: a systematic review. Pain. 2012;153(2):359–365. doi: 10.1016/j.pain.2011.10.028. [DOI] [PubMed] [Google Scholar]
- 27.Beith ID, Kemp A, Kenyon J, Prout M, Chestnut TJ. Identifying neuropathic back and leg pain: a cross-sectional study. Pain. 2011;152(7):1511–1516. doi: 10.1016/j.pain.2011.02.033. [DOI] [PubMed] [Google Scholar]
- 28.Elias LA, Yilmaz Z, Smith JG, et al. PainDETECT: a suitable screening tool for neuropathic pain in patients with painful post-traumatic trigeminal nerve injuries? Int J Oral Maxillofac Surg. 2014;43(1):120–126. doi: 10.1016/j.ijom.2013.07.004. [DOI] [PubMed] [Google Scholar]
- 29.Epping R, Verhagen AP, Hoebink EA, Rooker S, Scholten-Peeters GGM. The diagnostic accuracy and test-retest reliability of the Dutch PainDETECT and the DN4 screening tools for neuropathic pain in patients with suspected cervical or lumbar radiculopathy. Musculoskelet Sci Pract. 2017;30:72–79. doi: 10.1016/j.msksp.2017.05.010. [DOI] [PubMed] [Google Scholar]
- 30.Tampin B, Briffa NK, Goucke R, Slater H. Identification of neuropathic pain in patients with neck/upper limb pain: application of a grading system and screening tools. Pain. 2013;154(12):2813–2822. doi: 10.1016/j.pain.2013.08.018. [DOI] [PubMed] [Google Scholar]
- 31.Rabin R, de Charro F. EQ-5D: a measure of health status from the EuroQol Group. Ann Med. 2001;33(5):337–343. doi: 10.3109/07853890109002087. [DOI] [PubMed] [Google Scholar]
- 32.Luo N, Johnson JA, Shaw JW, Feeny D, Coons SJ. Self-reported health status of the general adult U.S. population as assessed by the EQ-5D and Health Utilities Index. Med Care. 2005;43(11):1078–1086. doi: 10.1097/01.mlr.0000182493.57090.c1. [DOI] [PubMed] [Google Scholar]
- 33.Walters SJ, Brazier JE. Comparison of the minimally important difference for two health state utility measures: EQ-5D and SF-6D. Qual Life Res. 2005;14(6):1523–1532. doi: 10.1007/s11136-004-7713-0. [DOI] [PubMed] [Google Scholar]
- 34.Reilly MC, Zbrozek AS, Dukes EM. The validity and reproducibility of a work productivity and activity impairment instrument. Pharmacoeconomics. 1993;4(5):353–365. doi: 10.2165/00019053-199304050-00006. [DOI] [PubMed] [Google Scholar]
- 35.Johnson JA, Coons SJ. Comparison of the EQ-5D and SF-12 in an adult US sample. Qual Life Res. 1998;7(2):155–166. doi: 10.1023/a:1008809610703. [DOI] [PubMed] [Google Scholar]
- 36.Luo N, Johnson J, Coons SJ. Using instrument-defined health state transitions to estimate minimally important differences for four preference-based health-related quality of life instruments. Med Care. 2010;48(4):365–371. doi: 10.1097/mlr.0b013e3181c162a2. [DOI] [PubMed] [Google Scholar]
- 37.Mitchell R, Curtis K, Fisher M. Understanding trauma as a men’s health issue: sex differences in traumatic injury presentations at a level 1 trauma center in Australia. J Trauma Nurs. 2012;19(2):80–88. doi: 10.1097/JTN.0b013e3182562955. [DOI] [PubMed] [Google Scholar]
- 38.Norton R, Kobusingye O. Injuries. N Engl J Med. 2013;368(18):1723–1730. doi: 10.1056/NEJMra1109343. [DOI] [PubMed] [Google Scholar]
- 39.Schaefer C, Mann R, Sadosky A, et al. Burden of illness associated with peripheral and central neuropathic pain among adults seeking treatment in the United States: a patient-centered evaluation. Pain Med. 2014;15(12):2105–2119. doi: 10.1111/pme.12502. [DOI] [PMC free article] [PubMed] [Google Scholar]
- 40.Sadosky A, Schaefer C, Mann R. Burden of chronic low back pain with a neuropathic pain component: retrospective chart review and cross-sectional survey among adults seeking treatment in the United States. J Pain Relief. 2014;3(5) [Google Scholar]
- 41.Finnerup NB, Attal N, Haroutounian S, et al. Pharmacotherapy for neuropathic pain in adults: a systematic review and meta-analysis. Lancet Neurol. 2015;14(2):162–173. doi: 10.1016/S1474-4422(14)70251-0. [DOI] [PMC free article] [PubMed] [Google Scholar]
- 42.Mann R, Sadosky A, Schaefer C, et al. Burden of HIV-Related Neuropathic Pain in the United States. J Int Assoc Provid AIDS Care. 2016;15(2):114–125. doi: 10.1177/2325957415592474. [DOI] [PubMed] [Google Scholar]
- 43.Mann R, Schaefer C, Sadosky A, et al. Burden of spinal cord injury-related neuropathic pain in the United States: retrospective chart review and cross-sectional survey. Spinal Cord. 2013;51(7):564–570. doi: 10.1038/sc.2013.34. [DOI] [PubMed] [Google Scholar]
- 44.Dworkin RH, Panarites CJ, Armstrong EP, Malone DC, Pham SV. Is treatment of postherpetic neuralgia in the community consistent with evidence-based recommendations? Pain. 2012;153(4):869–875. doi: 10.1016/j.pain.2012.01.015. [DOI] [PubMed] [Google Scholar]
Associated Data
This section collects any data citations, data availability statements, or supplementary materials included in this article.
Supplementary Materials
Table S1.
Patients diagnosed with other neuropathic pain syndromes
| Classification/diagnosis | n (%) |
|---|---|
| Cervical neuropathy | |
| Cervical radiculopathy | 5 (11.1) |
| Neck | 1 (2.2) |
| Focal neuropathies | |
| Carpal tunnel/median neuropathy | 3 (6.7) |
| Brachial plexopathy | 1 (2.2) |
| Ulnar neuropathy | 1 (2.2) |
| Peripheral neuropathies not classified as diabetic | 4 (8.9) |
| peripheral neuropathy | |
| Cancer | 1 (2.2) |
| Not reported | 28 (62.2) |
|
| |
| Total | 45 |
Note: This information was reported as free text; therefore, some of the syndromes are not optimally reported.


